MCDD trade ideas

MCD To $230 After EarningsEarnings is a risky time to trade options. Today I was looking for my next stock to trade options with and I saw a great buy opportunity for MCD with various technical indicators I use. I wasn't disappointed seeing myself up 5% and the potential to go up much higher. However, after I bought the position and the market closed I realized MCD is reporting earnings. Has anyone else ever made that mistake? Or intentionally? Either way I did some digging on the internet and found a report that offered technical evidence that is accurate 70% of the time that MCD is predicted to beat earnings. Beating earnings is one thing, but a good conference call is another.
I am excited to see that they have a 70% chance at beating earnings, and my personal belief is that a conference call should not have too negative of an impact unless something really looks wrong for the outlook of McDonalds but that seems highly unlikely.
So with a predicted earnings beat, and uneventful conference call. I put in a trend line that outlines McDonalds potential high for Monday 11/9. The trend like peaks at $228 while I believe it could go even higher and hit $230.
I could be completely wrong and McDonalds could miss earnings and the opposite could happen, or we wouldn't see that high of price movement. But the odds of an earnings beat are in my favor and I will share my profit or loss on Monday. So make sure to follow!
What do you think will happen? If you agree leave a like! If you have additional detail or disagree please leave a comment! Thanks!

McD Remains on the Long Side despite Pandemic & Election
Price finds founding at fib 61.8%
Price pivots near point of control.
on this case, price has squeeze on the previous swing low with stop hunting candle. It is foresee to rally after forming bullish price action.

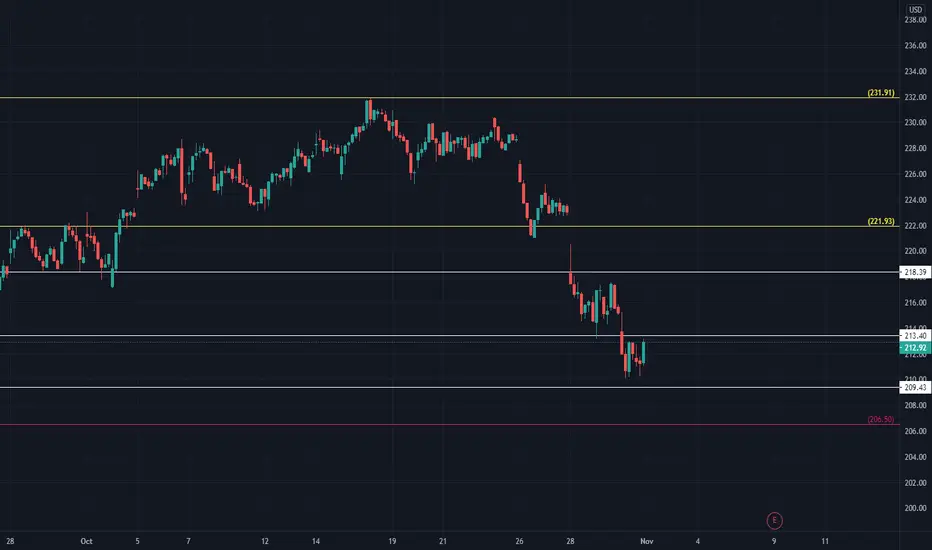
"MCD Long" Bullish will this be able to push back to $221.93+NYSE:MCD Will be watching to see if this can break the range and reclaim 213.40 area and hold with a nice base for conformation for a move back towards that 218.35 which my play as some resistance but once and if it givess a clean break then I feel that 221.93 area will be in the cards and that will be a nice conformation of the sort term trend reversal. One must understand that the over all market will also be key to this because the more of a spike in covid-19 the more difficult this swing will be .

Daily Shooting Star Reversal Candlestick Pattern Just FormedMCD forming daily bearish divergence on all the indicators i have on my chart along with having a daily shooting star reversal candle and is currently below the contracting channel I have plotted; I think this has atleast a decent amount to go down from here.

MCD Long - Regression TrendThe McDonald 1hr chart shows a regression trend. My bet is that it will hit the support and rise.


Cup and HandleNV is very high and short interest is very low
Cup and handle patterns are only valid over long entry level
MCD broke from an ascending triangle at 201.80ish
Chart is bullish other than a possible bearish rising wedge.
RWs are often very long term patterns and only valid if price breaks bottom trendline
Some stocks merely dip a candle wick down through trendline and off they go again
Some can fall quite a ways
All patterns have the potential for failure
Not a recommendation


MCD to $220MCD should hit $220 a share this upcoming week based on growing bearish divergence and a high RSI. We are close to dipping below the moving average as well.

$MCD$MCD Idea
- Decent supports at 216 & 218
- Bounced off 200 D on 15Min
- 3x Bounce off trendline in late september
- MACD crossing on the 15Min & also on its way to crossing on 30Min
Entry points: 216-220
If 216 is reached would need to see QUICK & STRONG bounce
218 is probably optimal entry if 216 bounce does not occur, but would still need to see solid bounce off that level or 200D Moving Average
PTs: 222, 223.7, 226.7 (ATH)
Levels: I see resistance at 221 but doesn't seem as strong as the 222 levels. If 222 is crossed, look for 223.7. If momentum is kept we have another resistance which seems lighter at 225 before trying to extend and/or break ATH levels at 226.7
Like I said, 218 is optimal because you will at least get to see what kind of momentum is building. I built a "wedge", so these can easily go either way.
So here is the plan if you see momentum dropping and the stock begin selling off:
- Moving Averages will begin to cross underneath the 200D
- 15Min MACD will head back towards red side to negative
- 218 will be broken, followed by a closer look at 216 levels
- IF 216 were to break, you'll be playing with bottom trend line.
- Beyond that is 214, and another trend line that I have placed in a longer time frame. (211-211.5)
PTs on short would be 214, 211, 209.5 or lower.
Trade at your own risk, I didn't hit your buy/sell button.


Short on open: 220.24 or higher
Real-Time Algorithmic Trading Signals. All trades are based on a Geometric HMM.
The Ingenuity Trading Model is a Geometric Hidden Markov Model with specific inputs related to Price, Time, Volume, and Volatility.
Our Algorithmic Trading Model offers real-time buy or sell signals with specific entry and exit prices. This affords you the freedom to successfully trade across all markets and market regimes. We are not interested in biased economic research or opinions on the latest Wall Street narratives. We do not trade based on conventional financial analysis. Our signals prove the power of taking a more scientific approach to trading the market.

MCD Will Rise Next Days !MCD Will Rise Next Days !
I Advais You To Buy Or Keep It in the portfolio
target 241 USD
StoopLoss 218 USD


MCD Possible Elliott Wave Theory Possible EW pattern in MCD. Looking for MCD to reach a wave 5 target around 228.

MCD cannot break the resistanceHi Traders
Looks like Mc Donalds Corp hit its ceiling again. With the strong rejection candle and the down GAP I expect more selling the next couple of days. A potential target could be the psychological level of 200$


MCD 09172020MCD has a really nice move yesterday, and today´s open is good for the stock, why is this true?, because SPY is having a really big gap down, and MCD is still in range, that shows us his strenght, the overnight price is short relative to yesterday´s close , for that reason, i am looking for longs at 222,25 and looking for shorts at 226,16

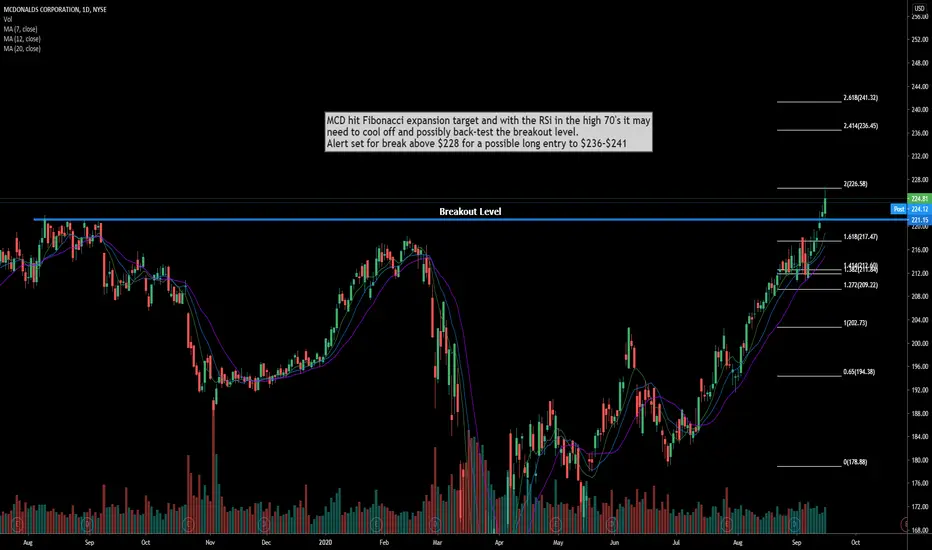
$MCD Mc Donalds Trade SetupMCD hit Fibonacci expansion target and with the RSi in the high 70's it may
need to cool off and possibly back-test the breakout level.
Alert set for break above $228 for a possible long entry to $236-$241