POSSIBLE SHORT FROM MONTHLY SUPPLY ON MACDONALDS CORP.Ascending trend line broken on the monthly creating a valid supply zone. Possible short bias.
MCDD trade ideas

Will McDonalds continiue it's uptrendHi Traders
On the weekly timeframe The Hitman Indicator showed a Buy Print last week. Let's check what could happen the next few weeks with this stock.
As you can see on the chart, the stock seems to jump off the area around EMA55 (the pink line) in its upward swings. The Hitman supports this with a buy-signal. So where could we expect it to go? To try to answer this question, I drew a Trend Based Fib Extension. I usually target the 1.272 line (Price: 229.80) with the Fib Extension. This would be roughly a 12% gain. I would also consider to take some profits out at the 1-line (Price: 218.77), just because we are in All-time high regions.

MCD Attempting to BottomMCD is struggling to form a short-term bottom at a non-support level. The stock had been under heavy distribution which triggered High Frequency Traders selling short as well as Pro Traders selling short, even while new Retail App Broker Investors were buying into the downtrend. Buy on the Dip strategies are in play, but the large lots overwhelmed the retail small lots. There is no Dark Pool Quiet Accumulation in this bottoming attempt.


$MCD- short, goor risk/rewardNYSE:MCD - short, looking for bounce off the resistance above the current price, target around $200, the lower trend line of the bullish parallel channel

MCD – Bullish Reversal to Gap Fill– Lovin’ ItTrade Entry
I am tapped for capital with other trades actively working.
If I were to enter, this would be my entry choices:
Jan. 24 Expiry. 200/205 Put Credit Spread. $2.50 credit. Risk and reward are even $2.50.
If you want to play earnings (which looks like good idea), move out to Jan. 31 or do both dates.
MCD above $205 at expiry keeps the whole credit.
Stops – MCD at $198 exit trade.
Exit at 50% profit or hold to expiry if looking bullish.
Chart Details
Bullish breakout of bear flag.
Bullish EMA cross and price 10WeekMA cross.
Price should head up to fill gaps IMO. Probably consolidate at each gap.
Watch RSI at 75 for bullish slowing.
Daily and Weekly trend both bullish. Looks good.
Previous MCD Chart
About Me
Thank you for liking, commenting, throwing up a chart, following, or viewing.
I am not a financial advisor. My comments and reviews are based on what I do with my personal accounts.
www.moneypatterns.com - Website will be ready for launch mid-January 2020. Thank you for your patience while I try to juggle everything and maintain the same standards.
Disclosure - I am long BTCUSD, GBTC. Short term GDX Bullish, SPXS Bullish, CRWD Bullish short term.

Taking out @ MacdonaldSome says food is a recession proof business but with many competitors in the Burger business, customers are now spoilt for choices. While MacDonald has enjoyed a good brand name and being the first few early adopters of Fast Food, many other are fast catching up as well.
If price level at 189.45 can hold , then we can see a recovery and possibly a breakout of the bearish trend line (red). The first target is 206 where there is a gap to be filled before the next gap at 215.
However, if the price level of 189.45 fails to support, then it is likely for the price to heads south towards 176 level to meet the gap.

$MCD missed last four earnings without ill-effectMCD is a safe solid stock, although oddly in XLY rather than XLP.
It has missed the last four earnings, and the pullbacks from those misses are fairly mild recover quickly. Even the double whammy of a miss and loss of CEO in Q319 started to recover within days. Note in Q418, the stock only fell 11.5% against a general market decline of 20%. In this respect it is quite similar to KO (although that is in XLP), another purveyor of junk consumption.
Assuming the current trend continues, a pullback on another earnings miss of 3.84% or less gives you a safe stock to return to $220 in 2020, and the PE return to the highs of 28.
Note MCD is a DJIA component, and risks being dragged on any macro DJIA collapse (election, rate hikes etc).

$MCD Forms Ascending TriangleWe are seeing an ascending triangle pattern for Mcdonalds. Potential breakout may happen anytime soon as the volume increases along with increasing price as well.

Well RetracedWe have retraced the rise since yesterday. As long as we hold above the cloud I see a dood chance for a further rise today as I am expecting some more fluctuations due to the expiry date.

MCD - Short Idea. This one popped out at me, price is creating a flag/pennant after a strong move down that has broken through strong levels, notably the 200 EMA on the daily.
I have taken the trade as its offered with my CFD broker.
1% Risk, 2:1 RR. Very much a swing trade.
-Happy Trading!

"McDonalds on a Weekly Ascending Channel" by ThinkingAntsOkDaily Chart Explanation:
- Price is on a Weekly Ascending Channel.
- Price broke the Inner Ascending Trendline.
- Price is on a Bearish Corrective Structure.
- Bearish CCI.
- If price breaks the Corr Structure, it has potential to move down towards the Bottom of the Channel.
Weekly Vision:
Updates coming soon!

Potential long opportunity - Low Risk, High Reward setup MCD has bounced off the bottom of a long term bullish channel and recently broke to the upside of a pennant pattern on the shorter time scale. We are seeing strong resistance in the $200 price area (+/- ~$5) from both historical price action, fib retracement, and psychological resistance. Positive trade news looks like it has yet to significantly impact MCD so this might just be a good time to get in on a long stock position or even a call option trade. Setting a stop loss just below the bottom of the long term bullish channel, and setting a profit zone at the top makes for about a 10:1 profit/loss ratio. Being a dominate multi national brand, a decent dividend, and with investors such as Warren Buffett, this might be a good opportunity to get in on a long term play. Would love to hear your thoughts!


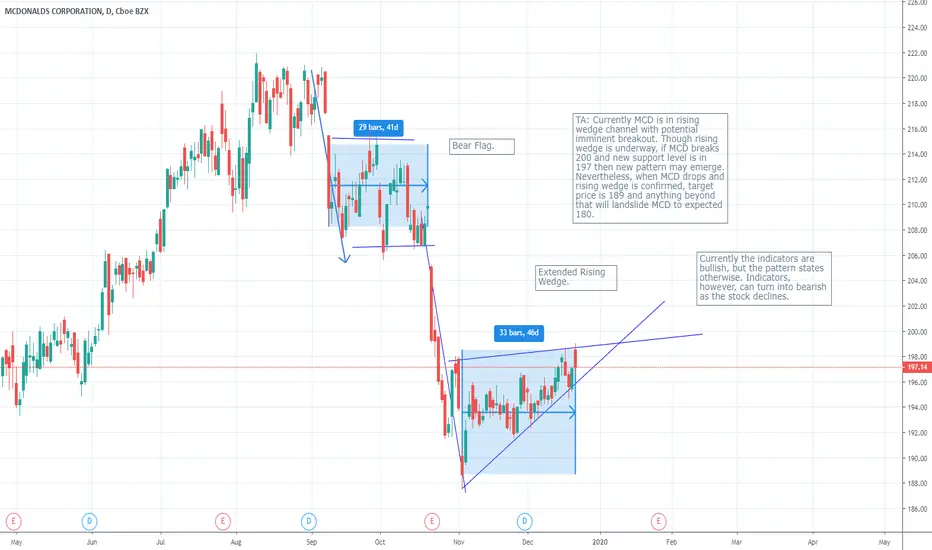
Rising wedge extendedYup my contract is worthless but im going all the way. Whatevers. No risk no reward.

$MCD short for bounce off the top of bearish channelNYSE:MCD - Short $MCD for quick bounce off top bearish channel, good risk reward, target $191-ish support


Mmm Chicken Mc Griddlesbuying this because of the Chicken Mc Griddles... The true chicken sandwich victor..
Nice Dividend too.
