MCDD trade ideas

BUY SETUPWe have classic bearish 5 waves pattern with an ending diagonal trangle in wave 5.
An ending diagonal is a special type of pattern that occurs at times when the preceding move has gone too far too fast.
In all cases, they are found at the termination points of larger patterns, indicating exhaustion of the larger movement.


MCD: Wait for the new key earnings level to shortMCD is in quite bad shape, fundamentally speaking, and it's in a steady weekly downtrend. There's a currently active weekly signal, that aims for 99.10, in the long term, but it's also about to report earnings for Q3, so it'd be better to wait for the new Key Earnings Level to form, to enter the short side. Any rally here is a sell, due to the valuation and technicals in higher timeframes, so keep an eye on it.
One thing to keep in mind is that new weekly lows or highs could trigger short term rallies as shorts are squeezed, due to the RgMov readings in the daily and weekly charts, so it's a bit conflictive. If you do get short, you'll have to trail stops after CCI gets oversold on dips.
Thanks to @nyaqoob75 for pointing this stock out, it's not normally in my watchlist.
Good luck,
Ivan Labrie.


McDonalds entering buy zoneThe home of the big mac is entering levels that I believe would be a good place to initiate long positions. Say b/w 105-115.
I would stop out under 102.50
They also support a dividend yield of 3.27%
Link: www.google.com
Their dividend payout has been rising at a nice clip, so it seems pretty safe.
Link: www.nasdaq.com
As always, have a plan before you enter a trade. Write down, I am buying X because I believe Y.

MCD - Short at the break of 112MCD having problem in the China & Europe, Strath thinks it will break down to 95 shortly.
In the technical side MCD seems forming a head & shoulder formation
You can check our detailed analysis on MCD in the trading room/ Executive summary link here-
www.screencast.com
Time Span: 18:00"
Trade Status: Pending


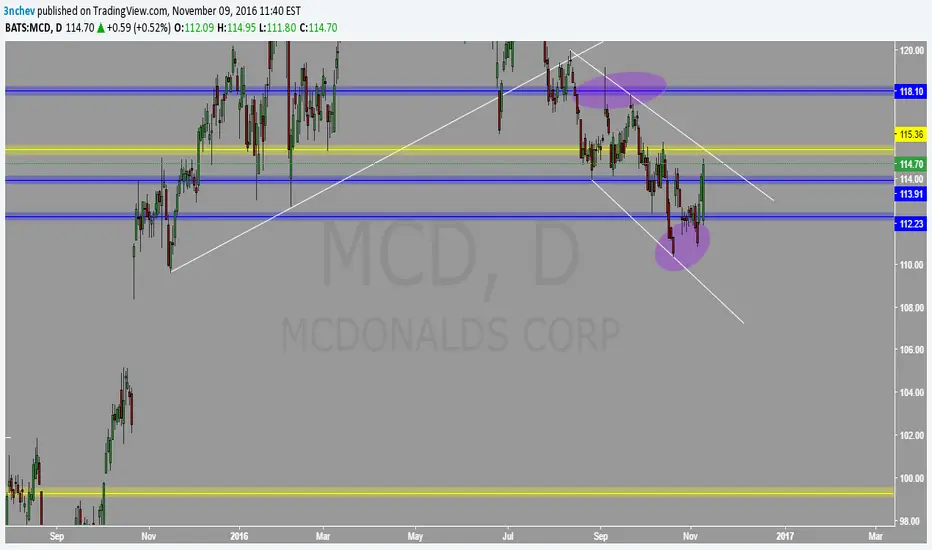
McDonald's Bullish Rest Of 2016On MCD 1 daily chart, a triple bottom pattern has developed at around $114.00 (support). If you look left, you see the ALL TIME HIGH of this stock at $131.96. I believe that MCD will do a Fib Ret to bullish side to $122.00, which is 50% level from last BEARISH trend, noted on chart. Will be looking for chart patterns at S/R area to trade BULLS.
Trade with trend, be patience and get on the BUS which is going in your direction of trade. Good Trading!!


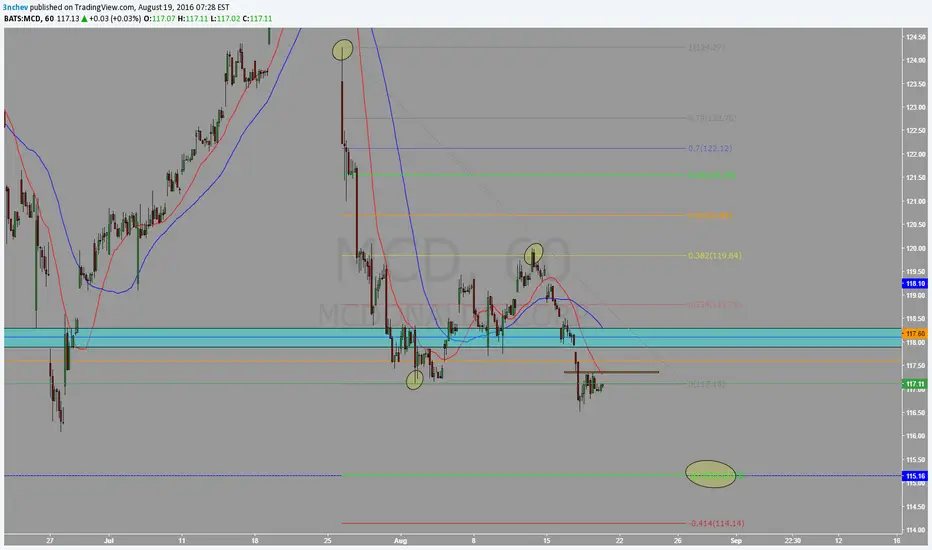
MCDONALDS - wave 3 is about to startThere's an opportunity to have a bullish impulse in wave 3 of (5).

McDonalds H&S confirmationWe have quite the H&S confirmation signal here with the weekly close below the weekly 50/60 ema aswell as the neckline. Obvious short play and should be an easy 3.3%
Stop is protected behind daily 200/250 ema + fib retrace. If price pulls back into the week for a retest of daily resistance I may add to the position.


Sales volume as Bullish divergence???What should you expect ???
Head and shoulders bearish with pull back on neck_line and resumption of downward up to 50% Fibo = Pivot Point ......
or bounce on static support (demand areas) to 114 $ and resumption of uptrend with 1st target at least 119 $, and if you continue on his run-up, you could be up to 124 $ and then, why not, to 128 ( right shoulder )....................

MCDONALDS ANALYSISMCDONALDS ANALYSIS
It seems we are mid way through a wave 3 on the minuette period ???

MCD - Trade updatePrices broke below the ascending neckline which initiated a short trade.
Still remain short with a target of 105.

$MCD help with fibonacci theory.I am just now learning how to use the Fibonacci theory and need some help.
I am very interested in buying MCD and am trying to find a good entry point.
I have heard somewhere that reversal usually happens when the 127.2% mark is crossed on the way down. Can someone confirm that this is accurate or correct me if I am wrong.
Thanks!

$MCD ascending broadening wedge on daily$MCD ascending broadening wedge on daily w/ gap open below. Expecting move to fill gap to 105s.
