MELI - could be ripe for breakup soonThere are several factors that are aligning in MELI's favour for sustainable recovery in the near future (minor pullbacks not withstanding):
1. Since hitting the low in June2022, it began to whip saw sideways within an ascending triangle pattern. This is a possible reversal pattern when formed after a downtrend.
2. A golden cross on 22 Dec2022: another signal that the trend is possibly reversing up although the stock could still continue to whipsaw for several weeks (sometimes up to a couple of months) until the 200day moving average could flatten or start turning up.
3. Very strong volume in the last 2 days that propelled the stock to move 15.6% in just 2 days to retest the neckline of the ascending triangle.
Watching to see if a (valid) breakup will materialise in the near future (perhaps after the next minor pullback).
Disclaimer: Just my 2 cents and not a trade advice. I may or may not enter into this trade. Kindly do your own due diligence and trade according to your own risk tolerance and don't forget that money management is important! Take care and Good Luck!
MELI trade ideas

MercadoLibre Inc (Long)MercadoLibre Inc
Long
Entry at 1082.92
Take Profit 1 at 1179.50 (8.92% profit from entry)
Take Profit 2 at 1331.57 (22.96% profit from entry)
Stop loss at 1010.31

MELI Engulfing Green Bar Three Line Bearish886.75)MELI is like a hydrid between Shopify and Amazon on the South American markets
Fundarmentally its revenue compared to market cap is more favorable than either of those.
On the weekly chart, MELI double topped to its historical high in February 2021 and September 2021.
It then descended to a pivot bottom in July 22
The chart now shows a large green engulfing candle taking out most or all of the previous
5-15 candles or a so called " Big Ass Candle". This could represent the end of a consolidation period
and the beginning of the resumption of down-trending price action. Last August a similar
engulfing green weekly candle preceded a downtrend.
I have plotted the long-term anchored VWAP and also the 6-month volume profile.
I will take a short swin trade if price drops below the POC line of the volume profile. ( 886.75)
If however, price approaches or crosses the VWAP ( 1060) I will take a long trade.
Given the stock price a 6 month expiration call or put option may be the best trade
method allowing for the taking of multiple contracts and then scaling out type trade
management stratery.

MELI NASDAQFor Mercado Libre (MELI), do we continue with the bearish scenario?
We see a clear example of the Market Maker Sell Model (MMSM), if this is fulfilled, the Bullish Order Block of the 1-Month period, would be the ideal one to look for upward scenarios or at least think about bullish configurations.
Concept: The Inner Circle Trader (ICT).

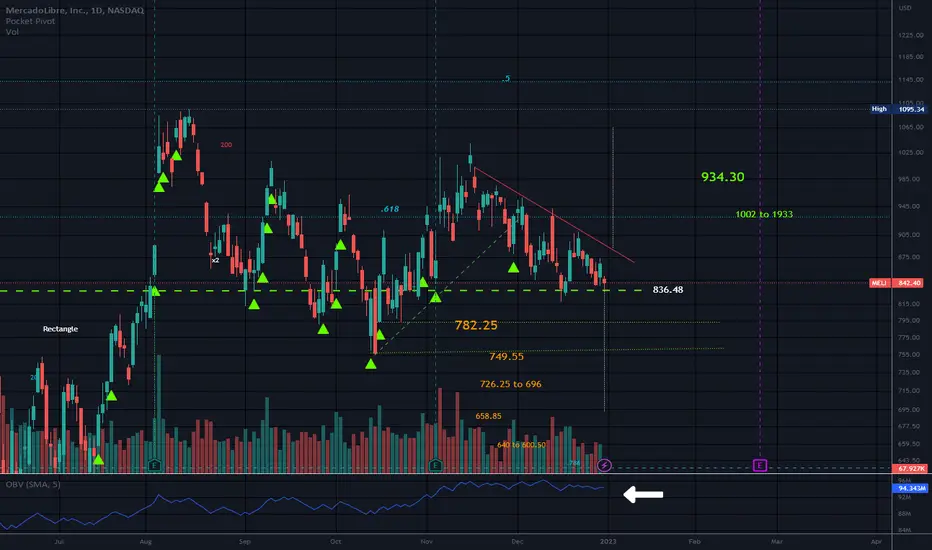
Descending TrianglePrice is close to the support line.
Price is below the .618 of the trend up and above the .786 since the COVID low/ATH 2020/ATL 7.91
It appears a bad day or 2 could break support levels as there are a few more not far below the 1st support level.
Price is sitting on top of an aging rectangle.
Prior gap up and support at bottom of this gap did not hold.
EPS (FWD)
8.97
PE (FWD)
96.53
Yield (TTM)
-
Short Interest
2.18%
Market Cap
$43.57B
No recommendation/ATH 2020/ATL 7.91/OBV remains high.
It is difficult for me to project targets to the upside as I use the point of break and the width of the wide end of the triangle to calculate targets. I can make a relatively close guess on where this may break down at.
Spinning top at support right now/indecision.
#MELI 2-2 reversal in monthly chartHello dear Traders,
Here is my idea for #MELI
Price closed below yellow line (previous month low)
Targets marked in the chart (green lines)
Invalidation level marked with red line
Good luck!
❤️Please feel free to ask any question in comments. I will try to answer all! Thank you.
Please, support my work with like, thank you!❤️


Meli Earnings day...Opening up below trend support today..
My target is 799$ or fib support.
If it closes below that we're headed to 700
Stop loss 855


$MELI with a Bullish outlook following its earnings #Stocks The PEAD projected a Bullish outlook for $MELI after a Positive Under reaction following its earnings release placing the stock in drift A with an expected accuracy of 60%.

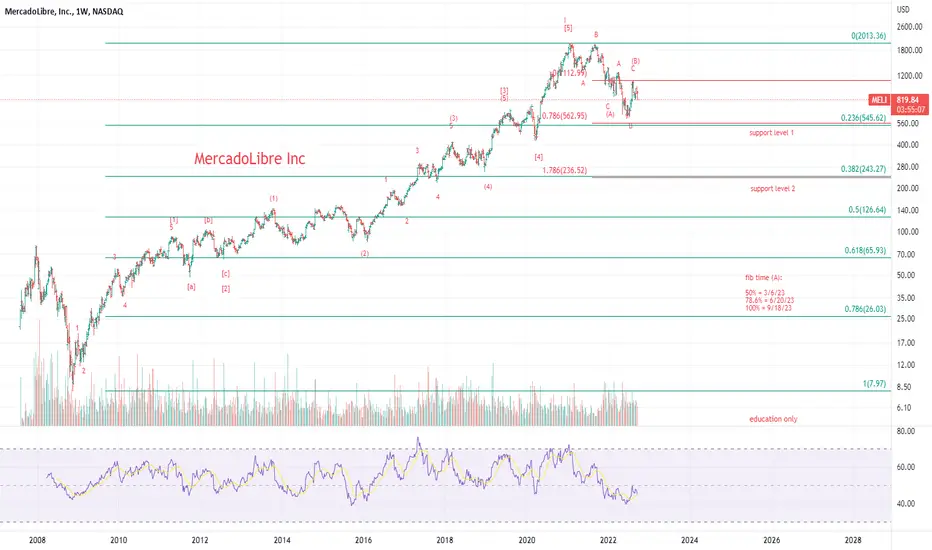
MELI monthly frame (562 & 236 support levels)possible hard intermediate C wave down toward 562 as support level 1 & 236 as support level 2
Earnings Beat/Price is Over the RectangleEarnings beat and I am not sure if the numbers were soft. I just see there was a positive reaction.
I have noticed that analysts are setting targets lower, sometimes much lower than last quarter. (NVDA was set to beat 1.52 last quarter. This quarter the number is .52)
So it appears they are lowering targets for some, but not all, to allow for a beat. But in reality, is the stock showing positive growth when they do this? Just something to think about I guess.
I was sitting back just knowing this was going back inside that rectangle. It did not.
The top trendline was resistance but now it is a strong source of support and price bounced off the top trendline..
There is a gap overhead and quite a few red candles. Selling may have exhausted for now.
A spinning top and a Doji/indecision candles/ can be a sign of further upside when it is close to support and opposite if close to resistance. There were 2 in a row close to support.
A Doji and a Spinning top often mean nothing at all. But they do get my attention when they appear in a sensitive place in a chart.
No recommendation.
I just read a great post about doing nothing is sometimes best. I am glad I "sat on my hands". Sometimes I post charts when I am doing nothing in the market so sorry if I am on overload. lol
EPS (FWD)
7.59
PE (FWD)
115.73
Short Interest
2.22%
Market Cap
$44.65B


$MELI $ SUPPORT / BRAKOUTwe will confirm that the price will continue to go down if we didn't break the current resistant around the 850$, and going towards the next support above the 440$.
if we broke the 850$ resistant, and held above it 4h candle , that will confirm the first sign of bullish momentum and going to the next resistant around the 1275$ level .


MELI - Double TopA double top has led price down a bearish road
I have plotted a Fibonacci trend and .236 shows promise for a recovery due to the large support cluster that can be seen around this area
This will continue the uptrend on a higher timeframes


MELI Base Failure Reset + VCPText book model of a 11.5 week flat base + base failure reset(constructive shakeout) + VCP with 3Contractions and massive volume dry up before the breakout and massive volume on the breakout.

$MELI with a Bullish outlook following its earnings #Stocks The PEAD projected a Bullish outlook for $MELI after a Positive over reaction following its earnings release placing the stock in drift B with an expected accuracy of 66.67%.

Technical analisys of Mercado Libre (MELI) NASDAQ junio 2022The South American giant of e-commerce and Argentine Fintech Mercado Libre, is still looking for a floor to return to its historical highs.
· In mid-March 2020, this upward trend began, accompanied by a GAP of almost 20%. After results were presented; which were not as expected, but there was a large increase in year-on-year sales.
· This boost would reach $2,020 on January 21, 2021, marking its all-time high.
· Six months later, it would mark its second most decreasing all-time high of $1,970.13 on September 2, 2021, thus generating a double ceiling.
· After its second historical high, a bearish medium-term trend began which would reach $ 877.69 on March 14, 2022, generating a PULLBACK which would bounce to $ 1,275.82 and thus continue to fall to its minimum of 600.68 on June 14, 2022.
· Closed the GAP of May 5, 2020, MELI is expected to break this downward trend since it is at pre-pandemic values with a lot of margin to start rising
· Pending encouraging results and data from the US recession, the LATAM giant is expected to wake up to return to its all-time highs with a PRICE TARGETS of $1,550. From now on thank you very much and I would appreciate comments since it is my first analysis....
El gigante de Sudamérica de e- commerce y Fintech argentino Mercado Libre, sigue buscando un piso para volver a sus máximos históricos.
• A mediados de marzo del 2020 comenzaba esta tendencia alcista, acompañada de un GAP del casi 20%. Luego de que se presentaran resultados; los cuales no fueron los esperados, pero si hubo un gran incremento en las ventas interanuales.
• Este impulso llegaría hasta los 2.020 dólares el día 21 de enero del 2021, marcando así su máximo histórico.
• Seis meses más adelante, marcaria su segundo máximo histórico más decreciente de 1.970,13 dólares el día 2 de septiembre del 2021, generando así un doble techo.
• Luego de su segundo máximo histórico, se dio comienzo a una tendencia de bajista de medio plazo, la cual llegaría a los 877,69 dólares el día 14 de marzo de 2022, generando un PULLBACK el cual rebotaría hasta los 1.275,82 dólares y así continuar bajando hasta su mínimo de 600.68 el día 14 de junio del 2022.
• Cerrado el GAP del 5 de mayo del 2020, se espera que MELI rompa esta tendencia bajista para romper al alza, ya que se encuentra a valores pre pandémicos con mucho margen para empezar a subir
• A la espera de resultados y datos alentadores de la recesión de USA, se espera que el gigante de LATAM despierte para volver a sus máximos históricos con un PRICE TARGETS de 1.550 dólares.
Desde ya muchas gracias y agradecería comentarios dado que
es mi primer análisis.... NASDAQ:MELI

MecardoLibre - when does it end?!MecardoLibre
Medium Term
We look to Sell at 692.89 (stop at 756.88)
Preferred trade is to sell into rallies. The medium term bias remains bearish. A Fibonacci confluence area is located at 438.30. Previous support located at 430.00. There is scope for mild buying at the open but gains should be limited.
Our profit targets will be 444.73 and 372.00
Resistance: 690.00 / 830.00 / 1265.00
Support: 500.00 / 430.00 / 285.00
Disclaimer – Saxo Bank Group. Please be reminded – you alone are responsible for your trading – both gains and losses. There is a very high degree of risk involved in trading. The technical analysis, like any and all indicators, strategies, columns, articles and other features accessible on/though this site (including those from Signal Centre) are for informational purposes only and should not be construed as investment advice by you. Such technical analysis are believed to be obtained from sources believed to be reliable, but not warrant their respective completeness or accuracy, or warrant any results from the use of the information. Your use of the technical analysis, as would also your use of any and all mentioned indicators, strategies, columns, articles and all other features, is entirely at your own risk and it is your sole responsibility to evaluate the accuracy, completeness and usefulness (including suitability) of the information. You should assess the risk of any trade with your financial adviser and make your own independent decision(s) regarding any tradable products which may be the subject matter of the technical analysis or any of the said indicators, strategies, columns, articles and all other features.
Please also be reminded that if despite the above, any of the said technical analysis (or any of the said indicators, strategies, columns, articles and other features accessible on/through this site) is found to be advisory or a recommendation; and not merely informational in nature, the same is in any event provided with the intention of being for general circulation and availability only. As such it is not intended to and does not form part of any offer or recommendation directed at you specifically, or have any regard to the investment objectives, financial situation or needs of yourself or any other specific person. Before committing to a trade or investment therefore, please seek advice from a financial or other professional adviser regarding the suitability of the product for you and (where available) read the relevant product offer/description documents, including the risk disclosures. If you do not wish to seek such financial advice, please still exercise your mind and consider carefully whether the product is suitable for you because you alone remain responsible for your trading – both gains and losses.

$MELI with a Bullish outlook following its earnings #Stocks The PEAD projected a Bullish outlook for $MELI after a Positive over reaction following its earnings release placing the stock in drift B with an expected accuracy of 62.5%.

MELI: Short Setup at Resistance Level MELI - Short Term - We look to Sell at 1175 (stop at 1233)
Preferred trade is to sell into rallies. 20 1week EMA is at 1177. The bias is still for lower levels and we look for any gains to be limited. Previous resistance located at 1150. Further downside is expected and we prefer to set shorts in early trade.
Our profit targets will be 953 and 890
Resistance: 1150 / 1350 / 1450
Support: 1000 / 900 / 750
Disclaimer – Saxo Bank Group. Please be reminded – you alone are responsible for your trading – both gains and losses. There is a very high degree of risk involved in trading. The technical analysis, like any and all indicators, strategies, columns, articles and other features accessible on/though this site (including those from Signal Centre) are for informational purposes only and should not be construed as investment advice by you. Such technical analysis are believed to be obtained from sources believed to be reliable, but not warrant their respective completeness or accuracy, or warrant any results from the use of the information. Your use of the technical analysis, as would also your use of any and all mentioned indicators, strategies, columns, articles and all other features, is entirely at your own risk and it is your sole responsibility to evaluate the accuracy, completeness and usefulness (including suitability) of the information. You should assess the risk of any trade with your financial adviser and make your own independent decision(s) regarding any tradable products which may be the subject matter of the technical analysis or any of the said indicators, strategies, columns, articles and all other features.
Please also be reminded that if despite the above, any of the said technical analysis (or any of the said indicators, strategies, columns, articles and other features accessible on/through this site) is found to be advisory or a recommendation; and not merely informational in nature, the same is in any event provided with the intention of being for general circulation and availability only. As such it is not intended to and does not form part of any offer or recommendation directed at you specifically, or have any regard to the investment objectives, financial situation or needs of yourself or any other specific person. Before committing to a trade or investment therefore, please seek advice from a financial or other professional adviser regarding the suitability of the product for you and (where available) read the relevant product offer/description documents, including the risk disclosures. If you do not wish to seek such financial advice, please still exercise your mind and consider carefully whether the product is suitable for you because you alone remain responsible for your trading – both gains and losses.
