META Short TargetsAs in my previous posts I mentioned that AMEX:SPY , NASDAQ:QQQ and AMEX:IWM typically perform the worst in September. Tech stocks specifically have an average decline of 2.5% in September (as per 10 year average seasonality data on NASDAQ:QQQ ). A 25% drop is well below my $291 price target on NASDAQ:META , which has boasted a 110% YTD + return. I think it is due for a slight pull back in the month of September, especially as we enter a volatile period with FED decisions.
I have short targets on NASDAQ:META at $291 area (as per my chart).
META trade ideas

Meta Platforms (META) -> Mega MegaphoneMy name is Philip, I am a German swing-trader with 4+ years of trading experience and I only trade stocks , crypto , options and indices 🖥️
I only focus on the higher timeframes because this allows me to massively capitalize on the major market swings and cycles without getting caught up in the short term noise.
This is how you build real long term wealth!
In today's anaylsis I want to take a look at the bigger picture on Meta.
You can see that since the beginning of 2017 Meta stock - also known as Facebook - has been trading in a quite nice and obvious reverse triangle or "megaphone" pattern.
Overall I do expect another retest of the upper resistance trendline roughly at $600 but we could certainly see some correction before the next impulse higher.
- - - - - - - - - - - - - - - - - - - -
I know that this is a quite simple trading approach but over the past 4 years I've realized that simplicity and consistency are much more important than any trading strategy.
Keep the long term vision🫡

BIG BANG in the MetaVerseFirst of all, if you just follow the solid black and dashed black trajectories you'll do fine. The solid black is general downside target, the dashed black is an attempt to map out potential path to target in waves.
Goal target is 153 by March 2024 . Target range = 140-170 by May 2024 latest, but as early as Jan 2024.
Initial target is 201 by end of 2023, likely around next earnings in November. Initial target range is 200-230 by as early as end of September 2023.
Levels to breakdown in order for this to play out:
306 - most important level, this is the breakdown level .. with a bounce at 306, Zuck could see one more leg up to 336
278-295 - this is where I'm expecting waves 1 and 2, resp. on the leg down toward target
257
Get ready for some explosive selling due to the nature of this chart setup. We are at the top of the B-wave and beginning a C wave that could even extend to a new low or a double bottom.
To invalidate this, META would need to reach 391, that is pretty far above current price, so stop loss is sustained break above 336.

Nice shortThe price was rejected from the resistance zone. It can try another push towards the downtrend line. I opened a small position (small position because big techs love to come back very strong), SL above 300, TP 250 approx. If it plays out it should fall very fast. Take 80% of the profit at 260, you never know with this high cap stocks.

Meta’s Tight ConsolidationMeta Platforms pulled back along with other growth stocks in August. But now some traders may look for its uptrend to continue.
The first pattern on today’s chart is the 50-day simple moving average (SMA). The recent dip was META’s first pullback to this line all year.
Next is the series of higher lows since August 25. Prices have simultaneously pushed against the $299 area where they got rejected on August 24. That combination of higher lows and upside resistance could be viewed as an ascending triangle -- a potentially bullish continuation pattern.
Third, Bollinger Bandwidth has contracted to its tightest range since late May. Does that open the door to potential price expansion?
Finally, MACD recently turned upward.
TradeStation has, for decades, advanced the trading industry, providing access to stocks, options, futures and cryptocurrencies. See our Overview for more.
Important Information
TradeStation Securities, Inc., TradeStation Crypto, Inc., and TradeStation Technologies, Inc. are each wholly owned subsidiaries of TradeStation Group, Inc., all operating, and providing products and services, under the TradeStation brand and trademark. TradeStation Crypto, Inc. offers to self-directed investors and traders cryptocurrency brokerage services. It is neither licensed with the SEC or the CFTC nor is it a Member of NFA. When applying for, or purchasing, accounts, subscriptions, products, and services, it is important that you know which company you will be dealing with. Please click here for further important information explaining what this means.
This content is for informational and educational purposes only. This is not a recommendation regarding any investment or investment strategy. Any opinions expressed herein are those of the author and do not represent the views or opinions of TradeStation or any of its affiliates.
Investing involves risks. Past performance, whether actual or indicated by historical tests of strategies, is no guarantee of future performance or success. There is a possibility that you may sustain a loss equal to or greater than your entire investment regardless of which asset class you trade (equities, options, futures, or digital assets); therefore, you should not invest or risk money that you cannot afford to lose. Before trading any asset class, first read the relevant risk disclosure statements on the Important Documents page, found here: www.tradestation.com .

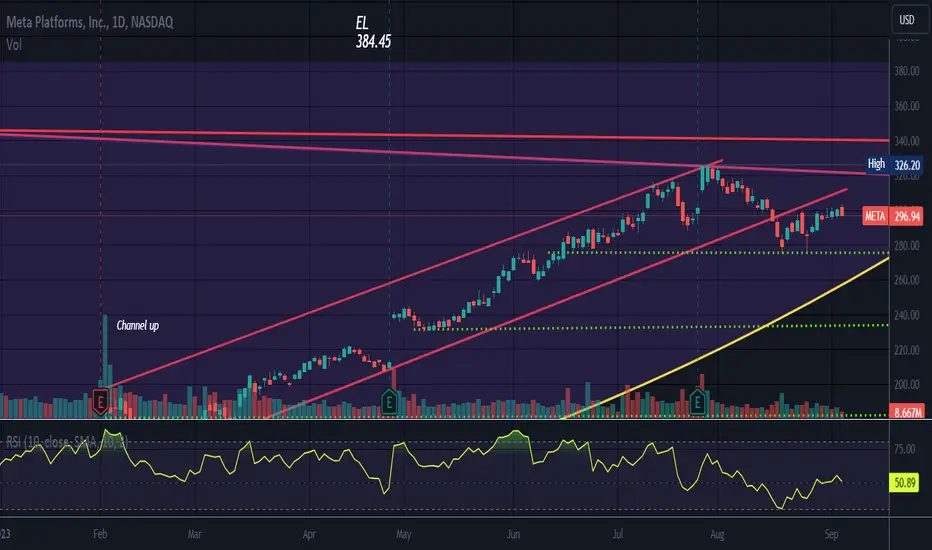
Resistance OverheadPrice was in a channel up and price fell below the channel's bottom line.
That bottom line is now resistance.
No rising wedges noted.
Price is cupping but is not close to EL of 384.45.
Price travels in a channel until it breaks the top or bottom line,
No recommendation.
Meta: On a detour ➡️Meta’s price is moving as if it had already completed the correction. In our expectation, however, it is only a slight detour, a substructure of the green wave (2). For the low of the green wave (2), there is still some way to go on the downside. We expect a move down to the green target zone between $209.15 and $140.02

A brief Analysis of meta Facebook stockLooking at the stock post Earnings date, what things become Immediately clear? do you See an Uptrend? Is momentum Gaining or declining? How is the Company's approach to AI working? Are there any observations that you can make by looking at this chart?

Does META have further upside ?
META is slightly above the 8EMA ($294.11) on Daily and weekly basis but below the 10WMA ($298.36) .If Price clears and stays above $299 the stock will head to max resistance target of $309-$316.
Likely Targets above $316 are $317,$321,$343,$352 and $382
On Monthly basis the stock is moving parabolic for last 8 months and suggests limited upside until price closes above $316.
On the downside if the price closes below $290 , Likely Target is $272.
Overall indecisive until price clears $299 or $290.
Note September is volatile month so caution is warranted with sizing and stop loss.

Meta's stocks are now in high triangle consolidation Meta's stocks are now in high triangle consolidation
This figure shows the weekly candle chart of Meta Company's stocks over the past two years. The top to bottom golden section at the end of 2021 is superimposed in the figure. As shown in the figure, since the end of October 2022, Meta Company's stock has shown almost no significant pullback or surge. Recently, it has been suppressed by the 0.618 position of the top to bottom golden section in the figure, and has now closed for three consecutive weeks below the 1.000 position of the top to bottom golden section in the figure! And Meta's stocks are now in the early stages of relatively high triangle consolidation! So, for a period of time in the future, just use the top to bottom golden section's 0.618 to 1.382 positions in the chart as the long short split range operation. Sell high and buy low within the range, and chase up or down outside the range!

MetaDouble bottom here.. Made the handle today with the pullback on low volume.. the next
Long over 298, 1st target 310.
If it can break over that 322 gap close..
Long only over 298.50 , stop loss 295
My Fib levels are from ATH an 20$ IPO low so 297 or .236 is tough

Cup & Handle/Weekly Price is Not to long entry level.
This is a weekly chart as the cup is easier to see. It is a large cup.
Resistance overhead.
Cup targets are calculated using the depth of the cup.
No recommendation.

META: Make or Break at TrendlineIf META can continue the upside movement and close above 301.76 in the next coming days that would break the downward trend and be bullish. However if META does not close above 301.76 in the 4hr chart, downward trend still in play and price target around 275

META stock going lowerMETA has recently broken below a well-defined ascending channel, signaling a significant shift in price dynamics. The breakdown indicates a weakening of the previously established bullish trend and the potential emergence of a bearish phase.
In addition, the completion of a head and shoulders pattern occurs when the price breaks below the neckline. In this case, the neckline has been breached, confirming the pattern's validity and providing additional credibility to the bearish outlook.

Straight up, straight down.Looking for deep value again. Fib retrace is all you can throw onto this chart, since its an illogical mess.

META First Buy signal in a month.We have been issuing strong buy signals on Meta Platforms (META) since November last year. A perfect example was our February 02 (see chart below) analysis that came with a huge final bullish warning while the price was still at $189.00:
Following the recent -15% pull-back, the strongest correction basically since the November 03 2022 market bottom, the stock price is flashing again the first buy signal on the medium-term as it is testing the 1D MA50 (blue trend-line) as a Resistance after a rebound near the 1D MA100 (green trend-line), which has been intact since January 10.
On top of that, the 1D MACD is on course to form the first Bullish Cross below 0.0, since November 09 2022, which was essentially the bottom of the Bear Cycle. As long as the 1D MA100 is intact, we will buy the 1D MA50 (candle) closing and target 326.25 (Resistance 1). If it closes a 1D candle below the 1D MA100 instead, we will wait and add a 2nd buy position at 260.00, near the Higher Lows trend-line and keep it as long as the 1D MA200. The target for that position will be even higher, as it will be a long-term buy signal, aiming at the All Time High of 384.50.
-------------------------------------------------------------------------------
** Please LIKE 👍, FOLLOW ✅, SHARE 🙌 and COMMENT ✍ if you enjoy this idea! Also share your ideas and charts in the comments section below! **
-------------------------------------------------------------------------------
💸💸💸💸💸💸
👇 👇 👇 👇 👇 👇

META SELLMETA sell trade, setting sights on 139.26. This is a long one – could take 6 to 18 months, looking at over 50% drop from its value. Time is my measure. Will keep tabs on it. #META"

META short running position REOPEN possibilityWe went short on META PLATFORMS (Facebook)
Our 1/4 r/r target has been reached
We can reopen now and hunt the lower demand zone.
If you haven't placed the first trade, maybe wait for another opportunity

$META -Dangeours Place to Buy(30mins) - A buyers must take note that NASDAQ:META is at a very high risk place to be purchased !
Not only has a strong down-trend taken place, but there is plenty of room to the downside.
(-20% negative draw-down from here if price hits the green support trendline)
Despite today's bounce at a key-level and breaking the first trendline resistance on red,
it is currently trading just below 297.85$ key level mark after bouncing at 276.8$.
Even Breaking 297.85$ KL,
resistance marked on red rectangle @293$ welcomes the price to be slapped by it from
Sellers.
TRADE SAFE
*** Note that this is not Financial Advice !
Please do your own research and consult your own Financial Advisor
before partaking on any Trading Activity based Solely on this Idea.

META NEWS Meta news
Facebook NASDAQ:META is preparing to launch software to help developers automatically generate programming code, a challenge to proprietary software from OpenAI, Google and others - The Information


META Platforms - $275 Nice Entry Point 0. Notes to follow;
1. After selloff in Meta, looking like an attractive entry point here.

META, 7d/-16.61%falling cycle -16.61% in 7 days.
==================================================================================
This data is analyzed by robots. Analyze historical trends based on The Adam Theory of Markets (20 moving averages/60 moving averages/120 moving averages/240 moving averages) and estimate the trend in the next 10 days. The white line is the robot's expected price, and the upper and lower horizontal line stop loss and stop profit prices have no financial basis. The results are for reference only.
