Magnificent 7 (former FANG, former FAANG, former FAANG+)Does anyone else wonder why financial media has rebranded the top stocks to the magnificent 7 and then portrayed their dominance as an anomaly instead of the primary trend?
A 10 year look at "tHe 7 StOcKs ThAt ArE LeAdInG ThE MaRkEt" vs the SPX-MAG7
METAD trade ideas

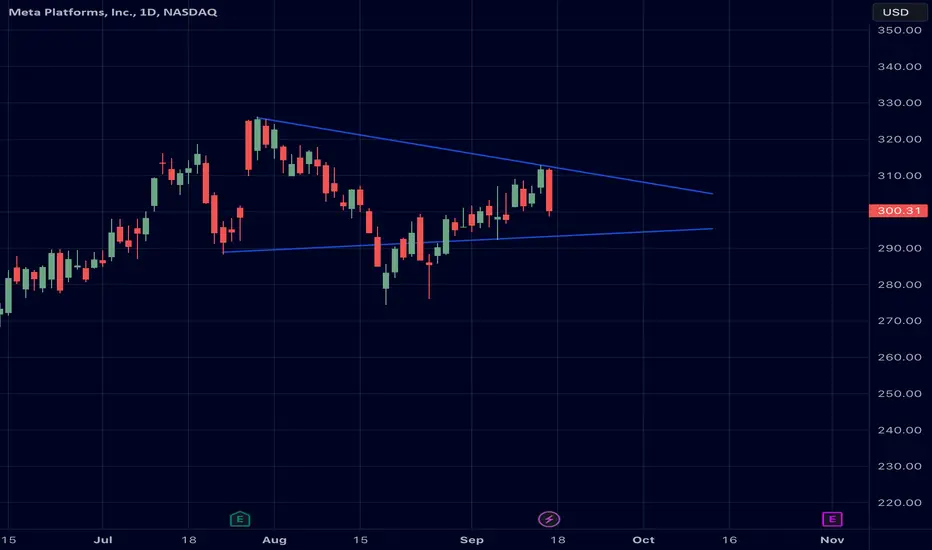
$META: May probe below 300META had a sharp break of 300 on Friday and may persistent here in the short term. Looking to see if bears can probe lower to see if any bulls will pick it up from lower. Good luck trader
Short METAMETA looks like a great short, after a 1-year solid rise in price, it is going sideways and could turn down as Tech is way overvalued now.

META Analysis: Price Target Raised to $390Last week, the Meta Connect event took place, where the following were presented:
→ new Ray-Ban Meta Smart Glasses with a camera and microphones, including for broadcasting on social networks. The price of the gadget is USD 299;
→ Meta Quest 3 virtual reality helmet priced at USD 499;
→ AI characters for social networks, as well as Meta AI chatbot.
Overall, the products were received favourably. And now analysts are making predictions about how this will affect the stock price. Thus, Truist Securities analyst Youssef Squali raised his target price to USD 390 per META share, expecting that:
→ revenue will increase by 21% year on year;
→ the company will receive many benefits through the implementation of AI (for example, Emu — an image generation model; Studio AI — a platform for developers that allows one to create new and customized AI).
Add to this that the increase in revenue should be facilitated by the company’s intention to offer a subscription fee of USD 14 per month for using Instagram and Facebook, which will allow one to disable advertising.
The daily chart of META stock, meanwhile, shows a mixed picture.
Bullish arguments:
→ META stock is stronger than the S&P 500 market;
→ the price forms a movement within the ascending channel;
→ the price formed quick energetic rebounds from the lower border of the channel, thereby indicating the strength of demand.
Bearish arguments:
→ On July 27, when the high of the year was formed, extremely high volumes were recorded on the NASDAQ exchange. They can be interpreted as the desire of large players to fix profits from long positions. Since then, the July 27 candle area has acted as resistance. Price action near the USD 310 level (roughly the low of the July 27 candlestick) confirms bearish activity.
It is possible that in the coming weeks, the forces of supply and demand will balance out in the market, however, if the fundamental backdrop for META stock remains strong, it will help the bulls prove their superiority in the long term.
This article represents the opinion of the Companies operating under the FXOpen brand only. It is not to be construed as an offer, solicitation, or recommendation with respect to products and services provided by the Companies operating under the FXOpen brand, nor is it to be considered financial advice.

meta - breakout of descending trendline ✔️ breakout descending trendline
✔️ move above 30 days EMA
✔️ retest trendline
✔️ capitulation volume


META, BEARISH MARKET-View, Enormous SHORT-Side-Indications!Hello There!
Welcome to my newest idea about META on the major underlying dynamics that I have spotted in the chart, conditions, and dashboard recently. META has turned out to be one of the most bearish dumpers in the market with a massive bearish pressure momentum wave of over -76.00% to the downside liquidating over 800 positions in the market and elevating a gigantic bearish indication for the whole chart.
The recent trend is looking rather weak because of the massively declining volume which is not supporting this weak uptrend. This means that when a bearish wave to the downside shows up this wave is going to accelerate because the volume of this undercurrent weak uptrend is declining more and more. Especially, with a major supply structure staying between the 290 and 360 levels this is going to have the same bearish origin condition as it has been seen within the massive bearish pressure -76.00% dump.
Investors are losing more and more trust in the stock since huge allegations over several years are not decreasing and it seems that investors are decreasing their stakes and position sizes within the stock. This is underlined by the fact that the volume is decreasing within this weak trend and is not supported by investors because if this should be the case the volume would rise. Taking this into perspective here the underlying increasing attractiveness of the stock is increasing the bearish case and decreasing the bullish case almost completely.
As META is now approaching the upper resistance cluster zones with resistances marked by the upper distribution level together with the supply zone levels that already have been the origin of 800 Billion long liquidations in the past such a breakdown to the downside increases further the more often the META price-action penetrates the lower boundary of the crucial ascending-wedge the higher the possibility for a massive bearish breakout and continuation increases.
Once a breakout below the lower boundary of this gigantic ascending wedge formation has shown up similar to it already formed in the past before META dumped over -76.00% in a massive bearish pressure continuation this is likely to increase the possibility for further bearish momentum to accelerate and META is going to continue with this till support has been reached or till the bearish momentum is so severe that it is going to breakout below the lower boundary and just continues into the direction.
Therefore, it will be necessary to spot the actual wave-development to emerge within the next times and exactly because of this I am continuing to keep the stock in my dashboard watchlist and re-evaluate important changes as well as the major underlying factors once they emerged within the price-action.
In this manner, thank you everybody for watching my analysis about USDJPY. Support from your side is greatly appreciated.
VP

MetaCorrecting outside a rising wedge ..
Possible bear channel formed
Next stop 290.
Stop loss over 306 stop

[S-014] MetaTrading idea number S-014 | Meta stock could raise to $336 area.
The setup is positive. The RSI is above the neutrality area at 50. The MACD is above its signal line and positive. In addition, the stock is trading above its 20-day and 50-day moving averages. On the pivot point at 298.14 we find very in-bearing support near the psychological area over which we expect a bounce.
📈 Long Entry at 307.56
💰 Take Profit at 336
💸 Stop Loss at 291

META SHORT (PATTERN ACTIVE)META Rising wedge breakdown with retest and confirmation.
Strong SHORT under 300 to target 293.63, 289.08, 285.66, 284.09.

$META 285 PT? POP N DROP?Yesterday we had an incredible day trading NASDAQ:META with a 200% play up and 950% play down. Not your usual options trading day, but a calculated trade in both directions. Yesterdays pop drop and pop created alot of tension in an area already pent up. I do think we have a high probability of downside, but I am ready to take it long if triggers break.

META is under pressure. Expect one last dip.META is trading around the MA50 (1d) since the Sep 14th Lower High and seems to be acting as a Resistance.
The long term trend is heavily bullish on a Rising Support and best depicted by the application of the Fibonacci Channel.
However a Channel Down is emerging and as long as the Lower High holds, we expect one final dip to gather new long term buyers.
Trading Plan:
1. Sell if the MA100 (1d) breaks.
2. Buy at 265 (Rising Support).
Targets:
1. 265 (Rising Support).
2. 385.50 (All Time High, under the 1.5 Fibonacci extension).
Tips:
1. The most ideal sell target and obviously buy entry will be preferably if the RSI (1d) hits the 30.00 oversold level.
Please like, follow and comment!!
Notes:
Past trading plan:

Resistance Overhead/ChannelsPrice has fallen from a lengthy channel up, formed another small channel up and is fighting the resistance of the bottom line of the 2nd small channel. This line was support but is now resistance.
There are 2 gaps below price.
There is a cup but whether price makes to the top of the cup then breaks the resistance that lurks there, remains to be seen.
No recommendation.
Success is going from failure to failure without losing enthusiasm (o:

META: Sell ideaSell idea on META as you see on the chart because we have the breakout with force the support line and the vwap indicator.Thanks.

META, Decisive Wedge Into DISTRIBUTION-CHANNEL!Hello There!
Welcome to my new analysis about META on the weekly timeframe perspective. Since the massive dump which emerged in September 2021 that lasted almost over one year and which caused META to drop over 75% META has formed an gradual uptrend as it bounced within the lower accumulation-zone as marked in my chart. Nevertheless this uptrend is not very strong right now and what should not be underestimated here is this huge descending-channel-formation in which META has a main resistance-level within the upper distribution-channel marked in red. Within this whole channel-development META is building this massive coherent wave-count with the first wave A already completed and now the second wave B developing in a wedge-shape, more precisely a ascending-wedge-formation. Such an ascending-wedge-formation is likely to reverse the whole trend which will in this case be the beginning of the enlarged wave C of the whole wave-count and matching with the upper distribution-channel the possibility is high that META moves on with such a determination. The completion of the ascending-wedge will lead to META pointing to the lower target-zones, especially the all-time-low region as it is seen in my chart, with further supply entering the market this is a likely scenario. If META reaches an oversold condition once it approached the all-time-low region this can be a place for a reversal to show up however it has to be elevated how the signs will set-up with this scenario.
Thank you everybody for watching. It will be great when you support my idea and we move on forward together.
"There are many roads to prosperity, but one must be taken."
VP

Meta WeeklyMeta Platforms, Inc., more simply known as Meta, is a U.S. company that controls Facebook and Instagram social networking services, WhatsApp and Messenger instant messaging services, and develops Oculus Rift virtual reality viewers, founded in 2004 by Mark Zuckerberg, Eduardo Saverin, Andrew McCollum, Dustin Moskovitz, and Chris Hughes under the name of Facebook, Inc.. The company took on its current name as of October 28, 2021. Meta also owns the Mapillary service, purchased in June 2020 by the Swedish company of the same name, and holds a 9.99% stake in the Indian telephone company Jio Platforms


META 20 % dump may happenHi traders
We've seen a beautiful recovery on META since lows reached in November 2022. However, the upsloping support which was respected through the whole recover phase, has failed in August 2023 and now it seems that the price has created the first lower high after reaching 0.786 fib level.
This is not a good sign for bulls and taking into an account that SPX and NASDAQ looks bearish now, we expect META to drop about 20 % in the next weeks and months.
target for shorts: 240 -255 $ ( 0.5 fib level )
If the price breaks above 325 $, we may be looking for a bullish continuation but right now, we are bearish on META.
What do you think ? Share your opinion in the comment section

📈💰3 Ways To Buy A Stock🔍Facebook is going into AI
and this may be the reason why
the price seems
to be going up in value
---
As i was looking for a good stock to recommend to you
i clicked on the ''fire'' icon
on trading view
---
So as i clicked on all
the stock tickers
i was looking for the following 3 things:
----
#1- Price has to be above the 50 EMA
#2- Price has to be above the 200 EMA
#3- The 50 EMA has to cross above the 200 EMA
---
These 3 things have to happen
to show an uptrend
--
Thank you to trading view
for this wonderful software
that helps me find these
--
Stocks to share with you
--
Disclaimer:
--
Be careful trading stocks
is risky you
--
need to study and do
your own research
--
Do not buy or sell what you
read from this article
or any other article
--
without the will to lose
money from trading
--
or at least years of experience
this is not financial advice
---
Remember to rocket boost this
content to learn more

META Entry, Volume, Target, StopEntry: with price above 326.20
Volume: with volume greater than 39.22M
Target: 370.74 area (this is an area, no guarantee it reaches this price, but you should be selling on the way up)
Stop: Depending on your risk tolerance; Based on an entry of 326.21, 304.00 gets you 2/1 Reward to Risk Ratio.
This LONG swing trade idea is not trade advice and is strictly based on my ideas and technical analysis. No due diligence or fundamental analysis was performed while evaluating this trade idea. Do not take this trade based on my idea, do not follow anyone blindly, do your own analysis and due diligence. I am not a professional trader.

UPDATE META continues to go up the C&H with target $355.12Reverse Cup and Handle formed on META as previously analysed.
We then had a retracement with a Falling Wedge where there was profit taking.
The Support has held and is showing further upside to come. We just need a strong catalyst to boost it up.
7>21
Price >200
RSI>50
Target remains at $355.12

META: Buy ideaBuy idea on META as you see on the chart after the breakout with force the vwap indicator by a big green candle with alarge green voolume.Thanks.

META Ready to Get HammeredMonthly chart on META
META has been on a bull run for a year. Take a look at the Heikin Ashi green candles in the uptrend. Not one red candle.
META is now showing first signs of weakness. In last two months, candles formed lower highs.
A huge AB=CD pattern is nearly complete.
META to make one run up to 360 before going down to 280 and then to 200 levels.
