Microsoft's AI-Powered Surge: A Deep Dive into Q4 Performance
In a groundbreaking financial report, Microsoft Corporation (NASDAQ: NASDAQ:MSFT ) has unveiled a staggering 33% increase in profit for the October-December quarter, driven by substantial investments in artificial intelligence (AI) technology. The tech giant's remarkable success is primarily attributed to the robust growth in its cloud-computing unit, where Microsoft has strategically focused its AI initiatives.
AI Dominance and Cloud-Centric Growth:
Microsoft's (NASDAQ: NASDAQ:MSFT ) net income for the quarter reached an impressive $21.87 billion, or $2.93 per diluted share, surpassing Wall Street expectations of $2.79 per share. The Redmond, Washington-based company reported a significant surge in revenue, totaling $62.02 billion, marking an 18% increase from the previous year's $52.75 billion. This stellar performance is a testament to Microsoft's prowess in the AI race, as it solidifies its position as a frontrunner in the rapidly evolving technology landscape.
Jeremy Goldman, Director of Briefings at Insider Intelligence, noted, "Microsoft is firmly establishing itself as a frontrunner in the AI race." The company's AI investments not only contributed to its impressive financial results but also opened doors to potential expansion in the digital advertising sector. Analysts predict a 12% growth in Microsoft's worldwide ad revenues to $14.93 billion this year, positioning the company as a formidable competitor, although Google is anticipated to expand its larger ad business by 10% in the same period.
Integration of Activision Blizzard:
Microsoft's (NASDAQ: NASDAQ:MSFT ) recent acquisition of video-game maker Activision Blizzard, completed on October 13 for a whopping $69 billion, played a pivotal role in the company's Q4 performance. James Ambrose, the company's Director of Investor Relations, revealed that the merger boosted revenue growth by four points. However, operating profits saw a reduction of approximately $440 million due to purchase accounting adjustments and integration and transaction costs.
Despite the substantial impact of the acquisition, Microsoft's cloud-focused business segment outshone its other divisions, witnessing a remarkable 20% revenue growth to $25.88 billion for the quarter. The Office suite, coupled with the LinkedIn professional social network, exhibited a 13% revenue growth, reaching $19.25 billion. The Windows-led personal computing business, inclusive of Xbox video games and services, experienced a robust 19% growth, reaching $16.89 billion.
Investor Concerns and Market Response:
Despite the impressive figures, Microsoft's (NASDAQ: NASDAQ:MSFT ) shares initially faced a dip in after-hours trading, falling nearly 2% to $400.86. Analysts attribute this to investor concerns regarding the company's continued aggressive investment plans. However, the shares later recovered much of the loss, showcasing a resilient market sentiment towards Microsoft's (NASDAQ: NASDAQ:MSFT ) long-term strategy.
Conclusion:
Microsoft's (NASDAQ: NASDAQ:MSFT ) exceptional Q4 performance, fueled by AI and cloud-computing investments, positions the company at the forefront of technological innovation. As the tech giant continues to navigate the ever-evolving landscape, its strategic focus on AI is not only bolstering financial success but also shaping the future of digital transformation. With the integration of Activision Blizzard and a relentless commitment to innovation, Microsoft's (NASDAQ: NASDAQ:MSFT ) trajectory suggests a promising and influential role in the global tech ecosystem.
MSFTC trade ideas

$MSFT Will not go much further from here... Kidding.. my fav..was looking at the 1.61 but ... seems like my fav is a tanking as usual... lets see where this ends.... rollover imminent .. I like CPI dump

Earnings Expectation for 1/30: $MSFT, $AMD, $GOOGLAs we approach a pivotal earnings release day on January 30th, all eyes are on three tech titans: Microsoft ( NASDAQ:MSFT ), AMD ( NASDAQ:AMD ), and Google's parent company, Alphabet Inc. ( NASDAQ:GOOGL ). This analysis delves into the current market sentiments, historical performance, and key factors that could influence the upcoming earnings reports for these companies.
Microsoft ( NASDAQ:MSFT ): With its diverse portfolio ranging from cloud computing to software, Microsoft has consistently demonstrated resilience in the face of market fluctuations. This quarter, investors will be keenly watching the growth metrics of Azure, its cloud division, alongside the performance of its productivity and business processes segment.
AMD ( NASDAQ:AMD ): As a powerhouse in the semiconductor industry, AMD's earnings are a bellwether for the broader tech sector. The focus will be on its revenue growth driven by the sales of CPUs and GPUs, especially considering the intense competition with Intel and Nvidia. Market participants will also be looking for updates on supply chain normalization and its impact on AMD's operations.
Alphabet Inc. ( NASDAQ:GOOGL ): Google's parent company enters this earnings season amidst a challenging advertising market and regulatory scrutiny. Key areas of interest include the performance of its advertising business, cloud services growth, and any strategic shifts in response to the evolving digital landscape.

When Will Microsoft Stop Winning?Hey guys!
A few weeks ago, we put out a bearish idea on Microsoft. NASDAQ:MSFT
As you may have guessed, it was relatively poorly timed. While the stock took a break from rallying, it only took a couple of weeks for shares to continue their march higher into earnings season:
In fact, the company reports earnings tomorrow, and we're expecting another beat & raise, which has been the trend over time as MSFT products gain momentum, Azure continues to crank out cash, and Bing & ChatGPT represent the next leg up for the company.
All in all, the stock seems destined to be in 'only-up' mode forever.
However, this has to stop at some point. The stock cannot continue this march into infinity, and the growth trajectory of the stock WILL slow down, which should send the multiple back to the 15s-20s which is where it has traded historically.
Is that time now?
Probably not.
In our view, Fair Value for MSFT shares is somewhere around $285-$350 per share, which is below the current price near 410, but the momentum is so strong that it's unlikely we'll see the projected Fair Value zone anytime soon.
That said, this is one to keep an eye on, as many of the multiples are beginning to look very stretched, and the company has stopped buying back shares as aggressively:
Stepping in front of this freight train on the short side seems like a poor decision, but we can't help but think that as MSFT continues to make new high after new high, with the stock getting further and further ahead of the company's growth, that this is a 'good price' to exit at.
If you own MSFT, you may want to consider cutting bait or trailing it more tightly into (and beyond) earnings tomorrow.
Hope this makes sense.
Stay safe out there!
Want more high-quality trade ideas? Follow us below. ⬇️⬇️

MICROSOFT How to trade as the Earnings approach?Microsoft (MSFT) is set to report the Earnings on Tuesday and last time we gave gave a pull-back buy signal (December 01 2023, see chart below) we caught the exact bottom:
Our original long-term Target was $460.00 but we have to downgrade it to $440.00. On the short-term it may be wise to take most or at least some of the profit if the 1D MA20 (red trend-line) as this has been a medium-term sell signal on July 26 2023. It's not just potentially lower than expected Earnings that may turn the trend bearish on the medium-term but also the Fed, which announce the Rate Decision on Wednesday.
As a result, if the price breaks below the 1D MA20, we will short and target the 1D MA100 (green trend-line) at $370.00 where we will add another long-term buy position. Notice that the 1D CCI indicator and the correlation with the 2023 price action, shows that both scenarios are equally likely at the moment.
-------------------------------------------------------------------------------
** Please LIKE 👍, FOLLOW ✅, SHARE 🙌 and COMMENT ✍ if you enjoy this idea! Also share your ideas and charts in the comments section below! This is best way to keep it relevant, support us, keep the content here free and allow the idea to reach as many people as possible. **
-------------------------------------------------------------------------------
💸💸💸💸💸💸
👇 👇 👇 👇 👇 👇

MSFT: Hidden Bullish Divergence, Upside Potential+7%? Hi Realistic Traders, let's delve into the technical analysis of NASDAQ:MSFT
Microsoft's current price action analysis (MSFT) reveals several significant indicators suggesting a favorable bullish trend. Firstly, the stock consistently trades above the Exponential Moving Average (EMA) 34 line, signaling a robust bullish trend. Additionally, a recent development in a symmetrical triangle formation has been observed, followed by a decisive breakout from this pattern.
Moreover, the momentum indicator has exhibited a hidden bullish divergence, reinforcing the positive outlook. This confluence of technical signals indicates a strong likelihood of Microsoft continuing its upward trajectory. In our analysis, we anticipate a potential pullback to the previous resistance zone before resuming its bullish trend, with the initial target in sight. Further, we identify a second target for potential gains, underlining the prospect of sustained positive momentum in MSFT's market performance.
It is essential to note that the analysis will no longer hold validity once the target/support area is reached.
Disclaimer:
"Please note that this analysis is solely for educational purposes and should not be considered a recommendation to take a long or short position on Microsoft."
Please support the channel by engaging with the content, using the rocket button, and sharing your opinions in the comments below!

Microsoft long term bullish!!!Microsoft looks strong in macro, and the sky's the limit in terms of price. RSI shows no weakness yet. If it's above 350, it's a good buy. Support needs to hold at 315.75. Ride the wave until there's a monthly higher low broken.

Microsoft's Meteoric Rise to $3 Trillion ValuationA Triumph of AI, but FTC Clouds the Horizon"
In a historic ascent to a $3 trillion valuation, Microsoft ( NASDAQ:MSFT ) has firmly established itself as a tech giant with a strategic focus on artificial intelligence (AI). However, this unprecedented success is now under the scrutiny of the Federal Trade Commission (FTC), as the regulatory body investigates the potential monopolization of the generative AI market by major players, including Microsoft, Amazon, and Google.
Microsoft's remarkable journey to this valuation milestone can be largely attributed to its visionary investments in AI. The company's commitment to advancing AI technologies was solidified in 2019 when it made a substantial $1 billion investment in OpenAI. Fast forward to January 2023, and Microsoft ( NASDAQ:MSFT ) deepened its partnership with OpenAI with a multi-year, multi-billion-dollar investment, elevating its total commitment to a staggering $13 billion and boosting OpenAI's valuation to approximately $29 billion.
A pivotal aspect of this collaboration is Microsoft's transformation of Azure into a global AI supercomputer. By becoming OpenAI's sole cloud provider, Azure underpins all aspects of OpenAI's operations, ranging from research and product development to API services. Satya Nadella, Microsoft's Chairman and CEO, highlighted the significance of this partnership, stating that it would provide developers and organizations with access to the best AI infrastructure, models, and toolchain to build and run applications.
The synergy between Microsoft's growth and its AI investments is undeniable, yet the company now faces potential obstacles in the form of an FTC probe. Led by FTC Chair Lina Khan, the investigation focuses on the AI investments of major tech players, exploring whether Microsoft ( NASDAQ:MSFT ), Amazon, and Google are monopolizing the generative AI market. This scrutiny aims to determine whether such dominance could stifle competition and innovation within the burgeoning field of AI.
The stakes are high for Microsoft ( NASDAQ:MSFT ), as the FTC's inquiry could pose significant challenges to its AI-driven growth trajectory. The company's integration of an AI chatbot into Bing last February, aimed at challenging industry competitors like Google, may come under closer scrutiny in light of the ongoing investigation.
As Microsoft ( NASDAQ:MSFT ) basks in the glory of being only the second company ever to achieve a $3 trillion valuation, the FTC probe casts a shadow over its triumph. The outcome of this investigation will not only shape the future of Microsoft but could also set precedents for how Big Tech engages with and invests in the dynamic landscape of artificial intelligence. In the evolving narrative of AI-driven success, the regulatory scrutiny underscores the delicate balance between innovation and the potential risks of monopolization in this transformative industry.

MSFTWe are facing cup with handle . Our target prices are shown in the chart as rectangles . Indicators seems good .

Morgan Stanley believes in Microsoft. Stock idea for 25/01/2024As reported by Reuters , Morgan Stanley has raised its target price for Microsoft Corporation shares from 415 USD to 450 USD. The bank is optimistic about the further strengthening of Microsoft's position in IT budgets, thanks to GenAI's robust portfolio. Morgan Stanley believes MSFT's continued growth potential is driven by the company's strategic alignment with critical long-term trends in the software industry.
So, today, we will examine the Microsoft Corporation (NASDAQ: MSFT) stock chart.
On the D1 timeframe, resistance at 398.67 was broken through, and support formed at 393.59. If quotes consolidate at the 398.67 level, the upward trend may continue.
On the H1 timeframe, a rebound from the 398.67 level could set a short-term target for a price increase at 420.00, while in the medium term, it could hover around 450.00.
—
Ideas and other content presented on this page should not be considered as guidance for trading or an investment advice. RoboMarkets bears no responsibility for trading results based on trading opinions described in these analytical reviews.
The material presented and the information contained herein is for information purposes only and in no way should be considered as the provision of investment advice for the purposes of Investment Firms Law L. 87(I)/2017 of the Republic of Cyprus or any other form of personal advice or recommendation, which relates to certain types of transactions with certain types of financial instruments.
Risk Warning: CFDs are complex instruments and come with a high risk of losing money rapidly due to leverage. 66.02% of retail investor accounts lose money when trading CFDs with this provider. You should consider whether you understand how CFDs work and whether you can afford to take the high risk of losing your money.

The man behind the curtainWhen you look behind the splits of Microsoft, it is much easier to see what is going on after the metoric gains of the dot-com bubble (A), Microsoft finally found their footing after the Great Recession (B) in an inverted expanded flat.
The most common C of the expanded flat 1.236-1.618. Elliot says the 2.618 could occur, but is rare.

MSFT Short: Hit 5th wave target of $400As can be seen on this chart, I have extended the fibonacci extension and this time the target is hit. Short.

Microsoft's Gaming TriumphNASDAQ:MSFT Stock Surges as Xbox Unveils Blockbuster Titles in 2024.
On January 20, 2024, Microsoft's stock ( NASDAQ:MSFT ) experienced a surge, capturing the attention of investors as the company's Xbox Developer Direct event unveiled a lineup of highly anticipated games set to revolutionize the gaming industry. The event not only showcased groundbreaking titles like Hellblade II and Indiana Jones and the Great Circle but also painted a promising picture for Microsoft's future in the gaming sector.
The Gaming Spectacle:
Microsoft's Xbox Developer Direct event was nothing short of a spectacle, with a particular emphasis on the upcoming releases that left gamers and investors alike buzzing with excitement. The unveiling of the official release date for Hellblade II, set for May 21, 2024, promises an immersive experience with visually stunning graphics, intricate motion capture, brutal combat sequences, and improved audio design. The sequel is poised to exceed the already high expectations set by its predecessor, Hellblade: Senua's Sacrifice.
Equally captivating was the introduction of Machine Games' Indiana Jones and the Great Circle. While the release date is yet to be confirmed for 2024, the game's seamless blend of first-person and third-person perspectives, along with cinematic cutscenes, iconic puzzle-solving, whip combat, and exhilarating rope-swinging action, has already garnered significant interest from fans of the legendary archaeologist.
Microsoft didn't stop there, catering to RPG enthusiasts with the announcement of Avowed, set in the beloved Pillars of Eternity universe, scheduled for a fall 2024 release. Attendees at the event were treated to a sneak peek of the game's captivating combat mechanics, showcasing an array of weapons that players can wield to overcome adversaries and promising a fantastical realm like never before.
In addition to these blockbusters, Microsoft revealed two more noteworthy games – Visions of Mana and Ara: History Untold – set to transport players into mesmerizing worlds filled with magic, wonder, and untold stories. With this diverse and captivating lineup, 2024 is shaping up to be an extraordinary year for gamers.
Stock Performance and Investor Confidence:
As the gaming world buzzes with excitement over Microsoft's stellar announcements, the stock market reflects the positive sentiment. On January 20, 2024, NASDAQ:MSFT stock displayed strong performance, trading near the top of its 52-week range and above its 200-day simple moving average. The day's trading saw a $4.80 increase, representing a rise of 1.22%, with the stock closing at $398.67.
Despite a slight drop in after-hours trading, the overall performance suggests positive momentum and investor confidence in the stock. Investors and analysts pay close attention to indicators such as trading near the top of the 52-week range, signaling potential future performance.
Conclusion:
Microsoft's gaming division is paving the way for the company's continued success, as evidenced by the captivating titles unveiled at the Xbox Developer Direct event. The surge in stock performance on January 20, 2024, reflects investor confidence in Microsoft's ability to innovate and dominate the gaming industry. As the company continues to expand its product offerings and adapt to market trends, the positive outlook for NASDAQ:MSFT stock positions it as an attractive investment option in the technology sector. The gaming landscape is evolving, and Microsoft is at the forefront of this exciting transformation.

MSFT Bull rides in the channelMy long term target is about 1100. Once the we get a channel break the bear starts with a low in the long term buy zone. The grind up again.

🐱🐉 The Magnificent, One and Only Million Million OpportunityAs we approach the end of 2023, we are just a short time away from the 1st anniversary of the AI research company ChatGPT's chatbot being launched on November 30, 2022.
This publication, although dedicated to a single company - Microsoft Corporation - is educational in nature, and is a representation of a letter to shareholders - 2023 by Satya Nadella, Chairman and CEO of Microsoft Corporation NASDAQ:MSFT - the second company in the world after Apple in terms of market capitalization.
I hope that each of you will be able to master it, look back, and realize what a rapidly changing world we all live in now.
Enjoy!
October 16, 2023
Dear shareholders, colleagues, customers, and partners:
We are living through a time of historic challenge and opportunity. As I write this, the world faces ongoing economic, social, and geopolitical volatility. At the same time, we have entered a new age of AI that will fundamentally transform productivity for every individual, organization, and industry on earth, and help us address some of our most pressing challenges.
This next generation of AI will reshape every software category and every business, including our own. Forty-eight years after its founding, Microsoft remains a consequential company because time and time again—from PC/Server, to Web/Internet, to Cloud/Mobile—we have adapted to technological paradigm shifts. Today, we are doing so once again, as we lead this new era.
Amid this transformation, our mission to empower every person and every organization on the planet to achieve more remains constant. As a company, we believe we can be the democratizing force for this new generation of technology and the opportunity it will help unlock for every country, community, and individual, while mitigating its risks.
Here are just a few examples of how we are already doing this:
• Leading electronic health records vendor Epic is addressing some of the biggest challenges facing the healthcare industry today—including physician burnout—by deploying a wide range of copilot solutions built on Azure OpenAI Service and Dragon Ambient eXperience Copilot.
• Mercado Libre is reducing the time its developers spend writing code by more than 50 percent with GitHub Copilot, as the company works to democratize e-commerce across Latin America.
•Mercedes-Benz is making its in-car voice assistant more intuitive for hundreds of thousands of drivers using ChatGPT via the Azure OpenAI Service.
• Lumen Technologies is helping its employees be more productive, enabling them to focus on higher value-added activities, by deploying Microsoft 365 Copilot.
• Nonprofit The Contingent is matching foster families with children in need using Dynamics 365, Power BI, and Azure, with an eye on using AI to amplify its work across the US.
• And, Taiwan’s Ministry of Education has built an online platform to help elementary and high school students learn English using Azure AI.
To build on this progress, we remain convicted on three things: First, we will maintain our lead as the top commercial cloud while innovating in consumer categories, from gaming to professional social networks. Second, because we know that maximum enterprise value gets created during platform shifts like this one, we will invest to accelerate our lead in AI by infusing this technology across every layer of the tech stack. And, finally, we will continue to drive operating leverage, aligning our cost structure with our revenue growth.
As we make progress on these priorities, we delivered strong results in fiscal year 2023, including a record $211 billion in revenue and over $88 billion in operating income.
A NEW ERA OF AI
There are two breakthroughs coming together to define this new era of AI.
• The first is the most universal interface: natural language. The long arc of computing has, in many ways, been shaped by the pursuit of increasingly intuitive human-computer interfaces—keyboards, mice, touch screens. We believe we have now arrived at the next big step forward—natural language—and will quickly go beyond, to see, hear, interpret, and make sense of our intent and the world around us.
• The second is the emergence of a powerful new reasoning engine. For years, we’ve digitized daily life, places, and things and organized them into databases. But in a world rich with data, what has been most scarce is our ability to reason over it. This generation of AI helps us interact with data in powerful new ways—from completing or summarizing text, to detecting anomalies and recognizing images—to help us identify patterns and surface insights faster than ever.
Together, these two breakthroughs will unlock massive new opportunity. And, in fact, just last month we announced our vision for Copilot, an everyday AI companion. We are building Copilot into all our most used products and experiences and allowing people to summon its power as a standalone app as well. Just like you boot up an OS to access applications or use a browser to visit websites today, our belief is that you will invoke a Copilot to do all those activities and more: to shop, to code, to analyze, to learn, to create.
As a company, any time we approach a transition like this, we do so responsibly. We believe AI should be as empowering across communities as it is powerful, and we’re committed to ensuring it is responsibly built and designed, with safety in mind from the outset.
OUR OPPORTUNITY
Every customer solution area and every layer of our tech stack will be reimagined for the AI era. And that’s exactly what we’ve already begun to do:
Infrastructure
Four years ago, we first invested in our AI supercomputer, with a goal of building the best cloud for training and inference. Today, it’s being used by our partner OpenAI to power its best-in-class foundation models and services, including one of the fastest-growing consumer apps ever—ChatGPT. NVIDIA, as well as leading AI startups like Adept and Inflection, is also using our infrastructure to build its own breakthrough models.
More broadly, organizations continue to choose our ubiquitous computing fabric—from cloud to edge—to run their mission-critical applications. We continued to see more cloud migrations to Azure this past fiscal year, as it remains early when it comes to the long-term cloud opportunity. And we also continue to lead in hybrid computing with Azure Arc, which now has 18,000 customers.
Data and AI
Every AI app starts with data, and having a comprehensive data and analytics platform is more important than ever. Our Intelligent Data Platform brings together operational databases, analytics, and governance so organizations can spend more time creating value and less time integrating their data estate. We also introduced Microsoft Fabric this year, which unifies compute, storage, and governance with a disruptive business model.
With Azure AI, we are making foundation models available as platforms to our customers. We offer the best selection of industry-leading frontier and open models. In January, we made the Azure OpenAI Service broadly available, bringing together advanced models, including ChatGPT and GPT-4, with the enterprise capabilities of Azure. More than 11,000 organizations across industries are already using it for advanced scenarios like content and code generation. Meta chose us this summer as its preferred cloud to commercialize its Llama family of models. And, with Azure AI Studio, we provide a full lifecycle toolchain customers can use to ground these models on their own data, create prompt workflows, and help ensure they are deployed and used safely.
Digital and app innovation
GitHub Copilot is fundamentally transforming developer productivity, helping developers complete coding tasks 55 percent faster. More than 27,000 organizations have chosen GitHub Copilot for Business, and to date more than 1 million people have used GitHub Copilot to code faster. We also announced our vision for the future of software development with GitHub Copilot X, which will bring the power of AI throughout the entire software development lifecycle. All up, GitHub surpassed $1 billion in annual recurring revenue for the first time this fiscal year.
We’re also applying AI across our low-code/no-code toolchain to help domain experts across an organization automate workflows, create apps and webpages, build virtual agents, or analyze data, using just natural language with copilots in Power Platform. More than 63,000 organizations have used AI-powered capabilities in Power Platform to date.
Business applications
We are bringing the next generation of AI to employees across every job function and every line of business with Dynamics 365 Copilot, which works across CRM and ERP systems to reduce burdensome tasks like manual data entry, content generation, and notetaking. In fact, our own support agents are using Copilot in Dynamics 365 Customer Service to resolve more cases faster and without having to call on peers to help. With our Supply Chain Platform, we’re helping customers apply AI to predict and mitigate disruptions. And, with our new Microsoft Sales Copilot, sellers can infuse their customer interactions with data from CRM systems—including both Salesforce and Dynamics—to close more deals.
All up, Dynamics surpassed $5 billion in revenue over the past fiscal year, with our customer experience, service, and finance and supply chain businesses each surpassing $1 billion in annual sales.
Industry
Across industries, we are rapidly becoming the partner of choice for any organization looking to generate real value from AI. In healthcare, for example, we introduced the world’s first fully automated clinical documentation application, DAX Copilot. The application helps physicians reduce documentation time by half, freeing them to spend more time face to face with patients. And Epic will integrate it directly into its electronic health records system.
And, in retail, we introduced new tools to help companies manage their day-to-day operations and digitize their physical stores.
Modern work
We are rapidly evolving Microsoft 365 into an AI-first platform that enables every individual to amplify their creativity and productivity, with both our established applications like Office and Teams, as well as new apps like Designer, Stream, and Loop. Microsoft 365 is designed for today’s digitally connected, distributed workforce.
This year, we also introduced a new pillar of customer value with Microsoft 365 Copilot, which combines next-generation AI with business data in the Microsoft Graph and Microsoft 365 applications to help people be more productive and unleash their creativity at work. Just last month, I was excited to announce that we will make Microsoft 365 Copilot generally available to our commercial customers later this year.
We continue to build momentum in Microsoft Teams across collaboration, chat, meetings, and calls. We introduced a new version of Teams that delivers up to two times faster performance, while using 50 percent less memory. We also introduced Teams Premium to meet enterprise demand for AI-powered features like intelligent meeting recaps. All up, Teams usage surpassed 300 million monthly active users this year.
With Microsoft Viva, we have created a new category for employee experience. Copilot in Viva offers leaders a new way to build high-performance teams by prioritizing both productivity and employee engagement. This year, Viva surpassed 35 million monthly active users.
Security
As the rate and pace of cyberthreats continue to accelerate, security is a top priority for every organization. Our comprehensive, AI-powered solutions give defenders the advantage. With Security Copilot, we’re combining large language models with a domain-specific model informed by our threat intelligence and 65 trillion daily security signals, to transform every aspect of security operations center productivity.
All up, more than 1 million organizations now count on our comprehensive, AI-powered solutions to protect their digital estates, and our security business surpassed $20 billion in annual revenue, as we help protect customers across clouds and endpoint platforms.
Search, advertising, and news
We are reshaping daily search and web habits with our new Bing and Microsoft Edge browser, which brings together search, browsing, chat, and AI into one unified experience to deliver better search, more complete answers, a new chat experience, and the ability to generate content. We think of these tools as an AI copilot for the web.
We are also bringing these breakthrough capabilities to businesses, with Bing Chat Enterprise, which offers commercial data protection, providing an easy on-ramp for any organization looking to get the benefit of next-generation AI today.
Although it’s early in our journey, Bing users engaged in more than 1 billion chats and created more than 750 million images over the past year as they apply these new tools to get things done. And Edge has taken share for nine consecutive quarters.
More broadly, we continue to expand our opportunity in advertising. This year, Netflix chose us as its exclusive technology and sales partner for its first ad-supported subscription offering, a validation of the differentiated value we provide to any publisher looking for a flexible partner to build and innovate with them.
LinkedIn
The excitement around AI is creating new opportunities across every function—from marketing, sales, service, and finance, to software development and security. And LinkedIn is increasingly where people are going to learn, discuss, and uplevel their skills. We are using AI to help our members and customers connect to opportunities and tap into the experiences of experts on the platform. In fact, our AI-powered articles are already the fastest-growing traffic driver to the network.
All up, LinkedIn’s revenue surpassed $15 billion for the first time this fiscal year, a testament to how mission critical the platform has become to help more than 950 million members connect, learn, sell, and get hired.
Gaming
In gaming, we are rapidly executing on our ambition to be the first choice for people to play great games whenever, wherever, and however they want. With Xbox Game Pass, we are redefining how games are distributed, played, and viewed. Content is the flywheel behind the service’s growth, and our pipeline has never been stronger. It was especially energizing to release Starfield this fall to broad acclaim, with more than 10 million players in the first month post-launch alone.
Earlier this month, we were thrilled to close our acquisition of Activision Blizzard, and we look forward to sharing more in the coming months about how, together , we will bring the joy of gaming to more people around the world.
Devices and creativity
Finally, we’re turning Windows into a powerful new AI canvas with Copilot, which rolled out as part of a Windows 11 update last month. It uniquely incorporates the context and intelligence of the web, your work data, and what you are doing in the moment on your PC to provide better assistance, while keeping your privacy and security at the forefront. Overall, the number of devices running Windows 11 more than doubled in the past year. And we are also transforming how Windows is experienced and managed with Azure Virtual Desktop and Windows 365, which together surpassed $1 billion in annual revenue for the first time.
OUR RESPONSIBILITY
As we pursue our opportunity, we are also working to ensure technology helps us solve problems—not create new ones. To do this, we focus on four enduring commitments that are central to our mission and that take on even greater importance in this new era. For us, these commitments are more than just words. They’re a guide to help us make decisions across everything we do—as we design and develop products, shape business processes and policies, help our customers thrive, build partnerships, and more —always asking ourselves critical questions to ensure our actions are aligned with them.
How can we expand opportunity?
First, we believe access to economic growth and opportunity should reach every person, organization, community, and country. And although AI can serve as a catalyst for opportunity and growth, we must first ensure everyone has access to the technologies, data, and skills they need to benefit.
To achieve this, we are focused on getting technology into the hands of nonprofits, social entrepreneurs, and other civil society organizations to help them digitally transform, so they can help address some of society’s biggest challenges. This year, we provided nonprofits with over $3.8 billion in discounted and donated technology. Nearly 325,000 nonprofits used our cloud. And to help them tap the potential of AI, we’re building new AI capabilities for fundraising, marketing, and program delivery.
AI will displace some jobs, but it will also create new ones. That’s why we aim to train and certify 10 million people by 2025 with the skills for jobs and livelihoods in an increasingly digital economy. Since July 2020, we’ve helped 8.5 million people, including 2.7 million this year. We’ve also focused on skilling women and underrepresented communities in cybersecurity, working across 28 countries and with nearly 400 US community colleges to scale our efforts.
Finally, to help people learn more about AI, we launched the first online Professional Certificate on Generative AI in partnership with LinkedIn Learning, created AI tools for educators, and held our first AI Community Learning event in the US. These events will be replicated around the world and localized in 10 languages over the next year. We also partnered to launch a Generative AI Skills Grant Challenge to explore how nonprofit, social enterprise, and research or academic institutions can empower the workforce to use this new generation of AI.
How can we earn trust?
To create positive impact with technology, people need to be able to trust the technologies they use and the companies behind them. For us, earning trust spans the responsible use of AI, protecting privacy, and advancing digital safety and cybersecurity.
Our commitment to responsible AI is not new. Since 2017, we’ve worked to develop our responsible AI practice, recognizing that trust is never given but earned through action.
We have translated our AI principles into a core set of implementation processes, as well as tools, training, and practices to support compliance. But internal programs aren’t enough. We also enable our customers and partners to develop and deploy AI safely, including through our AI customer commitments and services like Azure AI Studio, with its content safety tooling and access to our Responsible AI dashboard.
Building AI responsibly requires that we work with other industry leaders, civil society, and governments to advocate for AI regulations and governance globally. This year, we released our Governing AI Blueprint, which outlines concrete legal and policy recommendations for AI guardrails. We are signatories to the eight voluntary commitments developed with the US White House, and proud of the six additional commitments we’ve made to further strengthen and operationalize the principles of safety, security, and trust.
The era of AI heightens the importance of cybersecurity, and we deepened our work across the private and public sectors to improve cyber-resilience. We’ve continued to support Ukraine in defending critical infrastructure, detecting and disrupting cyberattacks and cyberinfluence operations, and providing intelligence related to these attacks. Our Microsoft Threat Analysis Center team produced more than 500 intelligence reports to help keep customers and the public informed. And we published our third annual Microsoft Digital Defense Report, sharing our learnings and security recommendations.
We also remain committed to creating safe experiences online and protecting customers from illegal and harmful content and conduct, while respecting human rights. We supported the Christchurch Call Initiative on Algorithmic Outcomes to address terrorist and violent and extremist content online. And through the World Economic Forum’s Global Coalition for Digital Safety, we co-led the development of new global principles for digital safety.
Protecting customers’ privacy and giving them control of their data is more important than ever. We’ve begun our phased rollout of the EU Data Boundary, supporting our commercial and public sector customers’ need for data sovereignty. And each month, more than 3 million people exercise their data protection rights through our privacy dashboard, making meaningful choices about how their data is used.
How can we protect fundamental rights?
In an increasingly digital world, we have a responsibility to promote and protect people’s fundamental rights and address the challenges technology creates. For us, this means upholding responsible business practices, expanding connectivity and accessibility, advancing fair and inclusive societies, and empowering communities.
In 2023, we worked diligently to anticipate harmful uses of our technology and put guardrails on the use of technologies that are consequential to people’s lives or legal status, create risk of harm, or threaten human rights. We will continue to assess the impact of our technologies, engage our stakeholders, and model and adopt responsible practices and respect for human rights—including across our global supply chain.
Today, our lives are more connected than ever. Access to education, employment, healthcare, and other critical services is increasingly dependent on technology. That’s why we’ve expanded our commitment to bring access to affordable high-speed internet to a quarter of a billion people around the world, including 100 million people in Africa, by the end of 2025. Since 2017, we’ve helped bring internet access to 63 million people, a key first step to ensuring communities will have access to AI and other digital technologies.
This year, we also continued working toward our five-year commitment to bridge the disability divide with a focus on helping close the accessibility knowledge gap. Seven hundred and fifty-thousand learners enriched their understanding of disability and accessibility in partnership with LinkedIn Learning, Teach Access, and the Microsoft disability community.
In addition, we’re stepping up efforts to combat online disinformation through new media content provenance technologies—enabling users to verify if an image or video was generated by AI. We continued our efforts to promote racial equity across Microsoft, our ecosystem, and our communities, including our work to advance justice reform through data-driven insights. And we provided support in response to eight humanitarian disasters, including committing $540 million of support to those who have been impacted by the War in Ukraine.
Finally, recognizing AI’s potential to advance human rights and humanitarian action, we worked on several AI for Humanitarian Action projects. Together with our partners, we’re building the capabilities to identify at-risk communities, estimate seasonal hunger, predict malnutrition, and assist in disease identification.
How can we advance sustainability?
Climate change is the defining issue of our generation, and addressing it requires swift, collective action and technological innovation. We are committed to meeting our own goals while enabling others to do the same. That means taking responsibility for our operational footprint and accelerating progress through technology.
We continue to see extreme weather impacting communities globally. To meet the urgent need, this must be a decade of innovation and decisive action—for Microsoft, our customers, and the world.
In our latest Environmental Sustainability Report, we shared our progress toward our 2030 sustainability targets across carbon, water, waste, and ecosystems. In 2022, our overall carbon emissions declined by 0.5 percent while our business grew. Addressing scope 3 emissions, which account for the vast majority of our emissions, is arguably our ultimate challenge—one we’ll continue to tackle through our supply chain, policy advances, and industry-wide knowledge-sharing.
We’ve provided just under 1 million people with access to clean water and sanitation, one of five pillars on our path to becoming water positive. And in our pursuit to be zero waste, we achieved a reuse and recycle rate of 82 percent for all our cloud hardware and diverted over 12,000 metric tons of solid operational waste from landfills and incinerators.
We also continue to take responsibility for the impacts of our direct operations on Earth’s ecosystems. We’ve contracted to protect 17,268 acres of land, over 50 percent more than the land we use to operate. Of that, 12,270 acres—the equivalent of approximately 7,000 soccer fields—were designated as permanently protected.
Technology is a powerful lever to help us avoid the most severe impacts of climate change. That’s why we’re accelerating our investment in more efficient datacenters, clean energy, enhancements to the Microsoft Cloud for Sustainability and Planetary Computer, and green software practices. To date, through our Climate Innovation Fund, we’ve allocated more than $700 million to a global portfolio of 50+ investments spanning sustainable solutions in energy, industrial, and natural systems.
Finally, we believe AI can be a powerful accelerant in addressing the climate crisis. We expanded our AI for Good Lab in Egypt and Kenya to improve climate resilience for the continent. And, together with our partners, we launched Global Renewables Watch, a first-of-its-kind living atlas that aims to map and measure utility-scale solar and wind installations, allowing users to evaluate progress toward a clean energy transition.
Although this new era promises great opportunity, it demands even greater responsibility from companies like ours. As we pursue our four commitments, we focus on transparency—providing clear reporting on how we run our business and how we work with customers and partners. Our annual Impact Summary shares more about our progress and learnings this year, and our Reports Hub provides detailed reports on our environmental data, political activities, workforce demographics, human rights work, and more.
OUR CULTURE
There’s never been a more important time to live our culture. The way we work and the speed at which we work are changing.
In an economy where yesterday’s exceptional is today’s expected, all of us at Microsoft will need to embrace a growth mindset and, more importantly, confront our fixed mindsets as our culture evolves. It will take everyday courage to reformulate what innovation, business models, and sales motions look like in this new era. As a high-performance organization, we aspire to help our employees maximize their economic opportunity, while simultaneously helping them learn and grow professionally and connect their own passion and purpose with their everyday work and the company’s mission.
To be successful, we need to be grounded in what our customers and the world need. We need to innovate and collaborate as One Microsoft. And we need to actively seek diversity and embrace inclusion to best serve our customers and create a culture where everyone can do their best work. To empower the world, we need to represent the world. To that end, we remain focused on increasing representation and strengthening our culture of inclusion. Even as we navigated challenges this year, our company continued to be the most globally diverse it’s ever been.
Giving also remains core to our culture. This year, more than 105,000 employees gave $242 million (including company match) to over 35,000 nonprofits in 116 countries. And our employees volunteered over 930,000 hours to causes they care about.
I am deeply grateful to our employees for their commitment to the company and their communities, and how they are living our mission and culture every day in a changing company and world.
**
In closing, this is Microsoft’s moment.
We have an incredible opportunity to use this new era of AI to deliver meaningful benefits for every person and every organization on the planet.
On New Year’s Day, I saw a tweet from Andrej Karpathy, Tesla’s former director of AI who now works at OpenAI, about how GitHub Copilot was writing about 80 percent of his code, with 80 percent accuracy. Two days later, I saw a stunning example of work we’ve done with the government of India’s Ministry of Electronics and IT, which is applying an AI model so farmers in rural areas can interact with government resources in their native languages.
Think about that: A foundation model that was developed on the West Coast of the United States is already transforming the lives of both elite developers and rural farmers on the other side of the globe. We’ve not seen this speed of diffusion and breadth of impact in the tech industry before.
As a company, this is our moment to show up and responsibly build solutions that drive economic growth and benefit every community, country, industry, and person. If we do it well, the world will do well, and Microsoft will do well too. I’ve never been more confident that we will deliver on this promise together in the days, months, and years to come.
Satya Nadella
Chairman and Chief Executive Officer
Thanks for reading. I hope the publication was useful and interesting for you.
@Pandorra 😎

MSFT @ 393.87Microsoft is in a technology race with companies such as AMD NASDAQ:AMD
According to breaking News the US video game
industry sales have improved in 2023
--
Have you heard of the rocket booster strategy?
Microsoft is involved in the video game industry
--
The rocket booster strategy has 3 steps
--
Rocket Booster Strategy
--
-Price Above 50 EMA
-Price Above 200 EMA
-Price Has to be in an uptrend
--
Microsoft looks like a good buy and here's why
Will Microsoft keep going up even after its overbought?
--
Rocket boost this content to learn more
--
**Disclaimer:**
The information provided above is for educational and informational purposes only.
--
It does not constitute financial advice, and trading always involves
--
a risk of substantial losses, regardless of the margin levels
--
used. Before engaging in any trading activities, it is crucial to
--
conduct thorough research, consider your financial situation,
--
and, if necessary, consult with a qualified financial advisor. Past
--
performance is not indicative of future results, and market
--
conditions can change rapidly. Trading decisions should be made
--
based on careful analysis and consideration of individual
--
circumstances. The user is solely responsible for any decisions made
--
and should be aware of the inherent risks associated with trading in
--
financial markets.

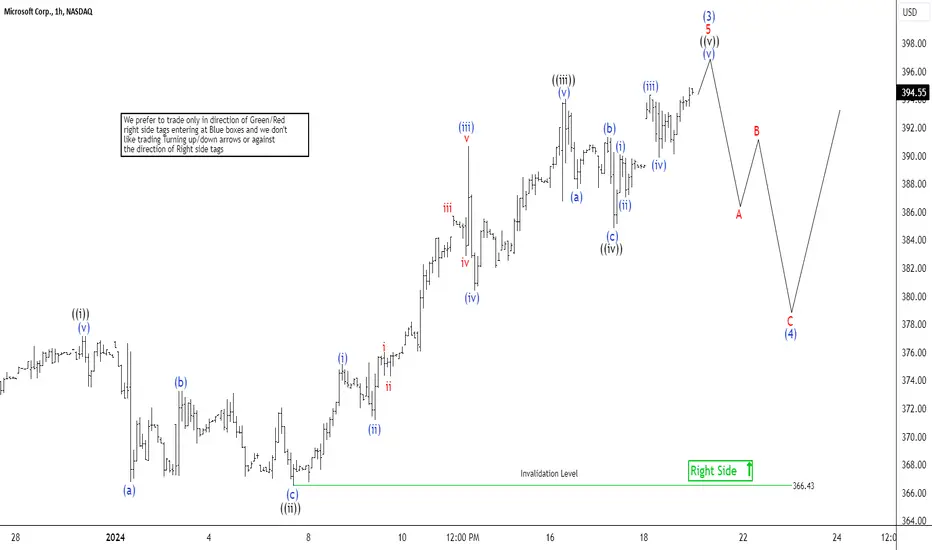
Microsoft (MSFT) Should Remain SupportedShort term Elliott Wave View in Microsoft (MSFT) suggests rally from 12.15.2023 low is unfolding as a 5 waves impulse. Up from 12.15.2023 low, wave ((i)) ended at 376.94 and dips in wave ((ii)) ended at 366.50 as the 1 hour chart below shows. Internal subdivision of wave ((ii)) unfolded as a zigzag structure. Down from wave ((i)), wave (a) ended at 366.77 and rally in wave (b) ended at 373.26. Wave (c) lower ended at 366.43 which completed wave ((ii)).
The stock resumed higher in wave ((iii)). Up from wave ((ii)), wave (i) ended at 375.20 and dips in wave (ii) ended at 371.19. Wave (iii) higher ended at 390.68 and pullback in wave (iv) ended at 380.38. Final leg wave (v) higher ended at 394.03 which completed wave ((iii)). The stock then pullback in wave ((iv)) as a zigzag structure. Down from wave ((iii)), wave (a) ended at 387.62 and wave (b) ended at 391.30.
Wave (c) lower ended at 384.81 which completed wave ((iv)). The stock resumes higher in wave ((v)) with internal subdivision as a 5 waves. Up from wave ((iv)), wave (i) ended at 390.11 and wave (ii) ended at 387.05. Wave (iii) higher ended at 394.32 and pullback in wave (iv) ended at 389.85. Expect the stock to complete wave (v) soon which should complete wave ((v)) of 5 of (3) in higher degree. Afterwards, it should do larger pullback in wave (4) in 3, 7, or 11 swing before it resumes higher.
Members Daily AnalysisAll indices close green: Rally lead by semiconductors.
This was not a broad market rally. 6 sectors close negative.
Yields moving up again: 10 Year yield confirms daily breakout.
Shipping rates continue to soar, Forward looking CPI may start to creep higher.

Microsoft - Triangle BreakoutHello Traders, welcome to today's analysis of Microsoft.
--------
Explanation of my video analysis:
All the way back in 2014 Microsoft stock perfectly broke above a major resistance area at the $35 level and entered a +1.000% bullmarket. Over the past three years Microsoft has been trading within an ascending triangle and recently broke out towards the upside. If we see a retest of the breakout level mentioned in the analysis, I am looking for bullish trading setups.
--------
I will only take a trade if all the rules of my strategy are satisfied.
Let me know in the comment section below if you have any questions.
Keep your long term vision.

Microsoft Corporation share price experienced some gainsMicrosoft Corporation (symbol ‘MSFT’) share price experienced some gains in the last quarter of the year with the majority of the bullish rally happening in November. The company’s earnings report for the fiscal quarter ending December 2023 is expected to be released on Tuesday 23rd of January. The consensus EPS is $2.75 against $2.32 of the same quarter last year.
‘As of Friday the 12th of January, Microsoft surpassed Apple as the world’s most valuable company by market cap as it was valued at $2.89 trillion versus Apple’s $2.88 trillion. Microsoft’s stock has been boosted by optimism over a $10 billion investment in OpenAI, meanwhile Apple has struggled amid legal troubles, slowing demand for electronics and more. The company also displays a solid financial image, as one would expect from the tech giant. As of 30/09/2023 the total assets grew by around 24% year over year while the current ratio is at around 166% showing the ability of the company to overcome any short term turmoil.’ said Antreas Themistokleous, trading specialist at Exness.
Technical analysis shows that the price has been testing the resistance of the upper band of the Bollinger bands for the last 4 sessions but has yet to correct to the downside. This indicates that volatility in the market for the share of the tech giant is fueled up. To further add to the bullish narrative we also see the 50 day moving average trading well above the 1oo day moving average validating the bullish trend. On the other hand the Stochastic oscillator is recording extreme overbought levels and possibly hinting that a correction might be seen in the coming sessions.

MSFT vs AAPLMSFT is in the mid of a decade long range vs AAPL. It has the AI hype around it and GPT plugin marketplace launching soon.
AAPL growth is slowing down. Sentiment among Apple marketplace developers is down too.
MSFT is definitely the better bet in 2024.

Microsoft (MSFT) - Looking Promising here on break of RectangleYields are starting to slide and this should be bullish for stocks overall.
MSFT has been doing fantastically well this year and I am expecting all time highs in the next week. Convincing break of 350 (bullish close on the daily) should set it free towards 400.
10 week EMA is now above 20 EMA. MSFT has momentum behind it.
390 remains the initial target.

12/27/23: MSFT Bullish Idea (Loki)
Based on Indicators, MSFT looks good for a bullish run looking at multiple indicators, patterns, support and resistance levels. If it holds above 374.50 that's a good sign for a move towards $377. 373.50, 372.50 would be support levels for example.
Hope everyone had a great holiday.
Note: I am invested into each ticker I do analysis on unless stated otherwise. Let me know if you have an interesting stock, ETF,' even Crypto I can do analysis on if i have the time and let me know any comments/feedback (mainly tech, ev, energy focused).
Cheers!
