Microsoft (MSFT) faces a challenging outlook after a 16% drop Microsoft (MSFT) faces a challenging outlook after a 16% drop from its July 2024 peak. The long-term bullish structure has broken, with critical support at 380.65 providing temporary relief. Short-term recovery targets include 395.20, 404.40, 418.70, and 427.70. A significant market pullback could drive shares toward 357-348, 333.50-324.50, or even 310.00-300.00, mirroring historical declines of approximately 35%.
MSFTC trade ideas

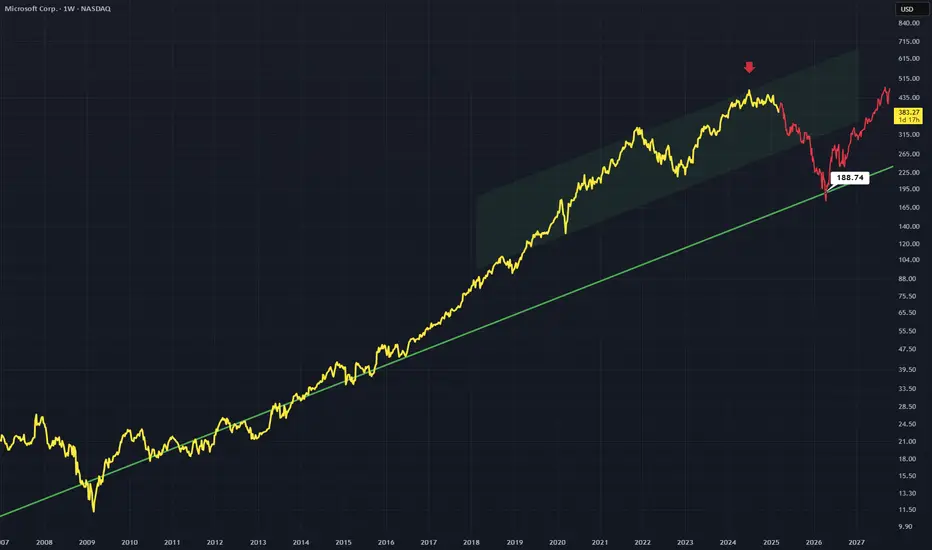
MSFT - Melt up & Crash series [2]Nothing has changed. Still believe it will rally to backtest the channel.
Not financial advice.

MICROSOFT BounceI anticipate a bounce in the Microsoft stock price, based on the following observations:
Bullish divergence in RSI
Breakout above a bearish trendline.

MSFT morning analysisI don't normally apply Elliott Wave Theory to individual stocks, but MSFT is about as clean as it gets.
Wave 2 is a zigzag of long duration, wave 4 is a triple-three of relatively short duration.
RSI with bearish divergence.
If this proves to be correct, the ultimate buy/long would be back towards the March 2020/COVID low (white rectangle).

MICROSOFT - AFTER FED-positive inflation expectations
- rate cuts this year expected
- bearish US Market

Microsoft (MSFT): The "Can’t Go Wrong" Stock... Until It DoesAh, Microsoft—the tech titan that could probably survive a meteor impact. 🌍☄️ With a market cap so large it could buy entire countries and still have spare change for a few yachts, MSFT is the stock that everyone loves... even when it’s overvalued. But hey, let’s take a look at the "genius" behind the current price action. 🔍💰
📊 The Almighty Stock Performance (Because Fundamentals Don’t Matter Anymore?)
📉 Price: $385.76 (up a whole 0.00584%! Call the champagne guy! 🍾)
📊 Intraday High: $387.88
📉 Intraday Low: $383.27 (because even Microsoft has bad days, right? 😅)
🔮 200-day moving average: $423.98 (oh look, it's trading below that... bearish much? 🐻)
So, let me get this straight. MSFT is 7.80% down year-to-date, but analysts are still screaming “BUY! 🚀.” Sure, because blindly trusting price targets has always worked out well for retail investors. 🤑
💰 Valuation: Overpriced? Who Cares, It’s Microsoft!
📢 Intrinsic Value Estimate: $316.34
😬 Current Price: $385.76
💰 Overvaluation? About 18%
But let’s be honest—does valuation even matter anymore? If people are throwing money at meme coins, why not pay a premium for MSFT? 🤷♂️ It’s basically a subscription service at this point—you pay every month, and the stock just keeps draining your wallet. 💸
🤖 AI Goldmine or Just Another Buzzword?
Microsoft has been riding the AI hype train harder than a teenager with ChatGPT. 🚂💨 Their enterprise AI growth is over 100%, and they’re pulling in a $13 billion annual run rate from AI services. But sure, let’s pretend that no one remembers the last time “the next big thing” crashed and burned. (cough dot-com bubble cough). 💀💾
Evercore analysts claim MSFT will dominate AI for enterprises. Well, duh. If you’re an enterprise and don’t buy Microsoft AI services, Satya Nadella himself might show up at your office and force you to install Windows 11. 🏢💻
📉 Risk Factors? No Way! MSFT is Invincible... Right?
🦅 Hawkish Fed = Potential Market Sell-Off (But don’t worry, just HODL, right? 🤡)
🚀 Tech Bubble Concerns (Microsoft will totally be the exception… like every overhyped stock before it. 😬)
🧐 Overvaluation? Pfft, who cares? (People said the same about Tesla at $400. Look how that turned out. 🪦)
📢 Analyst Hot Takes (Because They’re Always Right 😂)
📊 D.A. Davidson: Upgraded to Buy with a price target of $450. (Ah yes, let’s just throw numbers out there. Why not $500? $600? 🚀)
🔮 UBS: Predicts $3,200 for gold, but Microsoft will somehow go even higher. (Probably. Because… reasons. 🤷♂️)
🎭 Final Thoughts: Buy? Sell? Just Panic?
Microsoft is basically the “safe” tech stock everyone clings to while pretending that the market isn’t built on dreams and overleveraged hedge funds. 🏦💰 If you believe in the power of monopolies, overpriced AI services, and analysts pulling price targets out of thin air, then MSFT is your golden ticket. 🎟️💎
Otherwise, maybe—just maybe—waiting for a dip below fair value isn’t the worst idea in the world. But what do I know? I’m just some guy on the internet. 🤷♂️
🚀💸 Good luck, traders. You’ll need it. 😈📉
💬 What do you think? Drop your thoughts below! 👇🔥

MsftNasty distribution playing out here... End of Q2 target is 320-350
Monthly chart..
Reversal candle In Dec .
Structure is sideways for the entire 2024 which is an ENTIRE year of DISTRIBUTION.
Weekly chart
My minimum target for a Wyckoff off of this size is 345 or as low as the weekly 200ma
I don't think we go straight there.. I think in the next 2weeks price will draw down to close gap at 367.00 from Jan 2024 ..
Price has formed a controlled channel thats looking wedgy..
From 367 I expect a rebound up to
410-420
I don't think price gets back over 420, I think that's when MSFT and the rest of the market takes its next major leg down in May

$MSFT - It is playing outNASDAQ:MSFT : Back in September 2024, I identified a head-and-shoulders top pattern. It now appears that the right shoulder is finally complete, and the trendline has been broken.
The stock is getting close to the drop area I mentioned back then.

AAPL and MSFT Reading Charts For Better Entries and ExitsOptions Trading Strategy Using Ichimoku Cloud, 200 SMA & Monthly Contracts
(Following Your 3 Trading Rules)
This strategy adapts the Ichimoku Cloud & 200 SMA trend-following method for trading monthly options contracts with a focus on high-probability setups. It leverages time decay (theta), trend strength, and proper timing to maximize gains while reducing risk.
🔹 Strategy Overview
We will trade monthly options contracts using:
Trend confirmation via Ichimoku Cloud & 200 SMA
Directional bias based on price positioning
Entry timing rules to avoid low-probability setups
Theta-friendly positioning (avoiding weeklies to reduce time decay risks)
📈 Trading Rules & Setup
(My 3 Golden Rules)
🚫 No trading on Mondays → Avoids choppy market structure from weekend gaps.
🚫 No trading on Fridays → Avoids gamma risk and weekend time decay.
⏳ No trades before the first 15-minute candle closes → Ensures market direction is established.
📊 Selecting the Right Option Contract
For monthly expiration contracts, select options that:
Expire within 30 to 60 days (avoid weekly contracts to minimize rapid time decay).
Are slightly in-the-money (ITM) or at-the-money (ATM) for higher delta (0.55–0.70).
Have open interest >1,000 and a tight bid-ask spread to ensure liquidity.
Example: If today is June 11, trade the July monthly contract (third Friday of the month).
📉 Bearish Put Play (Short Trade)
200 SMA Bias: Price is below the 200 SMA
Ichimoku Cloud Confirmation:
Price is below the cloud
Tenkan-sen is below Kijun-sen (bearish momentum)
Chikou Span is below price from 26 candles ago
Future cloud is red
Entry Trigger (After First 15 Min Candle):
Price pulls back into the Kijun-sen but rejects it
OR price breaks below the cloud after a weak consolidation
Enter PUT contract (monthly expiration)
Stop Loss & Take Profit:
SL: Above Kijun-sen or recent swing high
TP: First at the cloud’s lower edge, second at a key support level
Exit before Theta decay accelerates (last 14 days before expiry)
📈 Bullish Call Play (Long Trade)
200 SMA Bias: Price is above the 200 SMA
Ichimoku Cloud Confirmation:
Price is above the cloud
Tenkan-sen is above Kijun-sen (bullish momentum)
Chikou Span is above price from 26 candles ago
Future cloud is green
Entry Trigger (After First 15 Min Candle):
Price pulls back into the Kijun-sen but holds
OR price breaks out above the cloud
Enter CALL contract (monthly expiration)
Stop Loss & Take Profit:
SL: Below Kijun-sen or recent swing low
TP: First at the cloud’s upper edge, second at a key resistance level
📊 Trade Management & Adjustments
Rolling: If trade is profitable near expiry but not at the full target, roll to the next monthly contract.
Closing Early: If the trade is at 70-80% max profit, close early to avoid decay risk.
Cutting Losses: If price closes inside the Ichimoku Cloud, consider exiting early (trend loss warning).
🛠 Why This Works for Monthly Options?
✅ Avoids time decay risks of weekly options by trading monthly contracts.
✅ Uses strong trend confirmation from Ichimoku & 200 SMA.
✅ Only trades at high-probability times, avoiding choppy Monday & Friday moves.
✅ Allows scaling into strong trends rather than short-term noise.

MICROSOFT Channel Down bottom formation targets $440.Microsoft (MSFT) has been trading within a Channel Down since the July 05 2024 High. The stock is on its latest Bearish Leg in the past 3 months and almost completed a -17.62% decline, similar with the Bearish Leg that led to the August 05 2024 Low.
As the 1D RSI has Double Bottomed, which is what it did on the April 30 2024 Low that kick started a rally of +20.63%, we expect the stock to initiate its new Bullish Leg of the Channel. The previous one was +18.16%, so we expect a similar range and target $440.
-------------------------------------------------------------------------------
** Please LIKE 👍, FOLLOW ✅, SHARE 🙌 and COMMENT ✍ if you enjoy this idea! Also share your ideas and charts in the comments section below! This is best way to keep it relevant, support us, keep the content here free and allow the idea to reach as many people as possible. **
-------------------------------------------------------------------------------
💸💸💸💸💸💸
👇 👇 👇 👇 👇 👇

MSFT Volume Profile price prediction is perfectMSFT Volume Profile price prediction. At has not failed in the past so why would it fail now

MSFT - Trend Line TestMSFT has formed a channel way above a dominant trend line
This is coupled with a double top (higher high double top) suggesting after a pull back bulls will return
I think there will be downward movement to test this trend line in green again
Weekly timeframe
MSFT - heading to support in the 340$ areaA very simple chart, just a channel and monthly MACD.
Like some other tech stocks the ATH was in July 2024 and price seems to be heading to the lower trend line. If it does, the entire market will go down further as well.
So keeping an eye on the monthly charts of big tech is important.
The MACD (standard settings) of AAPL, GOOGL and NVDA is about to cross into "sell".

Microsoft Stock Chart Fibonacci Analysis 031125Trading Idea
1) Find a FIBO slingshot
2) Check FIBO 61.80% level
3) Entry Point > 390/61.80%
Chart time frame: C
A) 15 min(1W-3M)
B) 1 hr(3M-6M)
C) 4 hr(6M-1year)
D) 1 day(1-3years)
Stock progress: B
A) Keep rising over 61.80% resistance
B) 61.80% resistance
C) 61.80% support
D) Hit the bottom
E) Hit the top
Stocks rise as they rise from support and fall from resistance. Our goal is to find a low support point and enter. It can be referred to as buying at the pullback point. The pullback point can be found with a Fibonacci extension of 61.80%. This is a step to find entry level. 1) Find a triangle (Fibonacci Speed Fan Line) that connects the high (resistance) and low (support) points of the stock in progress, where it is continuously expressed as a Slingshot, 2) and create a Fibonacci extension level for the first rising wave from the start point of slingshot pattern.
When the current price goes over 61.80% level , that can be a good entry point, especially if the SMA 100 and 200 curves are gathered together at 61.80%, it is a very good entry point.
As a great help, tradingview provides these Fibonacci speed fan lines and extension levels with ease. So if you use the Fibonacci fan line, the extension level, and the SMA 100/200 curve well, you can find an entry point for the stock market. At least you have to enter at this low point to avoid trading failure, and if you are skilled at entering this low point, with fibonacci6180 technique, your reading skill to chart will be greatly improved.
If you want to do day trading, please set the time frame to 5 minutes or 15 minutes, and you will see many of the low point of rising stocks.
If want to prefer long term range trading, you can set the time frame to 1 hr or 1 day.

Microsoft (MSFT) Technical Analysis & Options Outlook
Market Structure & Price Action
Microsoft (MSFT) is in a downward channel, with price testing a reversal zone between $375 - $380. The stock is attempting to stabilize but remains in a bearish structure until it can break key resistance levels.
* Trend: Short-term bearish; potential for a bounce.
* Reversal Zone: Price is currently consolidating near a potential demand zone, which may trigger a reversal if buyers step in.
* Key Resistance: $395 - $402
* Key Support: $375 - $370
Momentum Indicators
* MACD: Slight bullish crossover emerging, but still within a weak momentum range.
* Stochastic RSI: Rebounding from oversold conditions, signaling a possible short-term move higher.
GEX & Options Sentiment
* IVR (Implied Volatility Rank): 68.2, indicating moderate volatility.
* IVx Average: 35, showing an increase in options activity.
* Put-to-Call Ratio: 21.9% Puts, showing some bearish sentiment but not extreme.
* Gamma Exposure (GEX): 🟥🟥🟥, indicating that market makers may contribute to downward pressure.
* HVL (High Volume Level): $370, suggesting a key support where liquidity might concentrate.
Trade Scenarios
🔼 Bullish Scenario:
* A breakout above $395 could lead to a move towards $405 - $415, with a higher target at $430 if momentum strengthens.
* Entry: $395+ breakout with confirmation.
* Stop-loss: $385
* Profit targets: $405, $415, $430
🔽 Bearish Scenario:
* A breakdown below $375 could trigger further downside toward $370, and possibly test $360.
* Entry: Below $375
* Stop-loss: $385
* Profit targets: $370, $360
Conclusion & Outlook
MSFT is currently testing a demand zone but needs more confirmation before a solid reversal can be confirmed. Options data suggests some bearish pressure, but a bounce is possible if key resistance levels are cleared. Traders should monitor volume and price action carefully around $380 - $395 for the next move.
📉 Bearish Bias Unless a Reversal is Confirmed Above $395
📈 Upside Potential if Market Strength Increases
📌 This analysis is for educational purposes only and does not constitute financial advice. Trade carefully and manage risk accordingly.

Microsft Corp AnalysisI have analyzed Microsoft stock using trend, candle pattern & Gann system. I have also used time cycle here and then reached to conclusion for these targets.

MSFT - Melt up & Crash series [1] I predict it will backtest the ascending wedge. Estimated to be around May 30th 2025.
The Ichimoku cloud also acts as extra support as usually it requires two attempts to break a cloud (entering then exiting then re entering. I only see one. - Personal observation - I don't know why.

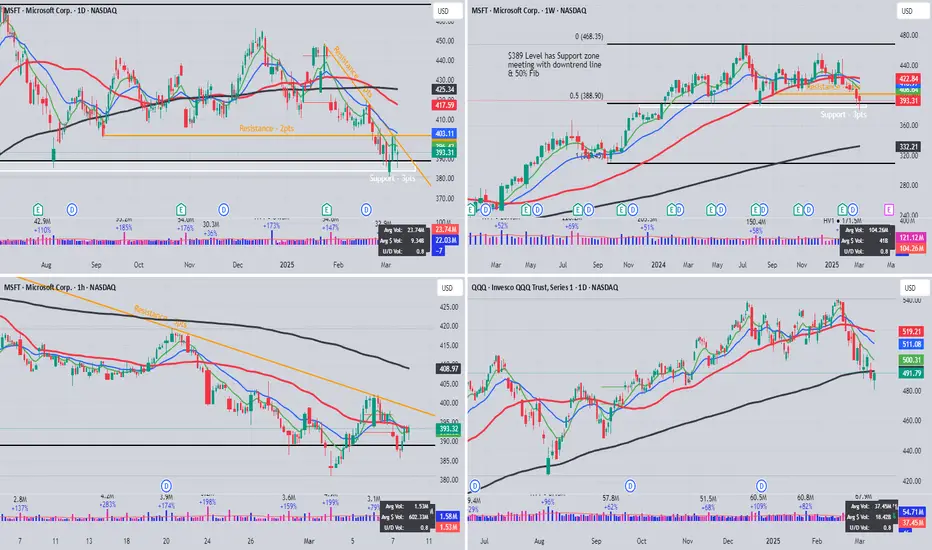
MSFT Multi Timeframe analysesMSFT Charts showing confluence at the $389 level. There are support & resistance lines meeting with 50% Fib.
Volume is higher at trendline touches but not extreme.
Microsoft Bounce off Support. MSFTElliott picture is unclear, yet there are signs of undergoing pivot. There is a fairly massive engulfing bullish candle that crosses both vWAP and US lines. There is a cross on the VZO, Ehler's Stochastic that occurred simultaneously. BB %PCT looks to cross soon as well. The stop loss is pretty tight, good luck in your trading.

MSFT Technical Analysis – Reversal in Progress?Market Structure & Key Levels
* Current Price: $400.90
* Support: $388.61, $381.00
* Resistance: $410, $415, $420
MSFT has shown bullish momentum after rebounding from the demand zone near $381. It has broken multiple Change of Character (ChoCH) patterns to the upside, indicating a shift from bearish to bullish structure.
Reversal Zone Analysis
MSFT recently bounced off a key liquidity zone and is now entering a potential reversal area between $400 - $410. If price sustains above $400, further upside toward $415 and $420 is possible.
Options & GEX Analysis
* IVR: 44.4
* IVx Avg: 29.2
* GEX: Green (indicating bullish positioning)
* Put Walls: $385, $380
* Call Walls: $410, $415, $420
Options flow suggests that MSFT is seeing increased bullish positioning, with notable put support at $385 and a gamma resistance wall at $410.
Trading Plan & Strategy
Bullish Scenario (Preferred)
* Entry: Above $400 with strong volume confirmation
* Target: $410, then $415
* Stop-Loss: Below $395
Bearish Scenario (Less Likely)
* Entry: If price rejects $405-$410 zone
* Target: $390
* Stop-Loss: Above $410
Options Trade Idea
* Bull Call Spread: Buy $400 Calls, Sell $415 Calls (April Expiry)
* Credit Put Spread: Sell $390 Puts, Buy $380 Puts
Final Thoughts
MSFT appears bullish in the short term, with momentum picking up. Watch for a clean breakout above $400 and whether price can sustain above $405. If rejected, expect a pullback to $390-$385.
Disclaimer:
This analysis is for educational purposes only and not financial advice. Please do your own research and manage risk accordingly.

MICROSFT ANALYSIS ShortI have analyzed Microsoft and found that it is in down trend. I have used trend & Gann level to conclude on this. First target achieved yesterday. Second & third target will also come in coming days.
I am also available on X with "skumarinsweden".

Microsoft Boosts Investments in SpainBy Ion Jauregui - ActivTrades Analyst
Microsoft continues to consolidate its presence in Aragon with the investment of 2.9 billion euros in a new data center in Zaragoza, reinforcing its commitment to growth in the region. This center is in addition to other projects that Microsoft has previously announced, totaling nearly 10,000 million euros in investments in Aragon. The new facility will be built in Parque Venecia, covering an area of 59 hectares, and will be developed in several phases, starting in 2026. Construction will create between 1,000 and 2,000 jobs, while once operational, the center will generate 300 jobs related to engineering and operation of critical systems.
This expansion is part of Microsoft's global effort to expand its cloud infrastructure, with the aim of strengthening its Azure-based service offering, boosting artificial intelligence and other digital services. The economic impact in Aragon is estimated at €2,685 million over the period from 2026 to 2030. This investment also underlines the company's commitment to regional development, following the line of other centers that Microsoft has installed in La Muela and Villamayor de Gállego, which are also designed to support the growth of cloud technology.
Microsoft Financial Data
In terms of its share price, Microsoft (MSFT) reported a decline of 2.09%, with a value of $388.58 per share as of recently. Throughout its last fiscal year, the company achieved annual revenues in excess of $200 billion, with net income of approximately $70 billion. Its growth remains robust, driven primarily by its cloud division and the continued development of its artificial intelligence platform, Azure.
Technical analysis.
Over the past week, Microsoft (MSFT) shares have trended lower. Below are the closing prices and daily ranges between 399.32 and closing at 388.49 with a premarket forecasting declines. The stock is currently trading at the last support zone that led the push to the highs. Currently the checkpoint is at 414.35 well above the current zone. RSI is at 32.05% in excessive oversold, so it is predictable a reversal to the middle zone of the control point because the company is not excessively overpriced.
*******************************************************************************************
The information provided does not constitute investment research. The material has not been prepared in accordance with the legal requirements designed to promote the independence of investment research and such should be considered a marketing communication.
All information has been prepared by ActivTrades ("AT"). The information does not contain a record of AT's prices, or an offer of or solicitation for a transaction in any financial instrument. No representation or warranty is given as to the accuracy or completeness of this information.
Any material provided does not have regard to the specific investment objective and financial situation of any person who may receive it. Past performance is not reliable indicator of future performance. AT provides an execution-only service. Consequently, any person acing on the information provided does so at their own risk.

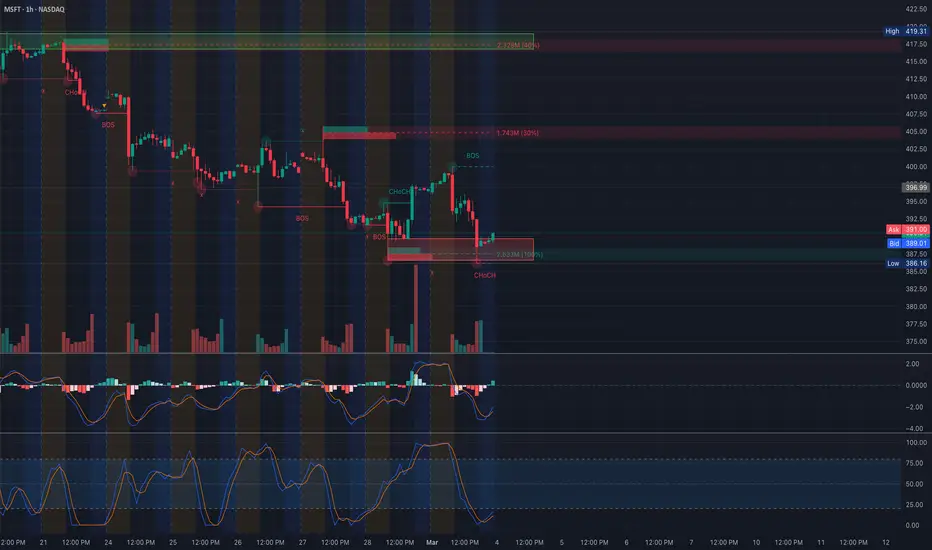
Microsoft (MSFT) Testing Critical Support! 📊 Technical Analysis (TA):
1. Trend & Structure:
* MSFT has been in a strong downtrend, marked by multiple Break of Structure (BOS) signals.
* Recent Change of Character (ChoCH) suggests a potential bottoming attempt.
* Key Resistance: ~400-415 (supply zone)
* Support Zone: ~385-388 (current demand area)
2. Indicators:
* MACD & Stochastics show early signs of bullish momentum but remain weak.
* Volume spikes indicate selling pressure is still dominant.
🔹 GEX & Options Flow:
1. Call Walls (Resistance) 🚧
* 415-420: Strong resistance, may cap any rally.
* 430: 3rd Call Wall, unlikely to be reached in the short term.
2. Put Walls (Support) 🛑
* 385: Immediate support where puts are concentrated.
* 380: Highest negative NETGEX, meaning if MSFT breaks below, a sharp drop to 360-370 is possible.
3. IV Rank & Skew:
* IVR 53.9, indicating mid-range volatility.
* Low put activity (6.4%), suggesting mixed positioning.
* Implied move: ±2.6%, indicating potential large swings.
📌 Trading Plan & Suggestions:
* Bullish Scenario:
* If MSFT holds 388-390, we could see a bounce toward 400-410.
* Calls or spreads with April expiry could benefit from a rebound.
* Bearish Scenario:
* If MSFT breaks 385, expect a drop toward 380, where put positioning increases.
* Ideal Put Play: Buy March-April 390P or 380P targeting 370-380.
⚠️ Key Warning: If MSFT holds 385-388, a relief rally could squeeze shorts.
🔥 Conclusion: MSFT at Decision Point – Bounce or Breakdown?
Microsoft is testing critical support, with options flow suggesting downside risk. The next sessions will determine if bulls defend or bears extend losses. Watch for price action near 385-390 before making a move. 🚀📉
🚨 Disclaimer:
This analysis is for educational purposes only and does not constitute financial advice. Always do your own research and trade responsibly.