Be like Mic(rosoft) - LONG at 410.95I get excited every time MSFT shows up on my screener, because it is literally THE #1 stock in my trading universe (over 2000 stocks) in terms of its risk-adjusted per day returns (.23% based on over 1000 real and backtested trades). I mean it's #1 all time and that return is even MJs number. That has to be a sign...
Seriously, though, when it produces over 1000 trades without a single losing trade, averaging a 2% gain in 9 trading days, I trade it EVERY chance I get.
For those who are new to my trading system, I'll provide a couple of comparisons. NASDAQ:AAPL (also undefeated) has produced a daily return of just over .14%/day over its 1300 trades and everyone's darling until last week, NASDAQ:NVDA (also undefeated), has produced an average return of around .11% per day spanning a little over 700 trades. Finally, the average return of the S&P 500 historically is just over .04% per day.
Now my ranking system also includes factors like maximum drawdown, maximum capital allocation, number of trades (trading history) and some other factors. So among large/mega caps, that composite score puts MSFT at #1, AAPL at #25 and NVDA at #280 (penalized for a much shorter track record than the other two while also producing lower returns). So you see, MSFT is a standout among standouts, just like #23 the G.O.A.T. was.
Right now, it is stuck in a trading range - and that's OK. Ranging stocks often provide the best results for me, given how I trade. That green lines also show some near-term support here. This is my second idea for MSFT, so if you want a taste of what to expect, check that first one out. In this market, I'll be happy with any win, though. Honestly, I'm happy with any win in any market. I'm not greedy.
Now this win won't likely be a home run, that's not what I do. I like quick wins that I can harvest profits from and then put that money back to work in another high probability trade. They aren't all quick, this is the market after all, but that is the goal. It usually is, though. We are in a tough market, so I'm prepared for a more challenging route to profitability than normal.
Per my usual strategy, I'll add to my position at the close on any day it still rates as a “buy” and I will use FPC (first profitable close) to exit any lot on the day it closes at any profit.
As always - this is intended as "edutainment" and my perspective on what I am or would be doing, not a recommendation for you to buy or sell. Act accordingly and invest at your own risk. DYOR and only make investments that make good financial sense for you in your current situation.
MSFTC trade ideas

MSFT in RangeDespite the rising wedge, in my opinion it is still a buy due to its fundamentals and tailwinds on AI and ChatGPT.

MSFT GEX Analysis and Option Trading SuggestionsKey Observations from GEX Chart
1. Call Resistance:
* Key resistance levels are observed at $420 and $415, with a strong gamma wall acting as a potential rejection zone.
2. Put Support:
* The strongest support is near $405, aligning with a high concentration of negative gamma exposure. Below this, $400 serves as additional support.
3. Gamma Pivot Zone:
* $412.50 acts as a pivotal point. Holding above this level could lead to a bullish continuation, while rejection might favor bears.
4. IVR (Implied Volatility Rank):
* IVR at 29.8, indicating relatively low implied volatility, making option premiums affordable for directional trades.
5. Implied Volatility (IVx):
* IVx at 25.1, with a decline of -4.2%, reflects reduced uncertainty in the market.
Option Trading Suggestions
1. Bullish Scenario:
* If MSFT breaks and sustains above $415:
* Trade Idea: Buy a Call Debit Spread.
* Strike 1: $415 (Buy Call)
* Strike 2: $425 (Sell Call)
* Expiry: 2-3 weeks out.
* Reasoning: This setup aims to capitalize on a breakout above resistance with a defined risk-reward ratio.
2. Bearish Scenario:
* If MSFT rejects $412.50 or breaks below $405:
* Trade Idea: Buy a Put Debit Spread.
* Strike 1: $410 (Buy Put)
* Strike 2: $400 (Sell Put)
* Expiry: 2-3 weeks out.
* Reasoning: Targets downside momentum toward the $400 support level.
3. Neutral Strategy:
* For expected consolidation between $405 and $420:
* Trade Idea: Sell an Iron Condor.
* Sell Put: $405
* Buy Put: $400
* Sell Call: $420
* Buy Call: $425
* Reasoning: Profits from time decay within the identified range while limiting risk.
Thoughts and Insights
* Critical Levels:
* Support: $405, $400
* Resistance: $415, $420
* Momentum Shift: A break above $415 confirms bullish sentiment, while a fall below $405 could attract more selling pressure.
* Volatility Context: Low IVR suggests cheaper option premiums, suitable for initiating directional trades or range-bound strategies.
Reminder:
GEX data updates every 15 minutes. Always refer to real-time data for precise trading decisions.
Disclaimer:
This analysis is for educational purposes only and does not constitute financial advice. Always perform your own research and manage risk effectively when trading.

microsoftMicrosoft (MSFT): With its impressive financial standing and integration of AI, Microsoft is solidifying its position in the tech and financial markets. its profit driven by the success of Azure and its involvement with OpenAI
the AI war will bring in liquidity and the winners will laugh last

$MSFT Microsoft Corp - Bearish Close NASDAQ:MSFT Microsoft Corp -
Bearish Weekly and Monthly Close on the =
A)POC (Point of Control) support.
B)Local Fib GP

MSFTMSFT currently in a somewhat broadening wedge formation in the 4hr chart I think we dip into the 410-413 area and retrace back to the upside with PT of 435-440 possible surpassing the trend line, also in a smaller time frame we’re in what looks like a descending wedge a break out from there to the upside would further confirm my thesis. NFA

Microsoft Top?Microsoft showing some worrisome behavior.
Not something you see in a healthy uptrend.
Again, you won't find low risk entries here.
Stay safe!

Microsoft Corp. (MSFT) SL-$448,59 TP-$379-Exhaustion pattern on daily chart
-Reversal candles on monthly chart
-MACD crossover on monthly and daily charts
-Strong magnetic points

Microsoft (MSFT) Shares Drop Over 6% After Earnings ReportMicrosoft (MSFT) Shares Drop Over 6% After Earnings Report
According to the Microsoft (MSFT) stock chart:
→ The candle on 29 January closed around $441 before the company released its Q4 2024 earnings report.
→ As a result, the 30 January session opened with a significant bearish gap and closed lower at around $415, marking a total decline of over 6%, despite the company exceeding analysts' expectations.
Media reports indicate:
→ Earnings per share (EPS) stood at $3.23, surpassing the forecast of $3.11.
→ Total revenue reached $69.63 billion, beating the projected $68.78 billion.
However, investor concerns arose due to slowing growth in Microsoft's Azure cloud segment and rising AI development costs. Business Insider reports that Microsoft plans to spend $80 billion on AI infrastructure this financial year. While this substantial investment aims to strengthen its AI position, doubts remain about its long-term profitability.
The technical analysis of the Microsoft (MSFT) stock chart presents a concerning picture, as the price has dropped to a key support level—the lower boundary of the upward channel (shown in blue). This channel was formed by a strong bullish impulse in early 2024 (indicated by an arrow), driven by AI enthusiasm. However, sentiment has shifted, with AI now acting as a selling trigger, increasing the risk of MSFT breaking below this key support.
If this happens, MSFT may test the psychological level of $400 per share once again. Notably, in 2024, the price has not stayed below this level for long.
Despite the recent decline, analysts remain optimistic about MSFT stock. According to a TipRanks survey:
→ 27 out of 30 analysts recommend buying MSFT.
→ The average 12-month price target for MSFT is $508.
Trade on TradingView with FXOpen. Consider opening an account and access over 700 markets with tight spreads from 0.0 pips and low commissions from $1.50 per lot.
This article represents the opinion of the Companies operating under the FXOpen brand only. It is not to be construed as an offer, solicitation, or recommendation with respect to products and services provided by the Companies operating under the FXOpen brand, nor is it to be considered financial advice.

MSFT at Critical Support -Bounce or Breakdown?### **📊 Full Technical Analysis – Microsoft (MSFT) – 1D Chart**
🚀 **Current Price:** **$415.24** (**-6.12% drop** today)
📉 **Massive sell-off after rejection at key resistance**
---
### **🔍 Key Technical Observations**
#### **1️⃣ Price Structure & Market Trend**
- **Previous Highs & Lows:**
- **Major Resistance at ~$460 (HH Zone - Area of Interest)**
- **Local Support at $390 - $400** (historical demand zone)
- **Current Fib Retracement Holding at 0.786 (~$414)**
- **Change of Character (CHoCH) Signals**:
- **Multiple bearish CHoCH formations** = Weak market structure
- Last bullish break of structure (BoS) led to a lower high → Potential **trend reversal confirmed**
#### **2️⃣ Fibonacci Levels Indicating Reversal Zones**
- **0.236 Fib (~$440)** → **Rejected hard**
- **0.382 Fib (~$432)** → **Intermediate resistance**
- **0.5 Fib (~$422 - Now lost)** → Could act as new resistance
- **0.618 Fib (~$414 - 415)** → **Testing now – critical zone!**
- **0.786 Fib (~$404 - Last defense for bulls)**
🔍 **If $414-$415 holds, we may see a bounce; if it fails, expect a drop to $404 or even $390.**
---
### **3️⃣ Volume & Delta Volume Shift**
📊 **Bearish Delta Volume (-200M)** – Heavy sell-side pressure
🔻 **37.96M Shares Sold** – Institutional-level sell-off
🔍 **Price dropped into a demand zone with high volume. This means either a strong bounce or a deeper breakdown.**
---
### **4️⃣ Moving Averages & Momentum**
✅ **Price tested 200-day EMA (potential support)**
⚠ **If it loses 200-EMA, next target is $390**
📉 **Momentum is weakening** – RSI likely below 50
---
### **🚀 Plan of Action: How to Trade This Setup?**
🔹 **Scenario 1: Bullish Reversal (Bounce from $414-$415 Support Zone)**
📌 **Entry:** **Go Long** above **$416-$418** if price reclaims support
🎯 **Target 1:** $432 (0.382 Fib)
🎯 **Target 2:** $440 (0.236 Fib)
🎯 **Target 3:** $460 (Major Resistance)
🛑 **Stop Loss:** **Below $410** to protect against a fakeout
📢 **Best Play? Wait for bullish confirmation (green candle) before entering a long!**
---
🔻 **Scenario 2: Breakdown Below $414 – Short Setup**
📌 **Entry:** If price breaks & closes below **$414**, **go short**
🎯 **Target 1:** **$404 (0.786 Fib Level)**
🎯 **Target 2:** **$390 (Major Support Zone)**
🛑 **Stop Loss:** Above **$420** (If price reclaims Fib levels, shorts are invalidated)
📢 **High Probability Short if volume continues to favor sellers!**
---
### **🔥 Options Trade Setup – High Probability Play**
**🛑 Bearish Play (If MSFT Breaks $414)**
📉 **BUY 1x MSFT $410 Put & SELL 1x MSFT $400 Put (Put Debit Spread)**
⏳ Expiration: Feb 16, 2025
🎯 Profit if MSFT drops toward $400
💰 **Risk/Reward: 3:1 (Low cost, high reward play)**
---
### **🏆 Final Verdict: High-Probability Trading Plan**
📌 **Key Level to Watch:** **$414-$415 Fib support**
📌 **Bullish above $418** → Buy dips for $432+
📌 **Bearish below $414** → Short for $404-$390
🚀 **What’s your take? Bullish bounce or further breakdown? Let’s trade smart!** 🔥📉

MSFT Short: Breakdown of TrendlineThis is an update to my previous idea where I mentioned that MSFT will move up in a wave 2 and then come down to a wave 3. It has happened and now we are seeing wave 3 that broke the trendline. It is still a short.

MSFT Long then Short: Wave 2 and Wave 3MSFT has completed the first intermediate wave 1 of 3 (blue waves) and now with the last 2 reversal candles, I am expecting it to push up in a wave 2 of 3 before coming down again on a wave 3 of 3.
The Fibonacci retracement levels are references for where the price may be rejected as it moves up in this wave 2 of 3.
The black down arrow is where I think it might be rejected.
I am setting this as a "short idea" even though in the short-term I expect it to move up. Reason being that the bigger trend is down.

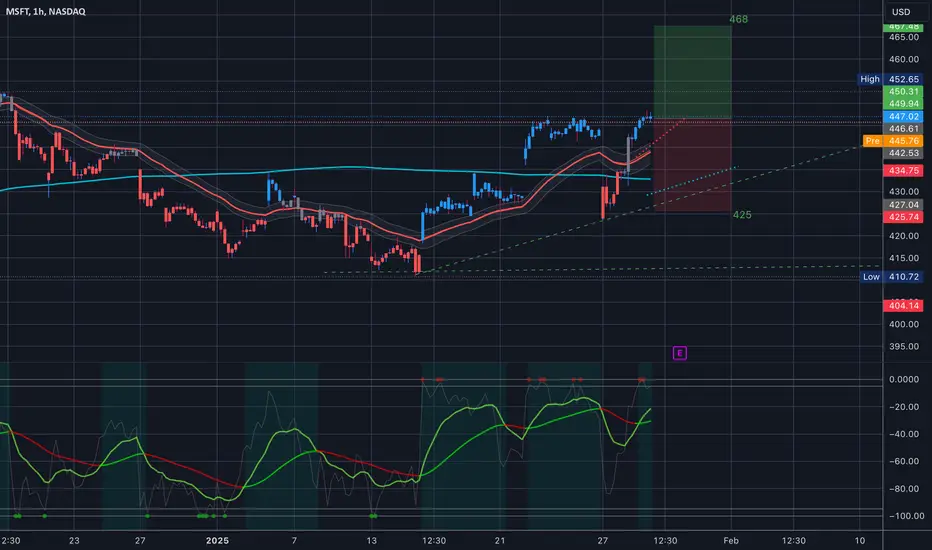
$MSFT Expected Move for EarningsAlright. MSFT earnings today and we have a 4.67% expected move from 425 - 468
MSFT: At Resistance – Next Move Determines the Trend🔥 LucanInvestor's Strategy:
🩸 Short: Below $440, targeting $430. Failure to hold above EMA 9 could accelerate the decline.
🩸 Long: Above $450, targeting $480. A breakout above resistance would confirm bullish continuation.
🔥 LucanInvestor's Commands:
🩸 Resistance: $450 — Key breakout level for further upside.
🩸 Support: $432 — EMA 200 serves as a crucial safety net.
Microsoft is showing strength but needs a decisive breakout above resistance to sustain bullish momentum. MACD suggests positive momentum, but volume must support the move.
👑 "Precision separates the winners from the watchers—act with intent."

MSFT Microsoft Corporation Options Ahead of EarningsIf you haven`t bought MSFT when they reported 49% stake in OpenAI:
Now analyzing the options chain and the chart patterns of MSFT Microsoft Corporation prior to the earnings report this week,
I would consider purchasing the 430usd strike price Calls with
an expiration date of 2025-2-21,
for a premium of approximately $15.35.
If these options prove to be profitable prior to the earnings release, I would sell at least half of them.

MSFT Faces Resistance Amid Bullish Recovery – Options GEX AnalysTechnical Analysis (TA) Overview for Trading
* Price Action: MSFT is trading near $435, recovering from its recent dip at $410. The price is approaching critical resistance zones after breaking out from a descending channel.
* Trend: MSFT is forming a higher-low structure, indicating potential bullish continuation.
* Support and Resistance Levels:
* Support: $425 (key consolidation zone) and $410 (previous low).
* Resistance: $440 (intermediate level) and $447-$455 (upper resistance zone).
* Indicators:
* MACD: Positive momentum with MACD crossing above the signal line, signaling potential continuation.
* Stochastic RSI: Overbought region, suggesting caution for immediate bullish positions as it may indicate short-term exhaustion.
* Volume Analysis: Strong buying interest on recovery, but needs sustained volume to confirm a breakout above $440.
Gamma Exposure (GEX) Analysis for Options Trading
* IVR & IVx: IVR is 50.7, and IVx is 33.3, indicating a moderately elevated implied volatility environment.
* GEX Levels:
* Highest Call Wall Resistance: $455.
* Key Call Levels: $440 and $447 (above current price action).
* Put Walls: Strong support from the $425 level, with a major put wall at $410.
* Options Flow: Skewed slightly bearish as of now, with minimal bullish pressure.
Trade Scenarios:
1. Bullish Setup:
* Entry: Above $440 after a confirmed breakout with volume.
* Target: $447-$455.
* Stop-Loss: Below $435.
2. Bearish Setup:
* Entry: If the price fails to break $440 and shows rejection.
* Target: $425.
* Stop-Loss: Above $442.
Conclusion
Microsoft is at a pivotal resistance level. A breakout above $440 with volume can signal bullish continuation, targeting $447-$455. However, overbought stochastic RSI and resistance pressure may trigger short-term pullbacks. Options GEX levels suggest strong resistance near $455 and support at $425-$410.
Disclaimer: This analysis is for educational purposes only and does not constitute financial advice. Always perform your own research before trading.

MSFT- $375 down the roud!This is not a trade recommendation.
Based on my technical analysis, Because point (A) is lower than the previous low (April 25- 2024), likely considered wave A and followed by wave B and the final stage would be wave C around $370.
The only element that makes this opinion invalid seeing the new ATH, otherwise $370 seems down the road.

weekly timeframe bear flag once this trendline is broken, expect a big crash to the next trend around 300

MICROSOFT - Ready to Excel!NASDAQ:MSFT
Ready to Excel! 📊
Breakout = 🎯$466 🎯$512
They started charging for their Co-Pilot AI product so we probably see some solid profits from that as they lumped it in with the overall subscription.
Essentially forcing it on everyone. 😅
Not financial advice

MCSFT - severe retracement incomingArguments:
-overbought
-expensive
-economic factors which influence the stock
-lost of momentum

MSFT SwingLooking at this possible long opportunity here, given that Nasdaq (QQQ) trades higher and also targets the 2024 High. Based on that notion, MSFT has more room to move higher and could give better RR on this trade/may provide low resistance liquidity run. It remains to be seen. Just a trade idea.


High prob Microsoft setup. This def goes over purple if this definitely retest purple. If not it will just bounce off bottom trend
