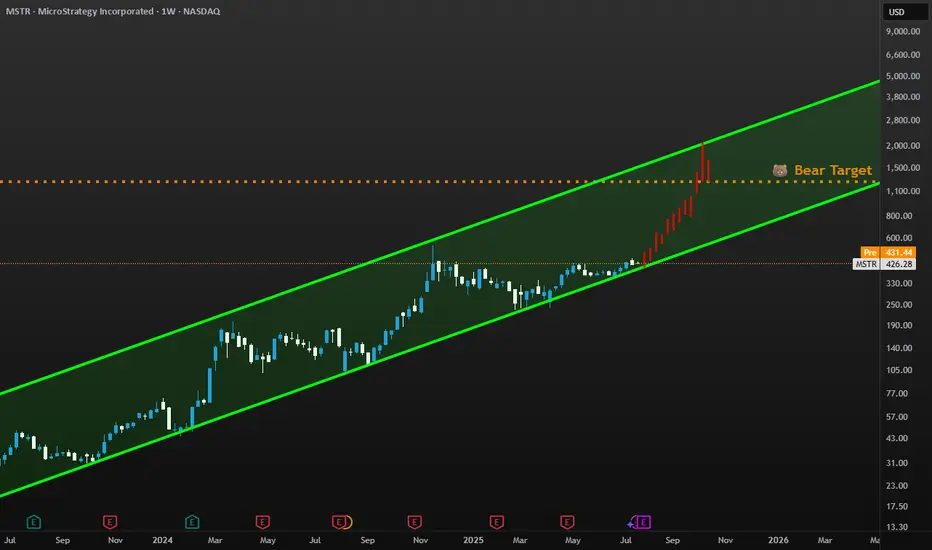
Possibility for MSTRIf bitcoin moves, Strategy moves.
I am no expert, so this is just for entertainment purposes.
But Strategy is acquiring bitcoin like there is no tomorrow and bitcoin inelastic supply tend to give a way to radical and fast grow in price.
Hence why I'd be keen to see MSTR move as much as I show in this chart.
MSTR trade ideas
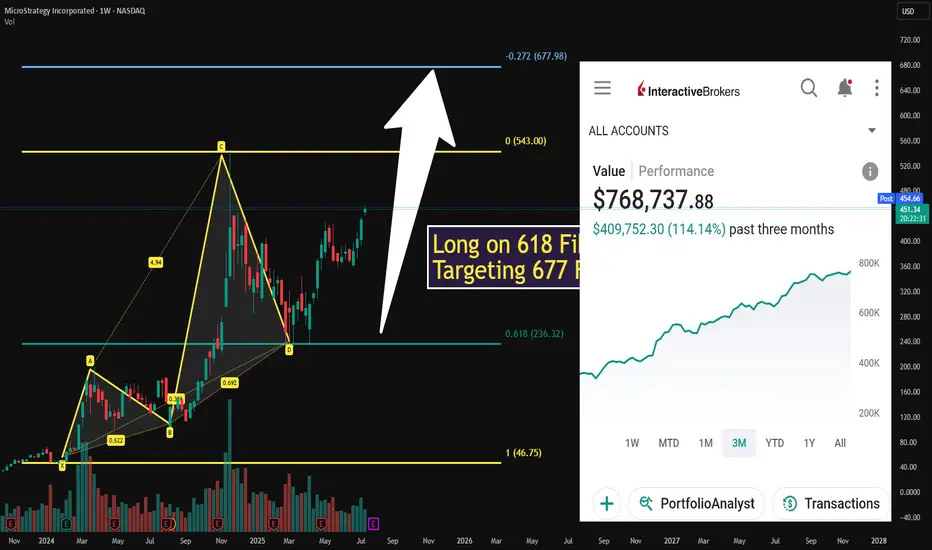
$MSTR ONCE IN A LIFETIME im up 400 GRAND!Targeting the 27.2 Extension with a MINIMUM target of 500
Do not LET OTHERS PUT U DOWN! I follow Fibonacci and I am up over 400k! FOLLOW UR SYSTEM!
I will alert my next buy here all I ask is drop a LIKE
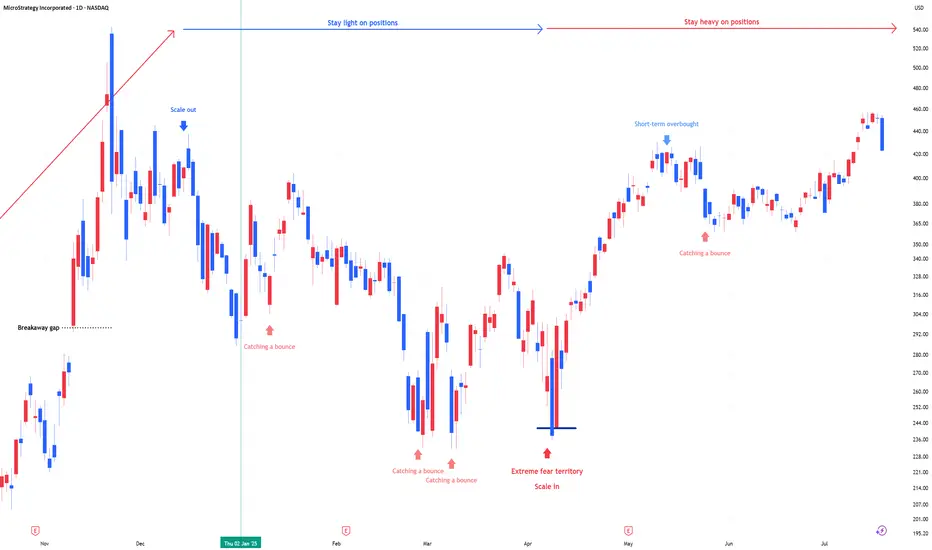
MSTR: Stay heavy on positions"MSTR position size is adjusted in line with US market and bitcoin signals for underweight or overweight allocations. During panic phases, 2x leverage ETFs are on the table."
Stay heavy on positions
MSTR's ASCENDING TRIANGLEMstr appears to be in an ascending triangle. Broke out of a wedge I tracked a while ago, crypto is breaking out in general and bullish crypto legislation is being passed. MSTR thus has potential to breakout all the way up to 500 or more. nfa
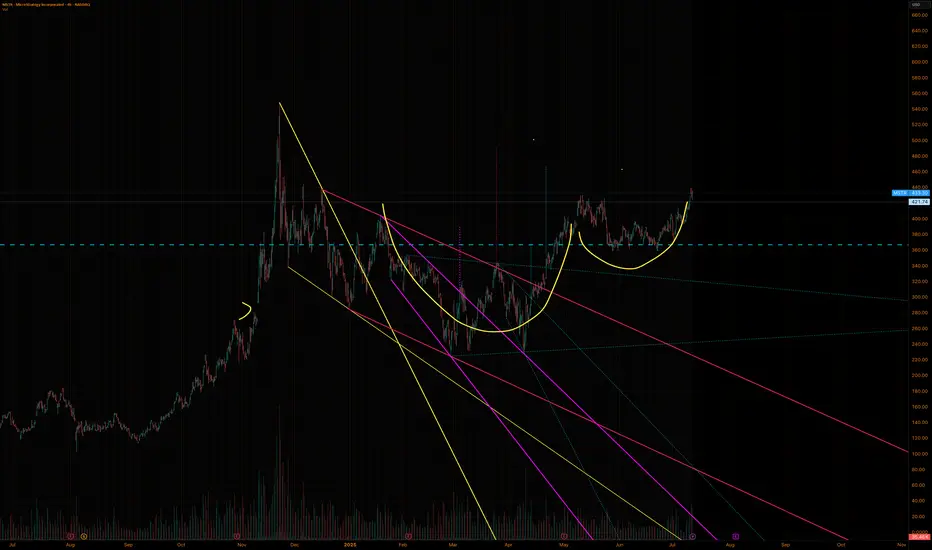
MSTR - Microstrategy Short...for now.The White Fork is created by choosing point A, which must be the lowest price before the swing.
B and C are the natural high and low of the swing we want to measure.
What this gives us is a Pitchfork that projects the most probable path of price.
Additionally, with the three lines that make the Fork, we have the natural extremes above, below, and the center—the mean.
We can see that price started to rise in March 2025.
The 80% rule states that price will reach the Centerline around 80% of the time.
And as we see, it did this time as well. Price reached the CL (Center Line), and immediately the big whales dumped positions.
Then price fell—only to be picked up before reaching the Lower Line, also called the L-MLH or Lower Median Line Parallel.
When price can't make it to this (or any of these) lines, we call this a 'Hagopian,' because it follows 'Hagopian's Rule.' This rule says that if price can't reach 'the line' (the L-MLH in this case), there is a high chance that price will reverse in the previous direction (up in this case), and even go further than where it came from (the Centerline).
And as we see, price indeed traded upwards—beyond where it came from—and overshot the Centerline (CL).
Unfortunately for long-positioned traders, the gas in the goose was empty, and price now starts to head south again, missing the target, which would have been the U-MLH (Upper Median Line Parallel).
So, the open happened below the CL!
If we also see a close this week, I'm ready to initiate a short trade.
Why?
Well, as before, Hagopian’s Rule applies—an indication that price will trade further down than where it came from, which is below $361.
And since we know that the natural target is the Centerline about 80% of the time, we have a heck of a good chance that we’ll be happy campers in a couple of weeks. :-)
With a risk/reward of about 2 to 3, and such a high chance of a profitable trade, I’ll sleep like a baby in the coming weeks.
The trade idea would be cancelled if price closes above the CL this Friday.
Let’s stalk it closely...

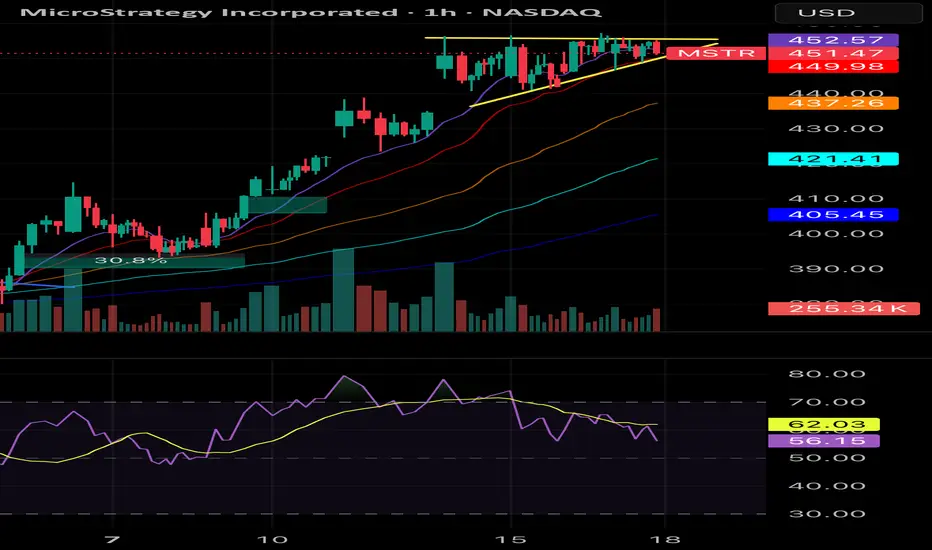
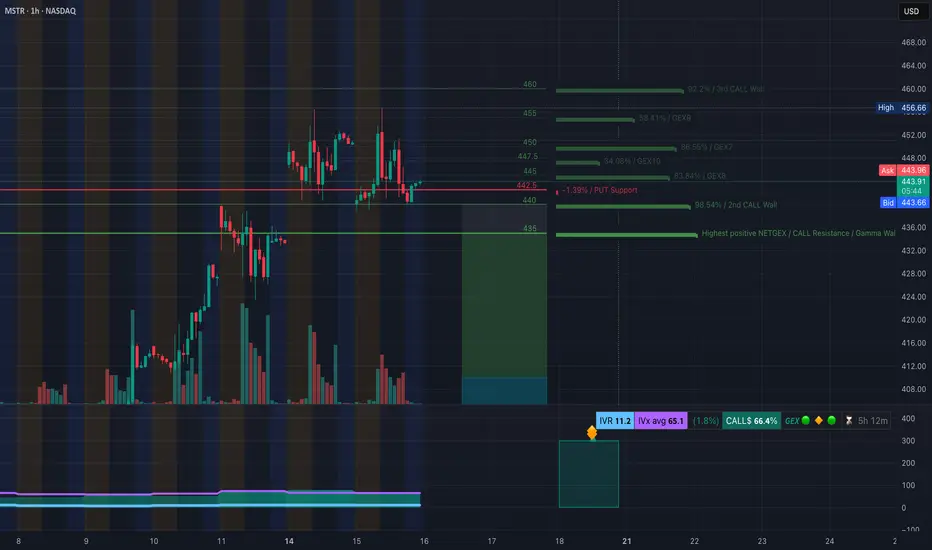
MSTR at Decision Zone! TA for July 16GEX + Price Structure Align for Breakout or Breakdown 🔸
🧠 GEX Levels & Options Sentiment (as of July 15, 2025)
* ⚠️ Key Call Resistance Levels:
• $460 (3rd Call Wall, 92.2%)
• $455 (58.41%)
• $447.5 (GEX10)
• $444.5 (GEX7) – overhead friction
* PUT Support Levels:
• $442.5 (near current price)
• $435 (Gamma Wall: highest positive NET GEX)
* Support Structure: Strong GEX support at $435
* Current IVR: 11.2 (extremely low)
* IVx Avg: 65.1
* Call Flow: 🚀 66.4% Call $ flow — strong bullish bias
* GEX Directional Lean: Bullish-neutral, but decision point is here
💡 Option Strategy Ideas:
* If MSTR holds above $444 → Target $447.5 and $455
• Play: Buy 445c or 450c (weekly expiry)
• Risk: < $442.50 closes
* If MSTR breaks $442 → Watch for slide to $435
• Play: Buy 440p or 435p
• Risk: Tight stop above $444.50 retest
📉 1H Chart Technical Analysis & Trade Plan
* Market Structure:
• Bullish channel still intact, but CHoCH just printed below $443
• Multiple Breaks of Structure (BOS) above $444 and $448.5
• Supply zone between $445–$447 acting as resistance
• Price is testing demand around $440–$442.5 (important junction)
* Trendlines: Price currently bouncing along the lower channel boundary
* Demand Zone: $428–$435 is the major support base
* If CHoCH holds and price fails to reclaim $445 → we could see a deeper retrace into $435
* If bulls reclaim and hold $445 → breakout toward $447.5 → $455 is likely
🔁 Intraday Scenarios for Tuesday (July 16):
* Scalp Long above $445.5
• Target: $447.5, $455
• Stop: below $443
* Scalp Put below $442
• Target: $435
• Stop: Above $444.50
🔚 Final Thoughts:
MSTR is at a make-or-break level, sandwiched between a GEX friction zone and key price structure support. Keep risk tight — this setup can move quickly.
This analysis is for educational purposes only and does not constitute financial advice. Always do your own research and trade responsibly.
$MSTR: Long term bullish trendNASDAQ:MSTR long term signal triggered...
Up trend in monthly scale until end of 2025.
Heard it here first, lads.
Best of luck!
Cheers,
Ivan Labrie.

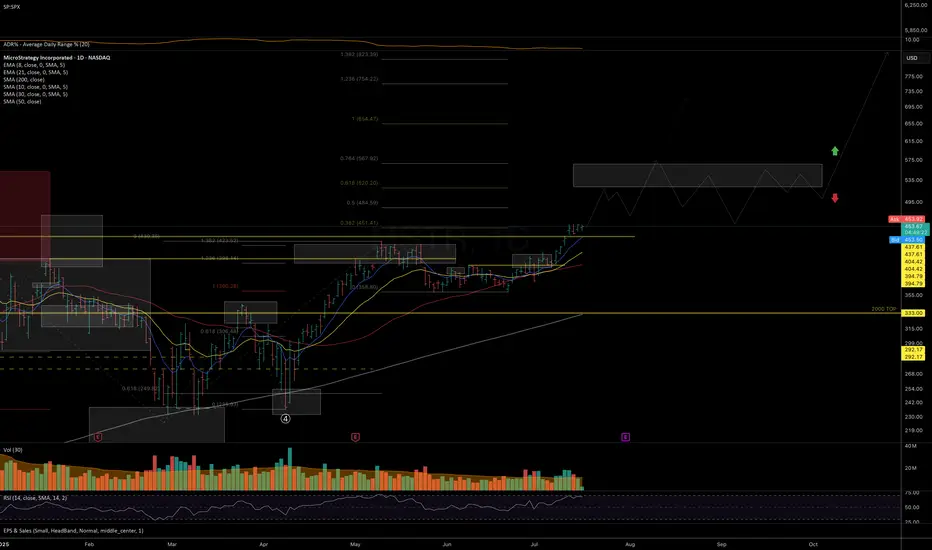
MSTR – On the Path to New ATHI was initially skeptical about the recovery structure unfolding since the April lows — it looked like a possible macro lower-high before deeper correction (as outlined in my previous idea).
However, given the strength in underlying #BTC price action (covered in my recent video-idea on crypto trend structure) and clear signs of constructive consolidation and accumulation during the July breakout, Isee strong odds for follow-through toward the 520–570 resistance zone in the coming weeks.
This move may align with CRYPTOCAP:BTC testing its macro resistance near 130K (see my macro BTC analysis on the idea section).
If NASDAQ:MSTR can break above 570 and sustain a close above it, it opens the door to a potential immediate follow-through toward the 650–755 macro resistance zone. But a scenario for more prolonged consolidation around 570 would in fact serve as a solid base for more stable and prolonged next long-term leg higher.
Strategy Finished Consolidating, New High With BTC Leading MicroStrategy (MSTR), the stock is currently demonstrating significant volatility and a strong correlation with Bitcoin's price movements, acting almost like a leveraged play on the cryptocurrency.
From a charting perspective, MSTR has been in a long-term bullish trend since its pivot to a Bitcoin acquisition strategy. However, it's prone to sharp corrections following Bitcoin's pullbacks, indicating high risk and reward. Key technical levels to watch would include its 200-day and 50-day moving averages as potential support and resistance zones.
The charts are now flashing strong signals that this sideways accumulation phase is drawing to a close. With Bitcoin (BTC) showing renewed strength and eyeing fresh all-time highs, MSTR, as the largest corporate holder of the digital asset, appears poised to break out. The correlation remains a potent force, and the current setup suggests MSTR is ready to re-engage its upward trajectory, targeting new price peaks in tandem with BTC

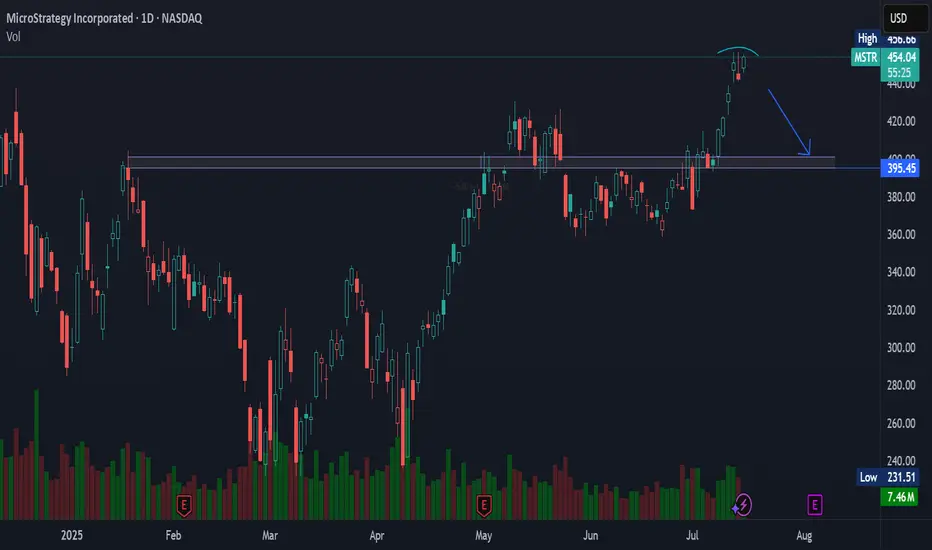
MSTR NASDAQ:MSTR looks like it’s gearing up for a pullback — eyes on the $395 level for a potential retest.
Watch the support. 👀📉
#MSTR #Bitcoin #Stocks #Tech #Trading
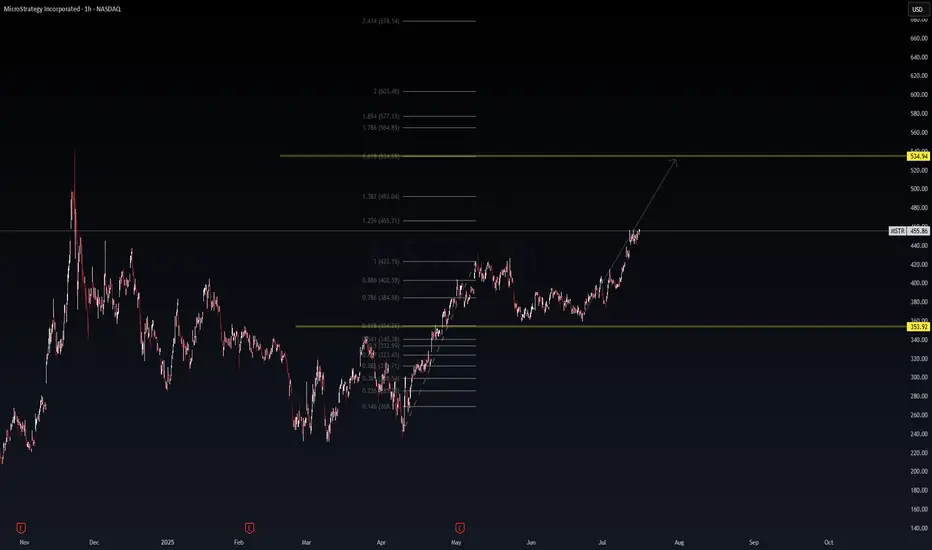
MSTR: Fibonacci Momentum Building Toward $534 🔺 MSTR: Fibonacci Momentum Building Toward $534 🚀
MicroStrategy (MSTR) continues its bullish ascent, following a clean Fibonacci extension pattern. After reclaiming key levels and holding above the 0.786–0.886 retracement zones, it now trades around $455 with strength.
📊 Technical Breakdown:
Breakout held above $423 (1.0 Fib)
1.236 Extension: $465.71 (short-term resistance)
1.618 Extension: $534.94 (main target)
Final leg: 2.0 Extension at $603 for full stretch
🟨 Support zone: $353.92
🟩 Trend: Higher highs and strong momentum
🧭 Bias: Bullish continuation unless price loses $402
💡 Macro Note: MSTR trades like a BTC-leveraged equity. Continued BTC strength could accelerate this move. Watch for potential catalysts like ETF flows, earnings, or Fed commentary.
📈 Thesis: As long as MSTR stays above $423, the bullish case toward $534 remains intact with high conviction.
🔔 Disclaimer: This analysis is for educational purposes only. Not financial advice. Always manage risk.
MSTR returning to ATHMSTR returning to ATH. Will MSTR continue or not? MSTR returning to ATH. Will MSTR continue or not?MSTR returning to ATH. Will MSTR continue or not?MSTR returning to ATH. Will MSTR continue or not?MSTR returning to ATH. Will MSTR continue or not?MSTR returning to ATH. Will MSTR continue or not?MSTR returning to ATH. Will MSTR continue or not?
Cup and handleAfter many months, we now have a cup and handle formation. Regardless of Michael Saylor's constant buying, we have a bull flag in play that takes us to $491 USD.
MicroStrategy Bitcoin FOMOIs it time to sell? In percentage terms, MicroStrategy has significantly outperformed its underlying asset, Bitcoin. It's concerning to watch Michael Saylor's FOMO (fear of missing out) into Bitcoin over the past year, as this could ultimately do more harm than good for Bitcoin. MicroStrategy's stock seems massively overvalued compared to its Bitcoin holdings. As the saying goes, "when the tide goes out, we see who is swimming naked."
Over the same period Bitcoin has gained 674%, while MicroStrategy has gained 2831%, making the situation quite clear. When comparing past bull runs, the percentage gains between Bitcoin and MicroStrategy have typically matched more closely, with both assets trending up together. So, what's different this time? Media exposure and FOMO.
Proceed with caution; this is starting to look like a bubble. Is it time to short?

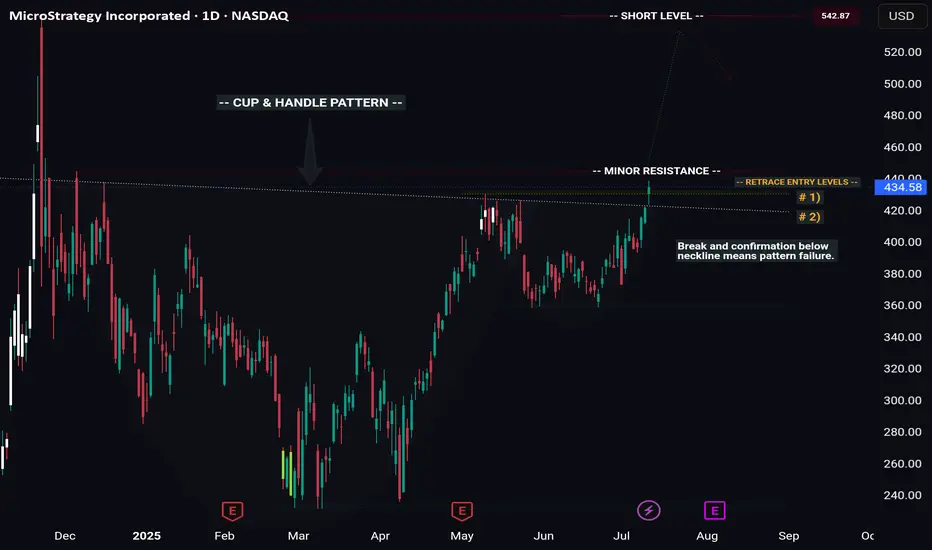
MSTR -- Cup & Handle Breakout // Long & Short SetupsHello Traders!
There is a beautiful cup and handle pattern that has formed on MSTR (Microstrategy).
This pattern offers us a wonderful long setup, as well as a potential short at the all time high.
Pattern Failure: If price both breaks and confirms below the C&P neckline the pattern is void.
Price will likely temporarily pull back from the all time high, giving us our short setup. However you'll want to be in and out quick considering price will likely continue to new highs after pulling back.
I will be swing trading the long setup and likely day trading the short setup.
Have fun and best of luck to everyone on their trading journey!
MSTR - Where it goes only BTC knows📊 MSTR – MicroStrategy Technical & Bitcoin Correlation
Ticker: MSTR | Sector: Bitcoin Treasury Proxy / Enterprise Software
Date: July 26, 2025
Current MSTR Price: ~$405.89
Current Bitcoin Price: ~$118,127
🔍 Chart & Price Structure
Recent Action: MSTR declined from the ~$430–450 range and has consolidated around the $405 level, forming a tight base.
Support Zone: $395–$400 — prior volume cluster, recent dip buyers stepped in.
Weak Resistance: $415–$420 — a shallow supply zone; bigger resistance lies at ~$430.
Volume & Candles: Mixed volume, with small-bodied candles showing indecision near $405. Buyers are attempting to hold.
📈 Bitcoin Outlook & Influence
MicroStrategy remains tethered to Bitcoin’s trajectory. Recent BTC consolidation around $118K closely influences MSTR sentiment.
BTC Projections
From Citi (Jul 25):
Base Case: $135K by year-end
Bull Case: $199K
Bear Case: $64K if equities falter or ETF flows wane
Other Views:
Hashdex sees BTC reaching up to $140K in 2025
Omni Ekonomi
Global X ETF-based models anticipate $200K within 12 months
The Australian
Kiyosaki warns of potential crash despite optimism
These imply a possible 25–70% upside in BTC, which could drive MSTR toward $500–$600+ if holdings are stable.
⏱️ Short-Term Outlook (1–2 Weeks)
✅ Bullish Scenario
Trigger: Hold above support at $400, reclaim $415–$420
Immediate Upside Targets:
First: $430
Break above $430 → $450
Drivers: Bitcoin breaking back above recent highs, ETF inflows, favorable regulatory headlines
❌ Bearish Scenario
Trigger: Break below $395
Downside Targets:
$380 → $360 → $350
Drivers: BTC weakness → below $110K, altcoin rotation, broader equity weakness
🔭 Long-Term Outlook (H2 2025 / beyond)
🚀 Bull Case
If Bitcoin reaches $135K–$200K (Citi bull case, institutional demand, ETF momentum), MSTR could rally alongside to $550–$650.
MicroStrategy’s business fundamentals (data analytics/AI) may contribute optionality beyond BTC.
🐻 Bear Case
If Bitcoin retraces toward $64K or below due to risk-off sentiment or regulatory changes, MSTR could fall back toward $300–$350.
📊 Summary Table
View Trigger Level Targets Bitcoin Scenario Confidence
Short-Term Bull Above $405 and reclaim $415–420 $430 → $450 BTC > $118K and flat-to-up Moderate
Short-Term Bear Below $395 $380 → $360 → $350 BTC dips < $115K Moderate
Long-Term Bull BTC to $135K–$200K $550 → $600+ ETF inflows + adoption acceleration High (if BTC strength)
Long-Term Bear BTC drops below $110K $350 → $300 Sentiment collapse or regulation Moderate
🧠 Conclusion
MicroStrategy’s stock remains inherently tethered to Bitcoin performance. The $395–$405 zone acts as critical support, while a push above $415–$430 could signal renewed upside. Longer-term, BTC strength into the $135K–200K range would propel MSTR toward $600+ levels; a BTC pullback could drag it toward $300 or lower.
Watch Bitcoin flows, ETF updates, and pillar crypto adoption trends—these are likely to dictate MSTR’s next leg.
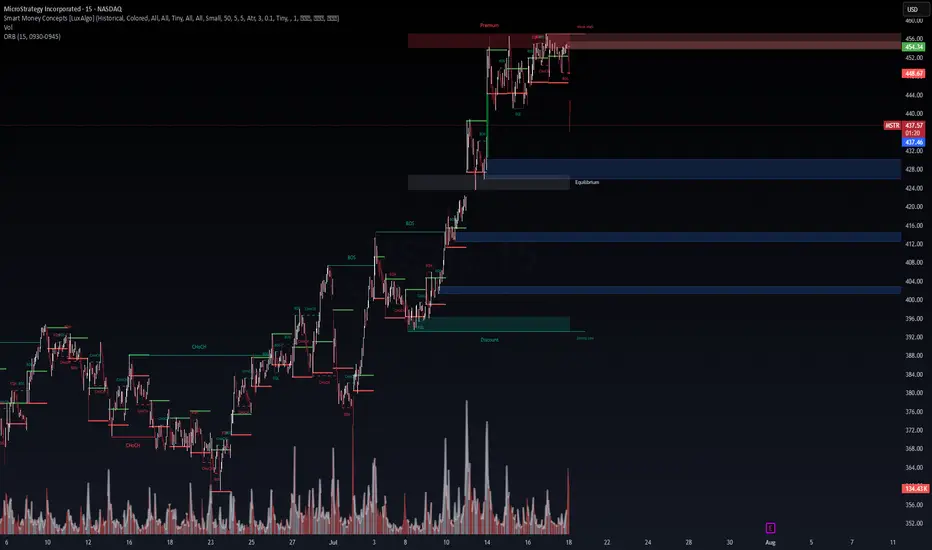
WaverVanir VolanX Protocol – Short Thesis: MSTR🔻 WaverVanir VolanX Protocol – Short Thesis: MSTR
Timeframe: 15-Min | Bias: Bearish | As of: July 18, 2025
Disclaimer: For educational and illustrative purposes only. Not financial advice.
🧠 Thesis Summary:
MicroStrategy (MSTR) has broken market structure at a key premium zone, rejecting from the weekly high, with strong volume confirming distribution. The smart money appears to have exited positions, leaving behind a clear imbalance and liquidity void below.
🔍 1. Smart Money Concepts Breakdown
Premium Zone Rejection (454–456): Price rejected from a premium inefficiency pocket, tagged liquidity, and failed to make a new high.
Internal CHoCH and BOS at Top: Multiple Change of Character (CHoCH) and Break of Structure (BOS) events indicate smart money is offloading.
Fair Value Gap (FVG) Below: Several unmitigated FVGs below (≈412, ≈404, ≈396) serve as magnets for price.
⚠️ 2. Liquidity Sweep Confirmed
Equal Highs Taken Out: Perfect setup for liquidity engineering – retail traders trapped long above 454.
Displacement Candle: Sharp move down post-sweep confirms institutional sell-off.
Volume Spike at Breakdown: Selling volume surged on the red candle through 440 support, indicating urgency from sellers.
🧮 3. ORB Breakdown & VolanX ORB Confluence
Opening Range Breakdown (ORB 15min): ORB low at 448.67 was decisively broken.
Current price: 436.30, firmly below both ORB midpoint and low – signaling bearish continuation.
🧭 4. Probabilistic Price Targets
Target Area Price Level Rationale
TP1 428.00 Equilibrium block
TP2 412.00 Imbalance fill + previous BOS
TP3 396.00 Deep discount zone + Strong Low
Stop Loss: Above 456
Risk-Reward (TP2): 1:3+
Volatility: Elevated (Vol: 129.97K)
🧩 5. Macro & Correlation Risk
Bitcoin Correction Imminent: MSTR is heavily correlated to BTC. Any weakness in crypto adds pressure.
Rate Cut Uncertainty: Hawkish Fed tone or delayed cut could hurt growth narratives and tech multiples.
📉 Summary:
This is a high-probability short setup powered by:
Premium zone rejection
Clear BOS and CHoCH pattern
Strong volume confirmation
ORB breakdown alignment
Liquidity engineering dynamics
VolanX Protocol flags this as a Strategic Short Opportunity targeting liquidity zones below.
🔻 Suggested Trade (Illustrative)
plaintext
Copy
Edit
Entry: 440–436
Stop: 456
Target 1: 428
Target 2: 412
Target 3: 396
#WaverVanir #VolanXProtocol #MSTR #SmartMoneyConcepts #ORB #ShortSetup #LiquiditySweep #DirectionalBias
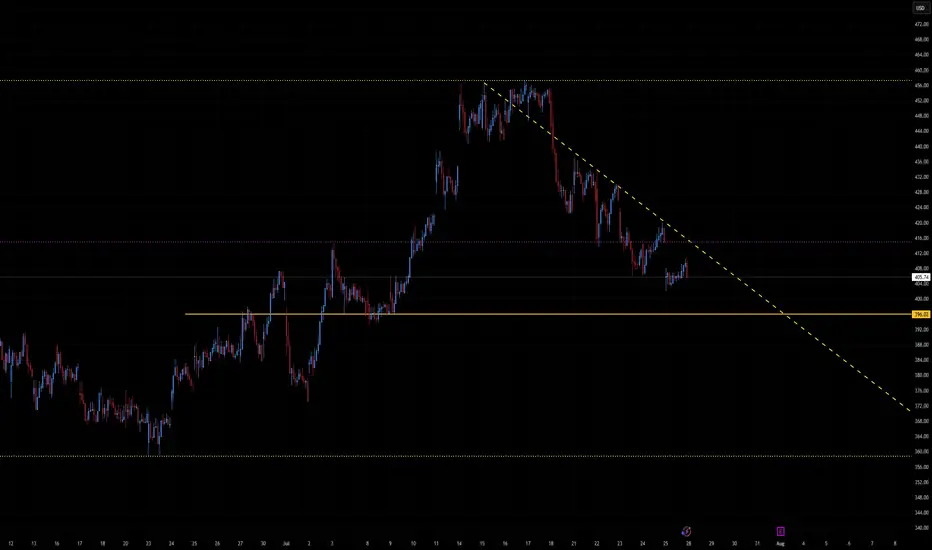
MSTR Bull DivergenceMSTR has seen a fast and sharp correction after rallying nearly 70% into some key levels of resistance , and currently pulling back into the longer term downtrend VWAP, as an attempt to flip the current downtrend.
This zone around $360 is very crucial for me personally, as we are attempting to hold the previous pivot high, and setting a firm low for continuation of the uptrend.
On the hourly timeframe we are finally starting to see some potential absorption here as price continues to make new lows, however the overall strength on the RSI is unable to continue making progress lower.
This is suggesting that the selling pressure may be running low, and MSTR can be due for a bounce.
I have laddered into this current position , and would de-leverage my risk if we start to break the lows as that could be quite a bearish sign, in the meantime, I would like to see some relief after such a harsh downtrend.

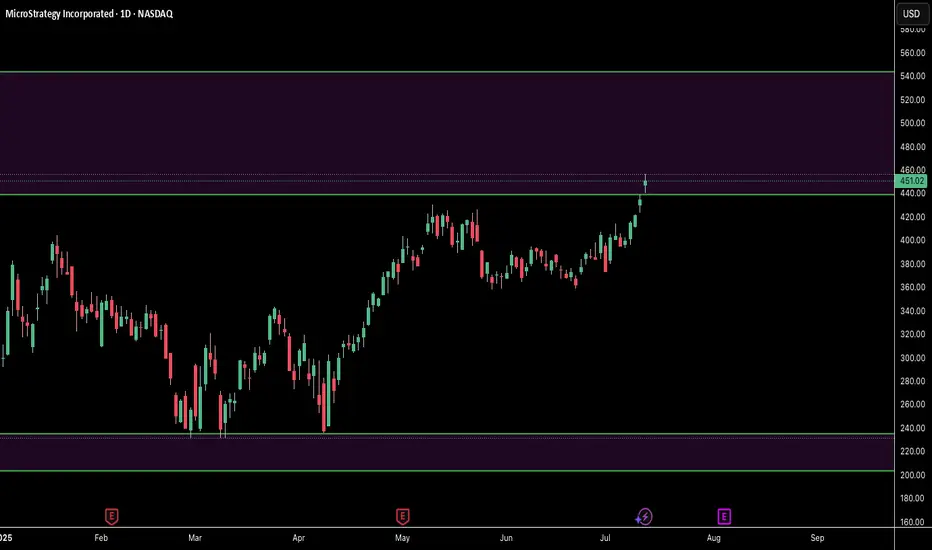
MSTR MICROSTRATEGY As of July 11, 2025, MicroStrategy Incorporated (MSTR) is trading at approximately $434.58 per share on the NASDAQ, showing a strong daily gain of about 3.04% (+$12.84). The stock has experienced significant growth recently, with a 3-month return of around 45% and a 1-year return exceeding 220%.
Key Highlights about MicroStrategy (MSTR):
Industry: Software - Application
Market Cap: Approximately $118.8 billion
Shares Outstanding: About 273 million
Trading Range (Year): Low near $102.40 and high around $543.00
Volume: Active trading with daily volumes around 18 million shares
CEO: Phong Q. Le
Headquarters: Tysons Corner, Virginia, USA
Business: MicroStrategy provides enterprise analytics software and services, including a platform for data visualization, reporting, and analytics. It serves a broad range of industries including finance, retail, technology, and healthcare.
Recent Price Trend
The stock has steadily appreciated from about $255 in February 2025 to over $430 in July 2025.
Recent trading range for July 11 was between $423.70 and $438.70.
After-hours trading shows a slight dip to around $433.25.
Outlook
The next earnings announcement is scheduled for July 31, 2025.
Analysts forecast the stock price could range between $434.58 and $798.13 in 2025, reflecting optimism about the company’s growth prospects and market position.
MicroStrategy’s strong correlation with Bitcoin price movements (due to its large BTC holdings) often influences its stock volatility and performance.
In summary: MicroStrategy is a major player in enterprise analytics software with a highly volatile stock influenced by its Bitcoin exposure and market sentiment. Its stock price has surged strongly in 2025, reflecting both business fundamentals and crypto market dynamics.

MSTR stock has seen a strong rally since JuneSince June, MSTR stock has seen a strong rally—rising from the mid‑$300s to above $430—driven by a few key factors:
Bitcoin’s continued ascent has fueled sentiment. Bitcoin recently hit fresh record highs (above $118K), driven by a weakening dollar and bullish macro trends, which in turn boosted bitcoin-linked equities like MicroStrategy.
In short, MSTR’s rally since June has been largely Bitcoin-driven: a powerful combination of rising crypto prices, ongoing BTC purchases, proactive capital raises, and positive analyst sentiment creating a bullish feedback loop.
Let me know if you'd like a breakdown of Bitcoin’s trend or deeper insight on MSTR’s financing strategy.
$447 will be my next buy TP.
Please, share your thought, like, share and follow me.

$MSTR ONCE IN A LIFETIME FIBONACCICall me CRAZY but my target is 677 🎯
First entry at 236 ALGOS stepped in the GOLDEN ZONE
Looking to RELOAD on LOW RISK HIGH REWARD SETUPS ONLY
I will give my exact entries LIVE all I ask is Drop a "❤️"

MicroStrategy ($MSTR) – Bitcoin Proxy Setting Up AgainMicroStrategy Incorporated NASDAQ:MSTR remains the definitive institutional proxy for Bitcoin exposure, uniquely combining its enterprise software operations with a high-conviction, leveraged Bitcoin accumulation strategy. Its $1.42B BTC purchase in April 2025 further cements this thesis, making MSTR a prime vehicle for traders seeking amplified BTC exposure via equities.
Since our May 5th analysis, MSTR has rallied ~14.61%. We’re now eyeing a re-entry opportunity on a pullback to the $394–$387 zone, aligning with technical support and previous consolidation.
🎯 Bullish targets remain unchanged: $490.00–$500.00, backed by Bitcoin strength and MicroStrategy’s unwavering strategy.
🔁 Re-entry: $394–$387
🟩 Targets: $490–$500
#MSTR #Bitcoin #CryptoStocks #BTC #StockMarket #TechnicalAnalysis #MicroStrategy #HighBeta #CryptoExposure #TradingSetup

Microstrategy: Renewed Upside MicroStrategy has continued to face downward pressure recently but is now showing more decisive signs of an upward move. We still see greater upside potential in the current magenta wave , though we expect the peak to form below resistance at $671.32. Afterward, the bearish wave should complete turquoise wave 2—while still holding above support at $153.49. Wave 3 should then usher in a longer upward phase, with momentum likely to ease only well above the $671.32 level. At the same time, there remains a 33% probability that the stock has already entered this upward phase. In that scenario, turquoise wave alt. 2 would already be complete, and the price would move directly above $671.32 as part of wave alt. 3.
📈 Over 190 precise analyses, clear entry points, and defined Target Zones - that's what we do.
