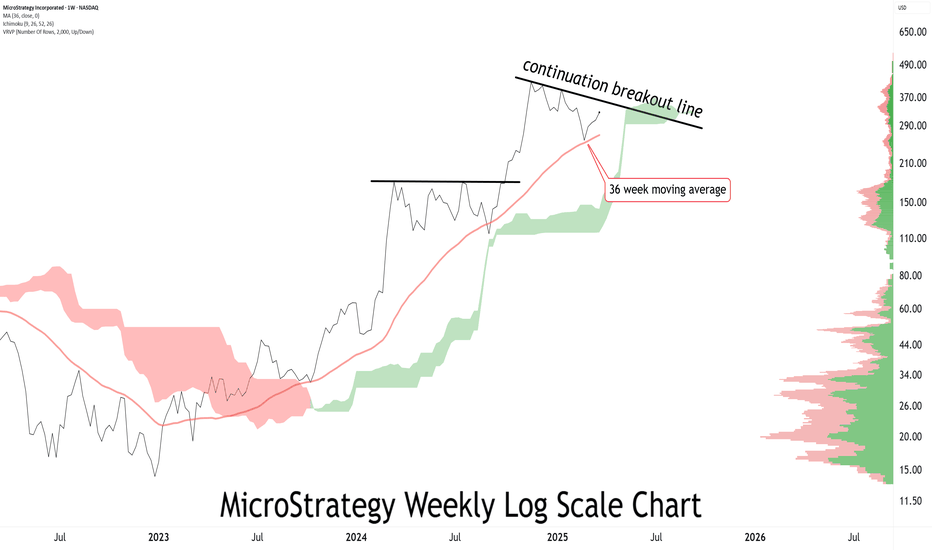
MSTR pennant Consolidating in a pennant just above the prior all-time high, which was $333. Looking like higher lows will prevail, and MSTR searches for that next higher swing high. I’m calling $10k, but there are interim targets obviously. $800 range looks like the next stop.by Shammus01227
2021 Repeat - Distributed TopNo new highs for MSTR in 2025. I'm looking for a repeat fractal of 2021 in 2025.by w.savage110
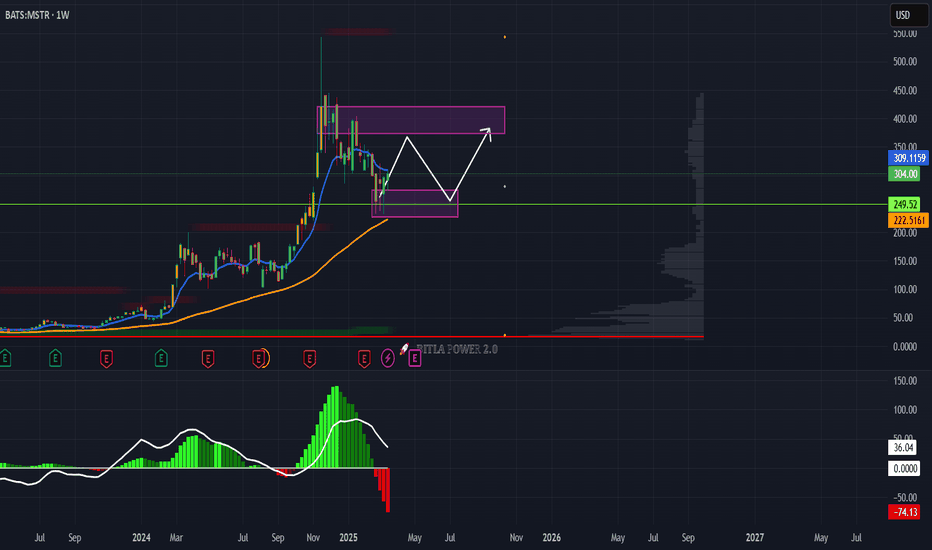
Master AccumulationWyckoff Spring: This setup is like the stock market's own version of a magic trick. It's when the stock price dips into a "zone of support" (the lower purple area) and then springs back up, suggesting that the price might be about to take off. It's the financial equivalent of watching a diving board bend before someone launches themselves into the air. The Phases: Wyckoff Phase A (Preliminary Supply): Here, the stock is like a balloon being filled with air, showing initial resistance before it pops into action. This is where accumulation starts. Wyckoff Phase B (Secondary Test): This phase is like the balloon being squeezed and released repeatedly to see how much pressure it can take. The stock tests the waters, going back to the support and resistance zones. Wyckoff Phase C (Spring): The critical moment, like when the balloon almost touches the ground but doesn't pop. The stock dips into the support zone but then springs back, indicating a potential upward move. Wyckoff Phase D (Upward Movement): Finally, like a balloon released into the sky, the stock price starts to ascend, signaling it's time for the bulls to take over. Zones of Support and Resistance: These are like the invisible walls that the stock price bounces off. The "Zone of Support" (bottom purple area) is where sellers might hesitate, and the "Zone of Resistance" (top purple area) is where buyers might pause. The Five Points on the Chart: Each numbered point represents key moments in the Wyckoff setup, from the initial dip, tests, the spring, and the eventual break upwards. It's like marking the chapters in an epic saga of price movements. The Trend: After the spring, if the stock breaks through the resistance, it's like the hero overcoming the final obstacle, signaling a new trend might be starting. In essence, this chart is like watching a financial ballet, where each move is calculated, each step deliberate, aiming towards a grand finale of price movement. For traders, recognizing these patterns is like having a backstage pass to the market's next big act. Remember, in the stock market, as in life, the spring is the thing that precedes the leap!Longby globulltrader6
Big MOVE Coming ! MSTR Inverse h & break with volume could see 390-400 agin. NASDAQ:MSTR Longby DT6040113
You are not BEARISH enough IMO.Study pump and dumps and you can assume a roadmap like this. NASDAQ:SMCI , Cathie wood stocks etc. Saylor is a conman with a failing underlying business. YOLO'ing CRYPTOCAP:BTC on behalf of shareholders and people loaning him money IS NOT A REAL BUSINESS. It's a PONZI scam. Don't be fooled. Shortby Nevrose249499
$MSTR back to $440 & Potentially Way MoreNASDAQ:MSTR back to 440 After bouncing around a bit between 350 and 400, NASDAQ:MSTR has regained its momentum and a bounce towards $440 appears likely Sustaining below $400 would negate this idea. Current price is $411 in extended hours tradingLongby ridethemwavesUpdated 101015
I like it!I just bought a big position of MSTU (leverage ETF of MSTR). Ascending triangle, price already testing the upper vertex. It might pull back a bit before breakout. SL if it breaks down the triangle.Longby ArturoLUpdated 442
The Case for a 76% drop on MSTR: Norms of fib levels in a trend.If you draw a fib from the high to the low of the 2022 drop in MSTR, you'll see we have now completed all of the fibs of this swing. In this post we're going to take a detailed look at two things; 1 - How a trend typically forms heading into a 4.23 extension. 2 - What typically happens at 4.23 extensions. Everything we cover here will be generic rules for trend development. It's equally valid on bull and bear moves (we'll use examples of both) and it can be used on any timeframe. We're going to stick to big charts for this but these same concepts also scale down to day trading. We are going to look at these specific hypothesis'; 1.27 - 1.61 will produce some sort of pullback. The breaking of 1.61 will produce a steady trend to at least 2.20. Around 2.20 - 2.61 there will be some sort of reaction. The move from 2.61 to 4.23 is very strong. 4.23s can mark the end of major moves. These conditions in MSTR are marked into the chart pic. Let me show you another example on a bear trend to get us started. This was the last bull swing before the 2007-2008 reversal. We're using the topping swing for our fib. We can draw this really early as soon as we see the first possible break. We drop to the 1.61 and then we bounce. It looks like a recovery in real time. Then once the 1.61 is broken we drop quickly to the 2.20. Look closely here. The move to the 2.20 isn't the big red candle. There's a wick. That tells us this was a flash event. Crashed to the support, rapid bear trap. Filling our conditions of the expectations of a 1.61 break and the reaction 2.20. The wick candle pullback went to around 1.61 and then there was capitulation when the 2.61 was broken. We get to the the Final Boss of the fibs. The 4.23. There's a head fake under it and then a recovery back over it. And the 2008 crash is over. Want another one? Here's BB. The pattern expressed over a very long time. Full booms and bust. Saw a lot of these patterns in 2021. Imagine if you could have used the same playbook we can observe on the all time BB chart and used the same set of rules to understand all the key parts of the 2021 trend. That'd be weird. Attached is a pic of the real time 2021 mention of fading the BB rally at the 4.23 (just to show this isn't just perfect fitting after the fact). Let's jump back to another low. Here was the BTC low. Or a bull one. What Happens at 4.23 Fibs? Most of the time when 4.23 fibs are hit there is a large correction or a full blown reversal. Cases of 4.23's breaking without retesting the 1.61 - 1.27 (and that's a crash, big move) are rarer. In the times there is a 4.23 breakout, the following trend is usually exceptional. When looking at big instances of failed 4.23s they're usually found around the middle of a bubble or crash (depending on if it's a bull or bear break). It's much more difficult to show examples of the failed ones without being able to zoom in and out a lot, but you can look for them in places like the Nasdaq bubble, NVDA rally and in failure points of uptrends heading into crashes. Almost invariably, the trend goes into a state of hyper performance if the 4.23 is broken. However, if it is not broken - then we're usually going to ultimately end up spiking out the 1.27 fib. Which round trips most of the move. If MSTR is a 4.23 blow off, it's give up most of the gains of the recent rally. That is inside of the bullish perspective. The correction comes to 1.27. If 1.27 fails, then you can end up with that lifetime BB chart. Action around the 4.23 itself is fraught with caveats when it comes to actionable trading. You have to always have the assumption that if you're wrong you're going to be betting against a punishing trend and you have to be risk cautious and quick to get out / plan new levels. It always has to be remembered if wrong, the fade will fail spectacularly. Further complicating things is we really can't be sure what sort of 4.23 head fake we're going to get. There are times we reverse right at the 4.23. Or come up a bit shy of it. Other times we make a nominal head fake that you could have started betting against almost as soon as it got passed the level and it went nothing but well for you. Then there are the super blow offs. BB was somewhere in the range of 20 - 25% blow off. I remember this well (I'd shorted the 4.23 touch) it only lasted an exceptionally brief amount of time and was ultimately the Mother of all wicks but if I'd be fully exposed to all that price move - wouldn't have mattered. I'd probably have got nailed before it. When it comes to the actual tactical betting on a 4.23 reversal, it's tricky. The core underlying theory of the 4.23 decision is a simple binary one though. Usually when the 4.23 is hit we're going to head into hyper trend conditions. These can be higher (and this is hard to quantify targets for with fibs) or they can be crashes (which we can usually roadmap with the 1.61 - 2.20 - 4.23 thing). Extremely polarizing level here. Either all fib bases bear cases are entirely annulled for the foreseeable future or a drop of about 75% is setting up. The 4.23 pullback/reversal is the far more common outcome. ==== Bonus doom posting: Shortby holeyprofit161626
MSTR starter long off low 370smajor confluences at this level include: - top of daily uptrend channel from september - several large clusters of institutional prints from late november which will need to be tested - 1hr 325 SMA - 1hr liquidity zone will be grabbing shares only at 33% allocation. if price fails this region will add another 33% at low 350s which is the middle of that channel and #13 ranked institutional print since inception. final 33% will be added at low 340s which is a strong local low and the #2 ranked institutional print of all time for MSTR. by soulunveiledUpdated 443
MSTR - Inverse H&S Pattern with Clear Breakout TargetThis is an Inverse Head and Shoulders pattern on MSTR 1-hour Risk/Reward Analysis: Entry Price: $440 Stop Loss: $400 Target Price: $520 Risk/Reward Ratio: 1R:2R Details Clear neckline breakout level around $440 Downside risk zone marked in red (-$40 from entry) Upside potential marked in green (+$80 from entry) The setup presents a favorable technical structure with a strong risk-reward ratio above 1:2.Longby sun_finance11117
MSTR long Going to pick up a $470 call into Feb FVG play trimming at %30 letting runners run and stops a $360Longby Shawn03232
MSTR long Going to pick up a $470 call into Feb FVG play trimming at %30 letting runners run and stops a $360Longby Shawn03230
MSTR following up with the bulls,dont try to counter the market!MSTR has been doing fantastically, so in the mid/short term overview until End of December / End of January - I am forecasting the bull run in crypto to continue, and as follow the bull run would continue with MSTR as well due to the fact as how centered they are with BTC. Entry on market open - Target 1 : 460$ per share Target 2 :560$ per share As always my friends happy trading! P.S. If you have questions or inquiries about one of my existing set-ups or personal questions / 1 on 1 sessions consider joining my channel so you can follow up with me in private!Longby DG55Capital12
MSTR Breakout Alert: What's Next? Dec. 5Technical Analysis & Price Action: * Current Trend: MSTR has shown a sharp breakout above the downtrend channel, signaling bullish momentum. The price is approaching key resistance at $419. * Support Levels: Immediate support lies at $410. Below that, $400 serves as a psychological and technical level. Stronger support is seen near $393. * Resistance Levels: Key resistance stands at $419. A breakout above this level could target $430-$440 in the near term. Liquidity Zones & Order Blocks: * Liquidity Zone: Between $393-$400, where buyers have consistently stepped in to support the price. * Order Block: Around $400-$410, reflecting potential institutional interest. Scalping Gameplan: 1. Entry for Scalping: * Long Entry: Above $419 on high volume, targeting $425-$430. * Short Entry: Below $410, targeting $400 and $393. 2. Stop Loss: For longs, place stops at $410; for shorts, set stops above $415. 3. Exit Targets: For longs, partial profit at $425 and final exit near $430. For shorts, aim for $400 with reassessment at $393. Swing Trade Strategy: * Bullish Setup: Enter above $419 with a close above this level, targeting $430-$440. Set a stop-loss at $410. * Bearish Setup: If the price breaks below $393, consider shorting with a target of $380-$370. Suggestions & Projections: * MSTR's breakout from the descending channel is a strong bullish signal. However, watch for volume confirmation at $419 for further upside. * If the stock fails to hold $410, a pullback to $400-$393 is likely before the next leg up. Thoughts: * Scalpers should focus on the tight range between $410-$419 for quick moves. * Swing traders might wait for a clear breakout above $419 or a retest of $400-$393 for cleaner setups. Disclaimer: This analysis is for educational purposes only and is not financial advice. Always perform your own research and trade responsibly. by BullBearInsights447
MSTR Long on Daily SqueezeMSTR is showing a nicely formed daily squeeze that is waiting to fire to the upside. The breakout has started with the recent rise in BTC price. I expect this to continue to the upside.Longby CryptoWaves1
Bull Flag ReadyThe price has made a bull flag similar to he BTC bull flag. I expect another price spike outside the parallel channel and retracement before recapturing the ATH later. Longby jdgpro642210
$MSTR call verticalI think NASDAQ:MSTR is ready to make a move. I don't think CRYPTOCAP:BTC has much room to go lower than the current level. I bought Dec. 20th $350/$370 call vertical for $11 I will have $9 profit (about 81%) if the stock closed above $370 by expiration. Longby qyu0010
still bullish on the weekly line chart as-of Dec 3rdTo me, it still looks like retesting pink channel is taking place. Not sure if it is some kind of risk-on leading indicator or not, but we'll find out soon!by DollarCostAverage2211
The Time to Stack Was Over a Year AgoEverything I've been eyeing for potential buys has already ripped, so no real opportunities at the moment. However, NASDAQ:TSLA under $300 for a DCA position is still a gift. It's a solid long-term entry if you're looking for one! by Crypto4Craig1
MicroStrategy (MSTR) Stock Price Surged Over 60% in NovemberMicroStrategy (MSTR) Stock Price Surged Over 60% in November According to the MicroStrategy Incorporated (MSTR) stock chart: → At the start of November, the stock price was around $244; → Last Friday, it closed just below $395; → This represents a more than 60% increase in MSTR’s price over the month, making it one of the top performers on the U.S. stock market; → At its peak on 21 November, the stock traded above $520, reflecting a 115% surge in just three weeks. Two key drivers supported the bullish sentiment: 1. Bitcoin holdings by MicroStrategy. According to Benzinga, the company owns nearly 2% of the global Bitcoin supply, a figure projected to rise to 4% by 2023. The current surge in BTC/USD towards $100,000 has significantly increased MicroStrategy's value. Co-founder Michael Saylor stated that the company earns an average of $500 million daily from its Bitcoin investments. 2. Market capitalisation milestones. In November, MicroStrategy's market capitalisation exceeded $100 billion for the first time. On this note, Seeking Alpha highlighted the potential for MicroStrategy's inclusion in the Nasdaq 100 index. This could prompt large funds tracking the index to purchase MSTR shares for their portfolios. Technical analysis of MSTR’s price chart indicates that since mid-September, price fluctuations have formed an ascending channel (marked in blue). The decline from point A to B appears overly steep to be classified as a strict correction within the uptrend, which followed the achievement of extreme overbought conditions (visible on the RSI indicator). While the stock rebounded upwards upon reaching the lower boundary of the channel (point B), the question remains whether the bulls can replicate November’s extraordinary success. Buyers should exercise caution based on bearish price action around psychological levels: → The price failed to hold above $500. → On 22 November, the $450 level acted as resistance. Meanwhile, according to TipRanks: → All 8 surveyed analysts recommend buying MSTR stock. → The average price target for MSTR is $494 within the next 12 months. This article represents the opinion of the Companies operating under the FXOpen brand only. It is not to be construed as an offer, solicitation, or recommendation with respect to products and services provided by the Companies operating under the FXOpen brand, nor is it to be considered financial advice.by FXOpen116
MSTR Descending Channel + Support TestMSTR has been trending down since late last week, but is now coming into an important area of support around $370. There's good potential for bulls to hold here which should lead to a breakout above the channel and a move back up towards $490-$500. If it can't hold $370, that's not great but it would still have potential trendline support below along with previous consolidation from earlier in the month. Bullish for now IMO, but not so much if it breaks below $370. Watching for a trend break in either direction.Longby AdvancedPlaysUpdated 6
$MSTR BULLTRAPThis chart highlights a significant move in MicroStrategy (MSTR) with key levels, patterns, and possible future price action. Here's a detailed analysis for TradingView: Technical Analysis: Historical Price Move (3 Months Ago): Price started at $100 three months ago and surged to a high of $543.60, marking an impressive 429.44% (379.39%) gain. Key Levels: High: $543.60 (marked as 1 on the Fibonacci retracement). Fibonacci Levels: 0.786: $453.87 (currently acting as a key resistance). 0.618: $383.43 (close to the current price; could act as support or resistance depending on price action). 0.5: $333.95 (next major support). 0.382: $284.47 (further downside support). 0.236: $223.25 (demand zone). Recent Events: On 21st November (Thursday), the price hit its peak and began a significant pullback. A Bull Trap occurred, catching buyers off guard as the price reversed sharply after the rally. Market Structure: Multiple BOS (Break of Structure) points indicate bullish momentum earlier, but the pullback suggests a shift in sentiment. Current price action shows consolidation near the 0.618 Fibonacci level, suggesting a decision point for the market. Demand Zones: Near $100: Strong demand zone where the rally initiated. Around $223-$284: Potential zones of interest for buyers if the price retraces further. Trade Ideas: Bullish Scenario: If the price holds above the 0.618 level ($383.43) and breaks above $453.87 (0.786 level), it could retest the highs near $543.60. Bearish Scenario: A breakdown below $383.43 could trigger a move towards $333.95 or even $284.47, aligning with the Fibonacci and previous demand zones. Key Considerations: Watch for volume spikes to confirm direction. Monitor macroeconomic events or Bitcoin movements (as MicroStrategy holds significant Bitcoin reserves).Shortby ProWolfTrader_89116
MSTR PL dot push and refreshThe essential element of the Drummond Geometry is the PL dot (Point and Line). This dot is a short term moving average that is calculated as the average of the last three candles averages of High, Low and Close. In Drumond Geometry, the open plays no role. PL dot = Avg(Avg(H1,L1,C1) + Avg(H2,L2,C2) + Avg(H3,L3,C3)) The key difference with other moving averages is the fact that in the Drummond Geometry, the result of the above calculation is shifted by one bar in the future, thus one knows in advance where the PL dot is for the upcoming bar. The PL dot is very responsive. When there is a trend, then the PL dot is sloping in the diretion of the trend (up or down) whereas if the PL dot is horizontal we have a congestion condition in the market. The PL dot offen sits at the top or the bottom of the bar, pushing the price up or down in a so called "PL dot push". In the MSTR weekly view, one can see how the PL dot was support since September and was pushing the price up until now. The trade one could have taken is to long around the PL dot and put a stop loss couple of point below. The target would be first the Envelope Top and if the PL dot had "sufficient strength" then the final target would have been in the Area 6 (Exhaust zone). One can see how the exhaust zone acted as resistance and made price go back to the PL dot for a "PL dot refresh". Thus when price strays away from the Pl dot, the second pattern to trade would be the "PL dot refresh". Imagine the dot as container of energy which waxes and wanes depending on the curcomstances. So when price travels away from the PL dot, it tends to "refresh" itself and confir wheter there is still energy for the move to continue.Longby JordanMT1