Should You Follow Michael Saylor’s BTC Moves? Let’s Think TwiceIn the crypto world, Michael Saylor is a household name. The co-founder of MicroStrategy has become one of Bitcoin’s most vocal advocates, with his company accumulating a massive Bitcoin treasury. Many view his purchases as a signal of confidence, believing that if someone with his track record is buying, it must be the right move.
But is it wise to follow his lead without question?
Let’s take a closer look at the full story and consider why doing your homework is essential before jumping in headfirst.
The Rise of Michael Saylor: Bitcoin’s Biggest Cheerleader
Saylor didn’t become a prominent figure in the crypto space until 2020, when MicroStrategy announced its first Bitcoin purchase.
Since then, he has positioned himself as a thought leader in the industry, frequently championing Bitcoin as the ultimate store of value.
However, Saylor’s newfound reputation as a financial visionary often overshadows his earlier history—a history that’s worth examining.
A Look Back: The Dot-Com Bubble and MicroStrategy’s Decline
In the late 1990s, MicroStrategy rode the wave of the dot-com boom, with its stock soaring to impressive heights. But like many other tech companies of the era, it faced a harsh reality check when the bubble burst.
MicroStrategy’s stock plummeted, and for the better part of two decades, it languished near its lows.
During this period, Michael Saylor’s reputation as a business genius took a backseat. It wasn’t until Bitcoin’s meteoric rise—and MicroStrategy’s pivot to buying and holding Bitcoin—that Saylor regained the spotlight.
Is It Genius or Just Timing?
Here’s the question we need to ask: Is Michael Saylor’s success in Bitcoin a result of brilliant foresight, or was he simply in the right place at the right time?
Bitcoin’s Performance: The timing of MicroStrategy’s Bitcoin purchases coincided with a strong bull run in the market. This rise in Bitcoin’s value undoubtedly contributed to Saylor’s renewed status as a financial savant.
Reputation Rebound: It’s easy to appear “smart” when your investments are soaring. But how much of that success is due to skill, and how much is due to external factors like market trends?
The Danger of Blindly Following Big Names
While it’s tempting to follow someone like Michael Saylor, assuming he has insider knowledge or an unbeatable strategy, history teaches us a valuable lesson:
Even Experts Can Be Wrong: Many celebrated investors have made costly mistakes, especially when riding trends. The dot-com bubble is a prime example of how quickly fortunes can change.
Market Conditions Are Key: What worked for Saylor may not work for everyone, especially as market conditions evolve. Bitcoin’s past performance is no guarantee of future results.
The Importance of Doing Your Own Homework
Instead of blindly following big names, take the time to develop your own understanding of the market. Consider:
Risk Tolerance: Are you prepared for the volatility that comes with Bitcoin and other cryptocurrencies?
Market Fundamentals: Do you understand the underlying factors driving the asset’s value?
Your Strategy: Does buying Bitcoin (or any other asset) align with your financial goals and investment timeline?
Final Thoughts
Michael Saylor’s success with Bitcoin is undeniably impressive, but it’s essential to view his story in context. His rise to prominence as a Bitcoin advocate came after years of MicroStrategy’s struggles, and much of his newfound fame coincided with Bitcoin’s broader bull market.
Rather than simply mimicking his moves, take a step back and assess your own strategy. Remember, the smartest investors aren’t those who blindly follow the crowd—they’re the ones who do their research, weigh the risks, and make informed decisions.
In trading and investing, doing your homework is the real key to success. Don’t let someone else’s narrative cloud your judgment.
MSTRD trade ideas

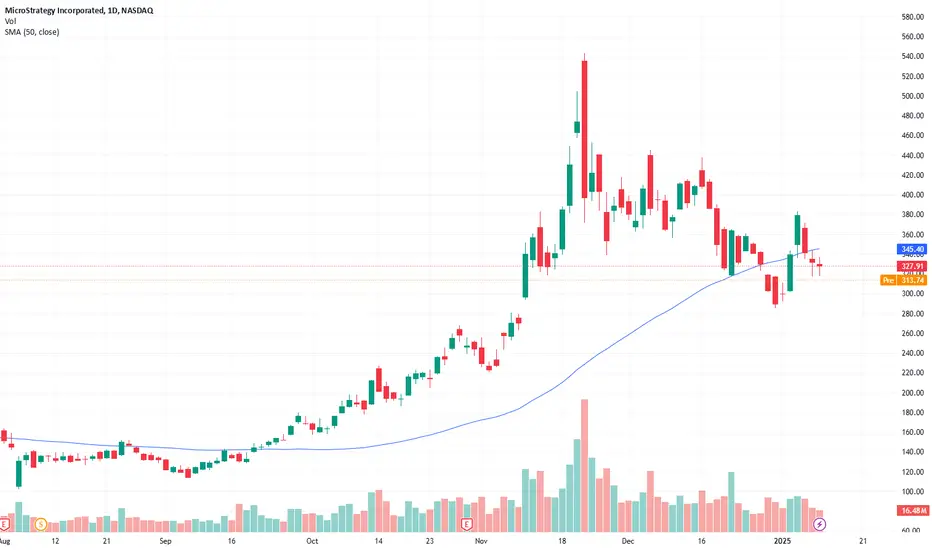
MSTR - Potential RunnerWe got a nice recent 50MA reclaim on MSTR and trading out of the falling wedge makes me think this one can get quite bullish again.
Other influential factors include things like Bitcoin over 100k again, a president that is pro-crypto, a government that is growing in debt, etc.

MR, mstrLots of hype in the crypto space, im just trying to make a little jingle. doesn't bother me if its up or down. This elliot wave ABCDE pattern is making me want to bet against the hype. A to C if u copy the line and move it below over B to D it lines up perfect. Each touch of the lines is 7 days. Monday will be 7 days from D to E. Fib retracement from previous high, has a .764% coming in at around 407$. Tag of the upper line on Monday also lines up right around 407$. I give this pattern a high probability of playing out. Should it play out, the targets would be first the lower bound and then 210-250 range.. Risk, if the hype is validated and it blows through the upper bound it will likely either consolidate on top or come back to retest. So, if it blows through the line and hangs out, exit the trade. On a pattern like this you do not want to see it trading very long on top of the trendline if at all.. Entry, it should go all the way to 407$. Looking to enter 402$-406$ short. Lets see how she rides ;)

Major Price Movement Incoming for MSTR!Signalist has detected a precise pattern in NASDAQ:MSTR trading activity, signaling that a substantial price movement is imminent. This isn’t a random fluctuation—it’s a carefully analyzed precursor to a significant market event.
📅 What to Expect:
⌛ Timeline: Anticipate a major move within the next 1 to 4 upcoming 3-hour candles.
📈 Monitor the Charts: Keep an eye on MSTR’s price action over the next few candles.
Prepare Your Strategy: Whether you’re bullish or bearish, have your trading plan ready to capitalize on the move.

MSTR - 2 months FALLING WEDGE══════════════════════════════
Since 2014, my markets approach is to spot
trading opportunities based solely on the
development of
CLASSICAL CHART PATTERNS
🤝Let’s learn and grow together 🤝
══════════════════════════════
Hello Traders ✌
After a careful consideration I came to the conclusion that:
- it is crucial to be quick in alerting you with all the opportunities I spot and often I don't post a good pattern because I don't have the opportunity to write down a proper didactical comment;
- since my parameters to identify a Classical Pattern and its scenario are very well defined, many of my comments were and would be redundant;
- the information that I think is important is very simple and can easily be understood just by looking at charts;
For these reasons and hoping to give you a better help, I decided to write comments only when something very specific or interesting shows up, otherwise all the information is shown on the chart.
Thank you all for your support
🔎🔎🔎 ALWAYS REMEMBER
"A pattern IS NOT a Pattern until the breakout is completed. Before that moment it is just a bunch of colorful candlesticks on a chart of your watchlist"
═════════════════════════════
⚠ DISCLAIMER ⚠
Breakout Area, Target, Levels, each line drawn on this chart and any other content represent just The Art Of Charting’s personal opinion and it is posted purely for educational purposes. Therefore it must not be taken as a direct or indirect investing recommendations or advices. Entry Point, Initial Stop Loss and Targets depend on your personal and unique Trading Plan Tactics and Money Management rules, Any action taken upon these information is at your own risk.
═════════════════════════════

Bitcoin's next leg up to fuel an MSTR rallyI believe there is a good chance bitcoin puts in its next leg up. If so, it has the potential to pull MSTR up at an even greater rate. My main target is $650, but I do believe it'll surpass that.

383 Daily / 283.30 WeeklyThis channel is not providing individualized trading or investment advice, nor is it a banking service, brokerage service, trading service, investment service or money management
service.
It is just an educated guess.

Short Idea MSTRA short and simple short idea for MSTR:
We wait for the price to touch the gap without closing it. The recent interim highs, where sell-offs occurred, allow us to set a tight stop.
We then expect prices to fall significantly into the range of the take profit shown.

A once-in-a-century opportunity to short MSTRA once-in-a-century opportunity to short MSTR.If it drops below 285, you should be all in. If mstz is used. may even be financially free. Good luck.

MSTR(Assuming Bitcoin breaks up...)
From a TA perspective only: i can see a setup where there is a breakout rally back towards 450$, where, following correction may lead to another, shallower inverse shoulder of a bigger pattern and a return to the ATH, completing the falling wedge pattern.
Not financial Advice.
filb.

Here is my roadmap for $MSTR scam.MMs are keeping the circus going just a bit longer but do not be mistaken, your time is running out on this ponzi scam. This is how I see it playing out over the next couple months.
The world will be a better place when this goes to zero.

Opening (IRA): MSTR 2x225/2x240/460/490 Iron Condor... for a 7.00 credit.
Comments: IV remains high here at 112.4%. Going "double double" (put spread half the width of the call spread, but 2 x the number of contracts) to accommodate skew. Earnings are on 2/4, so will probably want to get out before then.
Metrics:
Max Profit: 7.00
Buying Power Effect: 23.00
ROC at Max: 30.43%
50% Max: 3.50
ROC at 50% Max: 15.22%
Will generally look to take profit at 50% max, roll in untested side on side test to about half the delta of the tested side. Given earnings on the horizon, will naturally just money/take/run for less if presented with the opportunity.

I am scare to take this trade .... must be the one This channel is not providing individualized trading or investment advice, nor is it a banking service, brokerage service, trading service, investment service or money management
service.
It is just an educated guess.


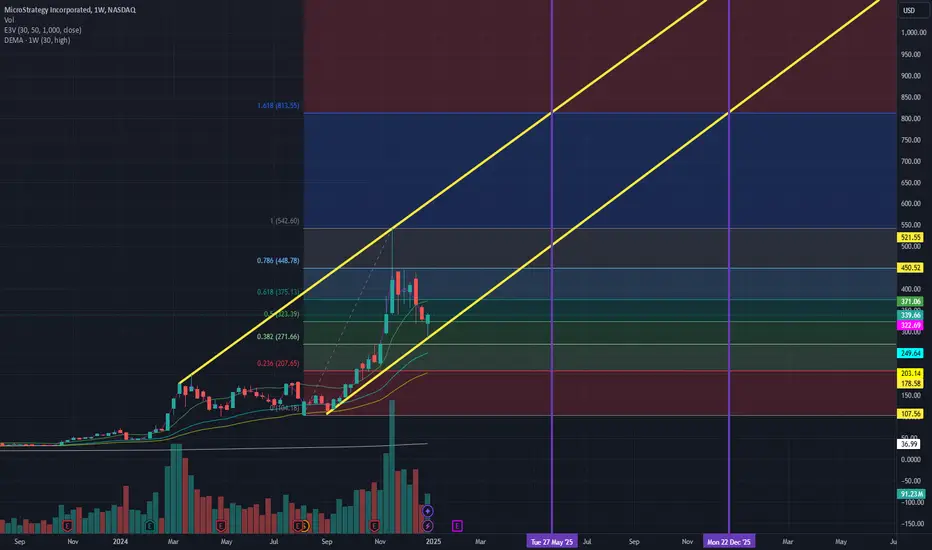
$MSTR Continues to FLY to $800. if BTC breaks 100K, CLEAR SKIESThere seems to be the idea that BTC held strong at $92K. We saw a bounce to FWB:98K and MSTR bounced off a similar key level.
Based on this trend, as well as the continued crypto regulation news, we can potentially see MSTR being the next 3x runner in the year IF BTC breaks 100K once again, suggesting further new highs.
This trend would suggest that we can see MSTR $800 by as early as MAY. or some potential consodilation during the summer, with a final blowout in late DEC 2025.
What do you think is the new BTC / MSTR target?
MSTR: Bullish Momentum Faces Key Resistance🔥 LucanInvstor's Strategy:
🩸 Short: Below $335.13, targeting $320 and $300. The MACD shows weakening momentum, and the price is approaching key resistance at $399.88.
🩸 Long: Above $363.01, aiming for $399.88 and $410. A breakout above this resistance could extend the bullish trend, but the weakening MACD signals uncertainty.
🔥 LucanInvstor's Commands:
🩸 Resistance: $399.88 — A key resistance level; if broken, the bullish trend may continue.
🩸 Support: $335.13 — A critical support level; a breakdown below this could lead to further declines.
MicroStrategy's bullish momentum has paused near resistance. If the price holds above key support levels, a breakout could occur. However, the MACD indicates weakening bullish strength.
👑 "In moments of uncertainty, discipline and precision will guide your actions."

Opening (IRA): MSTR 180/210/410/440 Iron Condor... for a 6.03 credit.
Comments: High IV at 95.8%. Here, going delta neutral, 1/10th the price of the underlying for my wing width, and setting up my short option strikes at the 16 delta on both sides.
Metrics:
Max Profit: 6.03
Buying Power Effect: 23.97
ROC at Max: 25.16%
50% Max: 3.02
ROC at 50% Max: 12.58%
Will generally look to take profit at 50% max; roll in untested side on side test.

MSTR - Can I BUY now?NASDAQ:MSTR seems to have found a base at my ideal target for w4. (Would have been great if I managed to publish it ;/)
To keep this brief, I like this area as a base before finding higher.
Goo dLuck!

Major Price Movement Incoming for MSTR!Signalist has detected a precise pattern in NASDAQ:MSTR trading activity, signaling that a substantial price movement is imminent. This isn’t a random fluctuation—it’s a carefully analyzed precursor to a significant market event.
📅 What to Expect:
⌛ Timeline: Anticipate a major move within the next 1 to 4 upcoming 3-hour candles.
📈 Monitor the Charts: Keep an eye on MSTR’s price action over the next few candles.
Prepare Your Strategy: Whether you’re bullish or bearish, have your trading plan ready to capitalize on the move.

Why MicroStrategy Will FailIf you listen to Michael Saylor, watch what he is doing with his financial engineering, and "learn about Bitcoin" it seems incredibly obvious that... MicroStrategy WILL NOT fail . At least, that is what I have been told by those that stand to gain massively from Bitcoin's price appreciation. It makes a lot of sense: corner the market of Bitcoin supply => force the price into "discovery" mode and everyone that believed in him and Bitcoin will be rich to the point they feel they deserve for being so prescient with their wisdom.
The history of finance does not bode well for such absolute certainty...
I began shorting Microstrategy with Puts over a year ago. "Being early and being wrong are often indistinguishable in trading/investing." I've lost money. But that did not dissuade me from calling BS on this scheme.
Up until November 22, 2024 it had been a small trade that had not worked out so far. But on that day Saylor gave a CNBC interview (highly recommend looking it up) where he talked about their "core business", their "Bitcoin reactor", "selling volatility", and lots of complex financial jargon. To some, this might come across as brilliance. To me, having been in markets for a long time and studying their history it was patently obvious he was doing the classic, "if you can't amaze with brilliance then dazzle with bullshit" tactic. This was not a scam, nor a ponzi, nor a fraud... in absolute terms. We don't actually have a word for it. But it needs a derogatory term because people are going to lose money buying into it.
I don't believe in karma. What I believe is that people cannot help be themselves and repeat their character flaws and patterns. This is not the first time Saylor has engaged in "financial engineering". Over 20 years ago MSTR (same company, same symbol) got caught by the SEC for doing much the same thing a Enron in their accounting practices. They were levied a big fine and the stock dropped -60% in a single day. Roughly two weeks later... the entire dot-com bubble imploded. Was MSTR the catalyst for this collapse? Unknown. But it certainly did not help keep the bubble going...
Once again Saylor is exploiting the financial system. Or as gamers would call it; "clever use of game mechanics." There is nothing illegal about what he is doing (that is apparent). It's all out in the open. But it's leverage. Lots of leverage. MSTR ran out of simple debt and have found other ways to make cash to buy Bitcoin. Every week they keep "buying the top" as cheerleaders for this asset; Bitcoin. Trying to get others to join in their crusade to... I guess get it to $1 million now. Still valuing it in fiat terms while claiming to be changing finance (do they still want to do that anymore with Blackrock being their best backer? Unknown.
I left all my Bitcoin Maxi chats as part of a New Year's Resolution to argue less with people on the Internet after 2024. When I left I was still defending my short while they were eagerly buying the dip. With all investments... time will tell.
The Trade
I have been purchasing Puts in different traunches with different strikes going out all the way to 2027. These long term Puts have their theta offset by selling shorter duration options to keep myself theta positive. This has been great over the last 2 months with increased IV. During the recent drop to $285 I actually found myself delta positive for a day. I wanted to get "more short" and added as much risk as I felt comfortable on the last push up to $380. Now delta negative/theta positive.
Where I stop out: $390 is a key volume profile level topside. If price gets back above there I consider myself wrong... for now... and start to unwind risk or hedge more
How I manage: I will continue to manage my delta/theta as long as IV makes it fun while always trying to stay negative. Buy long dated puts on pops up; Sell some Puts on every move down. The goal is for MSTR's debt to start getting called this year and they be forced to make some hard choices. This may require Bitcoin and/or the equities market to collapse in 1-2 years. If so; MSTR will be hurt tremendously.

Long MSTR: Watch for Key Breakouts Next Week
- Key Insights: MicroStrategy's stock remains sensitive to Bitcoin's price
fluctuations, with a current sentiment hinting at a potential recovery if
Bitcoin stabilizes. A breakout above $338.76 could signal a bullish trend,
while drops below $316.93 could lead to further losses. Anticipation
surrounds a crucial shareholder vote on January 21st, which could
significantly affect future stock performance by allowing more Bitcoin
acquisitions. Investors should monitor Bitcoin's market dynamics and perform
thorough risk assessments considering the stock's volatility.
- Price Targets: Next week targets: T1: $340, T2: $360; Stop levels: S1:
$316.93, S2: $310.
- Recent Performance: MSTR has seen significant moves, declining approximately
40% from recent highs and reflecting investor concerns about its
cryptocurrency-heavy strategy. The fluctuations in Bitcoin's valuation have
directly impacted MSTR's stock performance, leading to increased volatility
in trading activity.
- Expert Analysis: Analysts maintain a cautiously optimistic outlook for MSTR,
balancing skepticism over its substantial Bitcoin emphasis with the
potential for positive returns if Bitcoin prices rebound. Market sentiment
nudges towards bullish, influenced by expected increases in Bitcoin value
amidst investor speculation. The critical resistance and support levels will
likely drive short-term trading decisions.
- News Impact: The upcoming shareholder vote on January 21st is expected to be a
weighty factor, potentially enabling MicroStrategy to pursue more aggressive
Bitcoin acquisition strategies. The company has successfully raised capital
through convertible debt, signaling a continued commitment to its ambitious
investment plan amid scrutiny about volatility and regulatory changes in the
cryptocurrency market. Investors are urged to assess risks associated with
MicroStrategy's approach while tracking Bitcoin's performance closely.
MSTR keeps digging its own grave.Well, since my last post about MSTR, the trolls have been having a field day.
What a blast! §8-)
I stand by my previous post about MSTR because, honestly, I see no future in this SCAM.
Especially now that Bitcoin is teetering on the edge of a deep pullback (see my last post about Bitcoin for more).
So, what do we have here?
MSTR broke through the centerline and tried to claw its way back up.
Then came the decisive breakdown.
An open and close below the centerline paved the way for a trip south.
Thanks to more hype and yadda-yadda reports, we saw a pullback up to the centerline — which, by the way, was perfectly in line with the trading framework of forks.
But after that failed pullback, the price went the other way, and MSTR has been digging its way further south.
For those who took profits at the 1/4 line, you can now look forward to PTG2 with confidence.
Or, if you’re convinced that MSTR is headed for a reckoning with regulators in the medium term (although that seems doubtful since they all seem to be napping...), you might consider doubling down on your short position.
Wishing everyone a profitable and exciting new trading week!

MSTR: Bearish Momentum with Potential for Pullback🔥 Potential Price Targets:
🩸 Near-term Goal: $327.91 (1-2 months)
🩸 Long-term Goal: $375.00 (3-4 months)
🔥 LucanInvstor's Strategy:
🩸 Short: Below $327.91, targeting $320 and $300. The MACD is negative, and the price is below the 9-day EMA, signaling further downside in the short term.
🩸 Long: Above $375.00, targeting $380 and $390. A breakout above resistance could resume the bullish trend, supported by the price being above the 200-day EMA.
🔥 LucanInvstor's Commands:
🩸 Resistance: $375.00 — A key resistance level; a break above this could trigger further upside.
🩸 Support: $327.91 — A critical support level; a breakdown below this could lead to a pullback.
MicroStrategy faces bearish momentum in the short term, confirmed by the MACD. A breakdown below support may lead to further declines, while a breakout above resistance could drive the stock higher in the longer term.
👑 "Strategize with purpose and precision."
