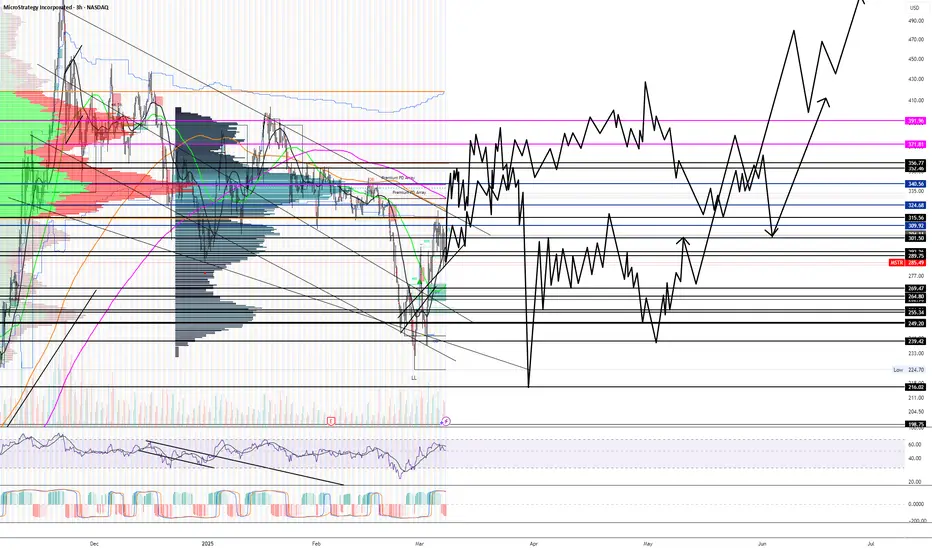
MicroStrategy (MSTR) – Lining Up for a Major Move?McroStrategy is looking real right on the higher time frame 👀
Price is currently hovering around $317, sitting beautifully between key zones:
Previous High: $543 — this area has yet to be retested. I’m patiently watching for price to gravitate back toward that zone. The momentum is building.
Buy Zone (Liquidity Pocket): $231 – $220
This zone was tapped with precision and instantly rejected — classic smart money footprint. If price revisits this range again, I'm looking for a strong reaction or a W formation before continuation.
Macro Support: $102 — Long-term breakout zone, marked as a final floor in case of macro correction.
💡 Structure is King
This is what I mean when I say let the candles breathe. The market is compressing after a strong impulse — exactly what you want to see before continuation.
If you're into swing trading like I am, this kind of setup is gold — especially with a bullish macro bias still intact.
MSTRD trade ideas

MicroStrategy (MSTR) – Ichimoku Cloud Reclaim SetupMSTR needs a daily close above $318 to officially reclaim the Ichimoku Cloud on the 1D chart. This would flip the bias back bullish and invalidate the recent mid-cloud rejection seen near the $315–317 zone.
Why $318?
That’s the top of the current Kumo (Senkou Span B = $317.96)
A close above confirms a full cloud reclaim, shifting trend momentum
MACD is turning bullish, and RSI is recovering above 50 — signs of building strength
🔍 What I'm Watching:
✅ Daily close > $318
✅ Confirmed MACD crossover (on Ultimate MACD)
✅ RSI holds above 50
🎯 Trade Plan (if confirmed):
Long bias above $318
Initial target zone: $340–$355
Risk: Daily close back below Tenkan ($311)

MSTR In-complete Cup @ Handle Pattern Forming Early timing and can be invalidated.
My Crystal Ball got smashed of late.
My advice is to stay away and preserve Capital = Cash.
As always, please get a few outside Expert's Advice before taking Trade or Investment Decisions.
Should you appreciate my Chart Studies, Smash That Rocket Boost Button. It's Just a Click away.
Regards Graham.

MSTR Fake pump....watch outBTC is spiked a little bit and the S&P is down. There's a mini pull back going on and we should expect BTC to drop a bit soon, which will take down MSTR and pump MSTZ. All the signs and trends are there.
Best of luck and always do your own due diligence!

MSTR Double TopDouble top and multiple rejections in this 310-313 zone. Looking for a retest of 287 for the next key pivot point, and from that inflection watch PA to see if we test the critical level of 273 (lots of trading volume and buyer/seller conflict), or we can bounce off that zone forming a double bottom heading back to the 343 retest.. interested to see what transpires!

StrategyWe have what looks like a breakout from short-term overhead on both the price, and the on balance volume. Look back in the charts, and you can see both price and OBV retrace prior resistance, so breaking up from that retrace is great signal. Now, strategy needs to climb back above $333, and then all-time highs are up next.

MSTR is close to the cliff.....elevator down to high 200sI've seen this movie before and been following MSTR / BTC for a while. The trends and profit taking don't lie. Stay close to BTC and MSTR, once this starts dipping it will drop hard! Good time to look into MSTZ!!! I've profited sooo many times from this trend and now so can you.
Best of luck and always do your own due diligence!

$350 By March 21st? IshHere are my two possible price paths that I took from two other similar cycles.
This mixed with bitcoins price path in the coming weeks, I think my take profit level is $350 and then $370 at most. Idk why but the start of Q2 (April 1st) might be bumping to.
#Mstr is above green sky (strong bullish zone)#Mstr is now above green sky (Strong bullish zone). It is expected to cross 350 and 400 level.
Note: This is not a buy or sell call, trade at your own will. Use stop loss as per your strategy.

If we take out the high of yesterday we are moving up untill 11This channel is not providing individualized trading or investment advice, nor is it a banking service, brokerage service, trading service, investment service or money management service.

MSTR Short ScalpI think the equities pump will mean revert and pull down crypto/MSTR with it. It's at a critical pitchfork trendline that's acted as resistance before. Risking 0.5%

Saylor's Liquidation Risk (As per the 8-K Disclosure) So today I briefly skimmed through the MSTR 8-K and then dumped the whole thing into a LLM. Asked a series of questions. Here's a write up of the end results.
MicroStrategy's Bitcoin Gambit: Riding the Bull, Bracing for the Abyss? A Deep Dive Analysis
Introduction: The Boldest Bet on the Block(chain)
In the annals of corporate strategy, few moves have been as audacious or as polarizing as MicroStrategy Incorporated's pivot to become a de facto Bitcoin development company, acquiring staggering amounts of the digital asset for its corporate treasury. Spearheaded by its charismatic and outspoken Executive Chairman, Michael Saylor, the company has leveraged its balance sheet to the hilt, issuing billions in debt and specialized equity instruments to acquire, as of March 31, 2025, a colossal 528,185 bitcoins. This strategy, predicated on the belief in Bitcoin as a superior store of value and a hedge against monetary inflation, has transformed MicroStrategy from a relatively staid enterprise software company into a high-octane proxy for Bitcoin itself, beloved by crypto bulls and eyed with deep skepticism by traditional financial analysts.
While the upside during Bitcoin bull runs has been spectacular for MSTR's stock price, the strategy's reliance on massive leverage and continuous access to capital markets introduces profound risks. This essay delves into the mechanics of MicroStrategy's Bitcoin accumulation, dissects the specific risks acknowledged by the company itself (particularly those that could necessitate selling Bitcoin), stress-tests the strategy under adverse hypothetical market conditions, and assesses the validity of the critique that this high-wire act is fundamentally suited only for "fair weather" markets. Is MicroStrategy building a futuristic financial fortress, or is it, as critics contend, one of the ships most likely to sink when the inevitable market storms arrive?
The Grand Strategy: All-In on Digital Gold
MicroStrategy's commitment to Bitcoin is not a casual allocation; it's the central pillar of its go-forward identity. The stated rationale revolves around the perceived unique properties of Bitcoin: its finite supply, decentralized nature, and potential to serve as a global, non-sovereign store of value superior to cash or traditional assets in an era of unprecedented monetary expansion. The acquisition has been relentless. The company's holdings, purchased at an aggregate cost of $35.63 billion (average price $67,458 per BTC), represent arguably the largest corporate Bitcoin treasury globally. This isn't just diversification; it's a fundamental re-imagining of corporate finance, positioning MicroStrategy as intrinsically linked to Bitcoin's future trajectory.
Fueling the Rocket: The Complex Capital Structure & Funding Engine
This vast accumulation wasn't funded by surplus cash from MicroStrategy's legacy software business. Instead, it has been financed through a complex and ever-expanding web of capital market activities:
Convertible Senior Notes: MicroStrategy has become a serial issuer of convertible notes, instruments that function as debt but offer holders the option to convert into the company's class A common stock (MSTR) under certain conditions. As of March 31, 2025, the company had a staggering $8.21 billion in aggregate principal amount outstanding across six different series, with maturities stretching from 2028 to 2032. These notes carry varying interest rates (from 0% to 2.25%) and conversion prices. While the principal isn't due for several years, they impose ongoing cash interest expenses (totaling approximately $34.6 million annually) and represent a massive future liability. Crucially, holders possess "put options" allowing them to demand cash repurchase years before maturity (e.g., $1.01B in Sept 2027, $2.0B in March 2028, $3.0B in June 2028, etc.), creating significant future liquidity hurdles.
Perpetual Preferred Stock: Adding another layer of complexity and leverage, MicroStrategy issued two series of perpetual preferred stock: the 8.00% Series A Perpetual Strike Preferred Stock (STRK) and the 10.00% Series A Perpetual Strife Preferred Stock (STRF). As of March 31, 2025, these represented $1.615 billion in aggregate notional value.] The STRK stock offers an 8% cumulative dividend, payable quarterly in cash or, at the company's election (subject to limits), in MSTR common stock. It is also convertible into MSTR common stock at the holder's option.
The STRF stock, ranking senior to STRK and common stock, carries a higher 10% cumulative dividend rate, payable solely in cash. It also features escalating "Compounded STRF Dividend Rates" (up to 18%) if cash dividends are deferred, creating immense pressure to pay. It even includes a provision requiring "commercially reasonable efforts" to sell stock to cover deferred dividends.] Together, these preferred stocks mandate substantial annual cash dividend payments (approximately $146.2 million).
This structure is a finely tuned machine, optimized for a world where Bitcoin prices rise and MicroStrategy's stock follows suit, allowing for continuous capital generation. The danger lies in the machine seizing up if these conditions reverse.
Reading the Fine Print: MSTR's Acknowledged Forced-Sale Risks
MicroStrategy's own disclosures (specifically the Form 8-K dated April 7, 2025) lay bare the risks inherent in this strategy, explicitly outlining scenarios where selling Bitcoin might become unavoidable:
Covering Financial Obligations: The most direct risk stems from the potential inability to meet debt interest and preferred dividend payments. The company states: "Our enterprise analytics software business has not generated positive cash flow from operations in recent periods, and may not generate sufficient cash flow from operations to satisfy these financial obligations in future periods." If external financing also fails, the consequence is clear: "a significant decline in the market value of our bitcoin holdings... may adversely impact our ability to secure sufficient equity or debt financing to satisfy our financial obligations... if we are unable to secure equity or debt financing in a timely manner... we may be required to sell bitcoin to satisfy our financial obligations..." This sale might occur "at prices below our cost basis or that are otherwise unfavorable."
Meeting Working Capital Needs: Beyond specific debt/dividend payments, general operational liquidity is crucial. Bitcoin's volatility and potentially thin liquidity during market stress mean it's not equivalent to cash. "During times of market instability, we may not be able to sell our bitcoin at favorable prices or at all... As a result, our bitcoin holdings may not be able to serve as a source of liquidity for us to the same extent as cash and equivalents." The filing adds: "If we are unable to sell our bitcoin... or if we are forced to sell our bitcoin at a significant loss, in order to meet our working capital requirements, our business and financial condition could be negatively impacted."
Funding Note Repurchases/Conversions: The convertible notes contain features that could demand large, sudden cash outflows years before maturity. Holders can demand repurchase upon a "fundamental change," where "holders may require the Company to repurchase for cash all or any portion of their respective Convertible Notes at a fundamental change repurchase price equal to 100% of the principal amount..." They also have specific dates years in the future where they can exercise put options. Failure to secure funds for these potential multi-billion dollar repurchases could necessitate Bitcoin sales.
Unexpected Cash Outlays: Significant, unforeseen cash requirements could arise, such as material tax liabilities (the company specifically flags risks related to the Corporate Alternative Minimum Tax under the IRA due to its unrealized Bitcoin gains) or adverse litigation outcomes. "If we become subject to the CAMT, it could result in a material tax obligation that we would need to satisfy in cash..." Absent other funding, Bitcoin sales might be required.
Inability to Adjust Spending: If revenue falters unexpectedly, fixed costs remain. "We may be unable to adjust spending quickly enough to offset any unexpected shortfall in our cash flow. Accordingly, we may be required to take actions to pay expenses, such as selling bitcoin..."
These acknowledged risks paint a picture of a company whose core asset, while held for the long term, may need to be liquidated under duress if its funding mechanisms fail during periods of stress.
When Might the Levers Break? Potential Triggers for Forced Sales
A specific Bitcoin price point alone is unlikely to trigger a forced sale. Instead, it's more likely a confluence of negative factors:
Sustained Low Bitcoin Prices: If BTC price falls significantly below MSTR's average cost basis ($67.5k) and stays there for an extended period.] Depressed MSTR/STRK Stock Prices: Directly hinders the effectiveness of ATM programs, cutting off the primary source of ongoing funding.
Closed/Expensive Capital Markets: High interest rates, general risk aversion, or specific negative sentiment towards MicroStrategy or crypto.] Approaching Debt Deadlines: As put option dates (starting 2027/28) draw nearer, market focus on MSTR's ability to refinance or repay billions will intensify.
Deterioration of Software Business: Removes any operational cash flow buffer.] Regulatory Shocks or Custodial Crises: Events fundamentally changing the risk or legality of holding Bitcoin.
Stress Test 1: The Price Collapse Scenario (BTC @ $30,000)
Imagine a severe crypto bear market driving Bitcoin down to $30,000. What happens to MicroStrategy?
Fair Weather Sailor? Assessing MicroStrategy's Vulnerability
The critique that MicroStrategy's strategy under Saylor is primarily suited for "fair weather" holds significant weight. The immense leverage, dependence on buoyant stock prices for funding, and the volatility of the core asset create a structure optimized for appreciation but exceptionally fragile in downturns.
Arguments for vulnerability:
Leverage Magnifies Risk] Funding Dependence (ATM effectiveness)
Volatility Exposure] Limited Operational Buffer
Mitigating factors:
Debt Timing (No immediate maturities)] Spot Holdings (No BTC margin calls)
Long-Term Conviction (Leadership unlikely to panic-sell unless forced)
However, the mitigants primarily address the timing and mechanism of failure, not the fundamental vulnerability. A company needing continuous access to capital markets funded by appreciation in a volatile asset to service massive debts is definitionally fragile. While they might not be the very first domino to fall, among large public companies undertaking such a strategy, MicroStrategy is exceptionally exposed. Should a prolonged crypto winter coincide with a broader risk-off environment, the "fair weather" critique would likely prove painfully accurate. A vulnerability score of 8/10 seems justified.
Conclusion: High Risk, High Reward, High Stakes
MicroStrategy's journey is a defining case study in modern corporate finance and risk-taking. By leveraging its balance sheet to become a major Bitcoin holder, it has offered investors unique exposure to the digital asset's potential, delivering spectacular returns during Bitcoin's ascents.
However, the path is fraught with peril. The complex capital structure requires a continuous flow of capital critically dependent on favorable market conditions. The company's own disclosures acknowledge that an inability to meet cash obligations could force the sale of Bitcoin, potentially at significant losses. Stress tests involving plausible market downturns paint a grim picture, highlighting the potential for catastrophic value destruction and high default risk if key assumptions fail. While leadership conviction and debt structure provide some buffer, the fundamental reliance on external funding tied to a volatile asset makes MicroStrategy exceptionally vulnerable to market storms. It remains a company built for the bull run, facing profound questions about its resilience should a deep or prolonged winter arrive. The stakes could not be higher.

Still moving down ... tomorrow PanicThis channel is not providing individualized trading or investment advice, nor is it a banking service, brokerage service, trading service, investment service or money management service.

Long-term Potential in Crypto Strategy: Go Long on MICROSTRATEGY
- Key Insights: MicroStrategy is facing bearish momentum amid broader tech stock
pressures, but its strategic involvement in cryptocurrency offers a
potential hedge. Trading below major moving averages, it shows resilience
tied to its Bitcoin investments. Key support is seen at $230 and resistance
around $300, crucial for potential recovery as market sentiment stabilizes.
- Price Targets: Based on professional traders' insights:
- Next week targets: T1=$300, T2=$310
- Stop levels: S1=$225, S2=$215
- Recent Performance: Recently, MSTR exhibits a downward trend, trading below
50-day and 200-day moving averages. It reflects pressures from declining
tech and crypto markets, yet maintains resilience due to its strategic
crypto participation.
- Expert Analysis: Analysts recognize MSTR's bearish trend with the potential
for support at $230. However, its alignment with the crypto sector could
buffer against market declines. The trajectory around moving averages
remains critical for forecasting future movements.
- News Impact: With the issuance of 3.6 million shares for $1.2 billion to
acquire more Bitcoin, MicroStrategy amplifies its crypto exposure. This bold
stance underscores its commitment to digital assets amid uncertain market
conditions, potentially providing long-term gains despite short-term
volatility risks.
$MSTR Model Book Example - 2024 - Continuation Set-upGreat example of continuation set-up on MSTR in 2024. Capturing the second leg following a shorter consolidation after digesting the first leg.

MSTR: Mid-term and Macro Price Structure As price holds below $344, odds favor a continuation lower to retest February lows, with later potential bounce and one more push to macro-support levels: 160/150-120 (with a potential extension to 105)
(see. recent idea on BTC price structure)
If BTC and broad market indexes show signs of stabilization and short-term strength over the coming weeks with MSTR price rising above 344, the odds are shifting to a more pronounce bounce to 400-460 resistance levels.
Weekly chart:
From a macro perspective:
as long as price remains below the 460 level, I consider the bullish trend since 2008 lows to have topped in November 2024, with current price action unfolding as part of a larger corrective Wave c.4 structure. Otherwise, If price reclaims ATH the door opens for an extension to 780-1280 resistance levels.
Monthly chart
Recent idea on BTC:

Moving lowerThis channel is not providing individualized trading or investment advice, nor is it a banking service, brokerage service, trading service, investment service or money management service.

$MSTR $320 resistance retest Short term calls. Looking for a move to the upside to retest a resistance level of $320 area and see how it reacts. Crypto could be an outlier amidst tariff rhetoric.
WSL

StrategySo they want you to sell your Strategy, because some idiot thinks he knows better than Saylor, when it was Saylor who fought for the accounting principals that allow corporations to own BTC on their books, and now almost 100 other corporations are playing catch-up. When BtC miners are buying BTC on the open market, all this does is confirm that Saylor is correct, and Bitcoin is no longer for sale.
Soon, you’re going to find out what happens to the BTC price as liquidity dries up, as everyone, including governments, go diamond hands.

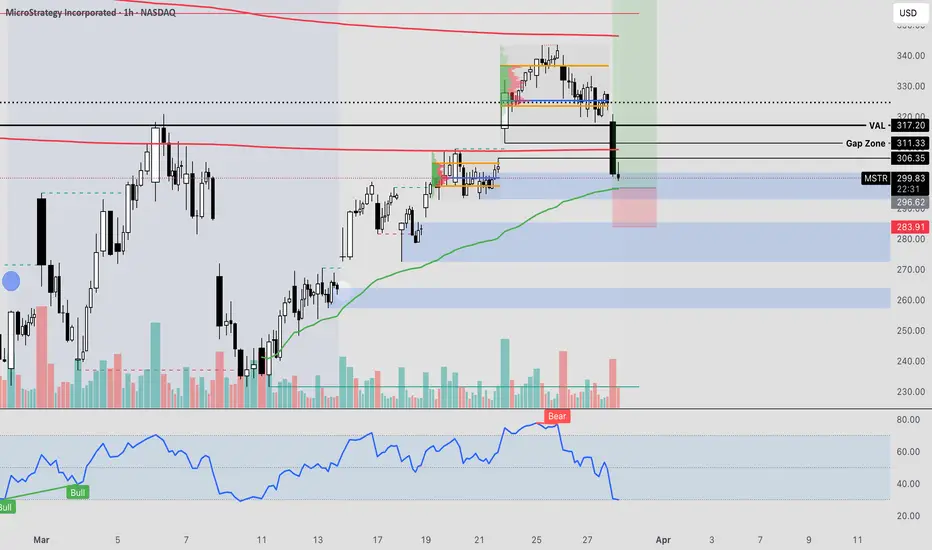
MSTR Ready for Breakout or Bull Trap? Here’s the Key Levels.Market Structure & Price Action
MSTR has recently formed multiple Break of Structure (BOS) and Change of Character (CHoCH) signals, suggesting a power struggle between bulls and bears. The chart currently shows price climbing into a descending trendline and pressing right up against key resistance near the $307 zone after rejecting the CHoCH zone from below.
* BOS confirms bullish intent, but it's climbing within a falling wedge, creating a potential breakout setup.
* Support held strong at $272 and $281, forming a higher low structure with growing bullish momentum.
Trendlines
* The falling wedge pattern is a bullish reversal pattern. Price is nearing the apex—expect volatility and potential breakout in either direction.
* A breakout above $307 with strong volume could trigger a squeeze toward $320–$344.
* Breakdown below the rising trendline near $297 could invite downside liquidity grabs.
Indicators Analysis
* MACD is showing bullish cross momentum, but it’s flattening—momentum is not strong yet.
* Stoch RSI is approaching the overbought zone, indicating a short-term pullback could occur before a true breakout.
Key Levels
* Support: $297 / $281 / $272
* Resistance: $307 / $320 / $344
* Reversal Zone: $272–$281 demand zone still valid if price drops.
Options GEX Sentiment
* GEX Walls are stacked around $325 and $344, signaling heavy call positioning—possible magnet if momentum confirms.
* IVR: 25.7 (low but rising)
* Call%: 42.6%
* IVx vs Avg IVx: +9.23% suggests bullish bets are heating up.
* GEX: Green across the board — bullish gamma tilt.
This GEX alignment suggests a call-dominant environment, especially above $307, increasing the probability of a gamma squeeze toward $320+ if bulls sustain pressure.
Trade Ideas
* Bullish Scenario: Long above $307 breakout with volume. Targets: $320, $344.
* Bearish Scenario: Short below $297 breakdown or wick rejection at $307. Targets: $281 / $272.
Conclusion
MSTR is coiling at resistance with bullish signals building. If it breaks $307 with volume, there’s room for a sharp move higher supported by strong call walls and GEX. However, fading momentum or a fakeout at this level can lead to a pullback to $281 or lower.
📌 Watch the volume and MACD for confirmation before entering either side.
Disclaimer: This analysis is for educational purposes only. Not financial advice. Always do your own research and manage risk accordingly.

6 days 30% up on the tradeThis channel is not providing individualized trading or investment advice, nor is it a banking service, brokerage service, trading service, investment service or money management service.

MSTR Time To RipLooking for long trades at these key levels, mainly anchored vwap from the low for what may be a face ripper rally
monthly and 2week @255.43 i doubt MicroStrategy will be able to hang on when all other crypto and stocks are breaking structure. the yellow trendline is the most touches i could get. all trendlines are on daily.
just broke below 100ema today. look where 200ema is. ???
since its going2b that kinda party, imma gonna stick my dikc in the mashpotatos~
