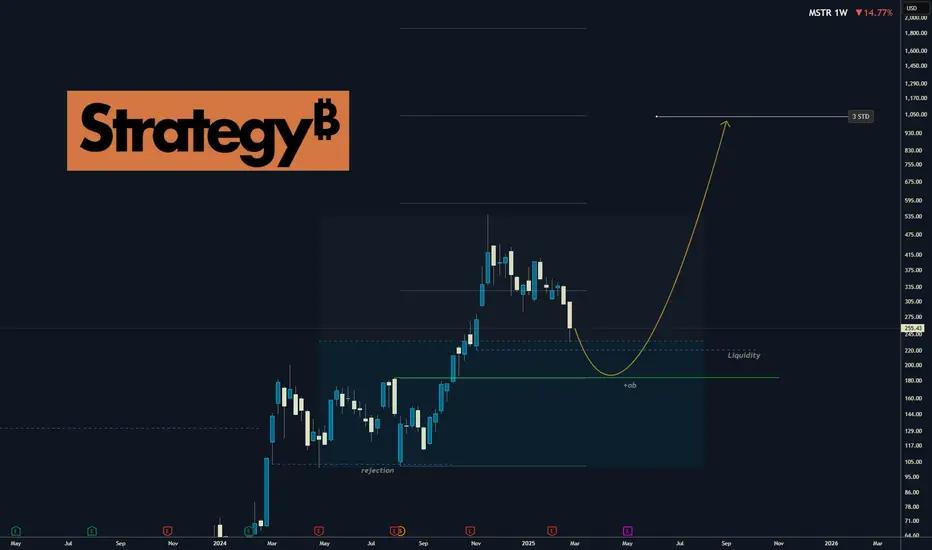
STRATEGY I Huge upside potential. Why it's great long term buy.This is not a short-term trade as you know from me on FX, Crypto and Indices. This is buy and hold investment. I got already good bag of share and I'm still adding without trying to time if perfectly, but now I think its time to buy bigger positions.
MSTR is my 2nd biggest position after the Bitcoin and TESLA). Many people thinks its a risky and that the company must sell BTC if price drops. Which is not true. Just let me explain.
Why MicroStrategy is Considered a Top Investment
MicroStrategy, led by Michael Saylor, is often seen as a leading investment for those wanting to invest in Bitcoin through a stock. The company holds significant Bitcoin (nearly 500K BTC) as its primary treasury asset and has been buying more using funds from convertible bonds and other financing. In 2024, its Bitcoin holdings were worth around $25 billion, and its stock rose nearly 400% due to Bitcoin's price surge. They are still buying more and their goal is 1 milion BTC.
How They Work with Convertible Bonds
MicroStrategy issues convertible senior notes, which are bonds with low or zero interest rates that can be converted into its stock at a predetermined price. For example, in November 2024, it issued $3 billion in 0% notes due 2029, with an initial conversion rate of about 1.4872 shares per $1,000, equating to a $672 conversion price MicroStrategy completes $3 billion convertible notes offering By Investing.com. Bondholders can choose to convert into stock if the price is high, or demand cash repayment under certain conditions, like on June 1, 2028. This allows MicroStrategy to raise capital without immediate stock dilution, using the funds to buy more Bitcoin.
What If the Price BTC price Drops Significantly
If MicroStrategy's stock or Bitcoin price drops significantly, bondholders might not convert their bonds, preferring to redeem them for cash. Here many investors things that MSTR will have to sell BTC. In the fact yes. But they are borowing long-term with zero interest.
Thoughts on MSTR Liquidation Risk:
The only liquidation risk I can see is via their convertible debt offerings:
1) If convertible debt buyers do not convert to shares before maturity, it forces MSTR to sell BTC to reimburse debt holders.
2) This would happen if MSTR doesn't pump more than ~40% in 5-7 years (varies according to each bond, see table below)
Basically either MSTR correlation to BTC needs to fail or BTC needs to fail.
There's other risks of varying magnitude:
- Competition risk, others copying the playbook reducing MSTR premium to NAV
- SEC intervention risk of future buys, reducing MSTR premium to NAV
- Custodial risk at Fidelity and Coinbase
- US nationalisation risk (seize the BTC)
- Saylor key man risk
- MSTR operational risk
In the end every invesment you do comes with risk. If there is no risk no gain will be possible.
Hope this clear your hesitations, let me know your opinions abou this stock.
Good Luck
David Perk
MSTRD trade ideas
MSTR - 3 Potential Support LevelsPotential Support levels are where the green small arrows are:
white L-MLH
red CL
red L-MLH
All tough, I think MSTR Ponzi will dye over the mid term.

MSTR down she goes....value gapLet's be honest, 9% bump for MSTR is like getting socks twice on Christmas! There is zero value here and will drop so hard. There could be some bubbles from the pro-crypto administration, but there is no long term play there, it's just hot air for a cash grab.
Check out MSTZ....it will pop, but you need to do it fast and get out fast too!
Best of luck and always do your own due diligence!

MicroStrategy bouncing off 200 MAWe have also seen S&P 500 bounce off its own 200 day average, while the Nasdaq is coming off earlier lows. Meanwhile Nvidia is now positive on the session after starting the da below $110. So, a bit of a bounce back for stocks- is this the turnaround?
MicroStrategy could start next leg up here, if it again holds the 200-day average support near $235.
By Fawad Razaqzada, market analyst with FOREX.com

All's dropping as planned, but the target shifted.MSTR's correction is 50% complete, the final target is unclear and requires close monitoring.
A range of 90-150 is possible. Good luck!

MSTR to drop below $200You've been warned. MSTR will drop below $200. There is no hope here esp with the liquidity squeeze and dropping BTC (it dropped to high 70k yesterday!). Best thing you can do is MSTZ, and leverage the situation.
Do your own due diligence, best of luck and don't let crappy times get to you. If there's volatility and direction, you can make some mula :)

MSTR IS JUST GETTING STARTED - ONLY FOOLS SELL NOW!MSTR and Bitcoin are gearing up for the biggest bull run you've ever seen. Its unbelievable how many people are selling now thinking the bear market is starting and the bull run is over. Its crazy how many bears are flooding X and other platforms. It makes me laugh people calling Saylor a top signal and stupid. Saylor is not stupid and to think that you're smarter than him is just dumb. These rich dudes and hedge funds know whats going on, way better than anyone on here or any other platform. They control the markets, they have the money to make the charts do what they want. Dont be fooled.
None of this is financial advice. Just my opinion. Follow me for more charts and updates.

The BIG 300? MYTH OR REALISTIC?Closer to the 300 mark and consistently has sold off, but it looks like a good turning point. Again, it could temporarily slow down and consolidate in this region. Still, a breakout is pending, and 300 plus is undoubtedly not far-fetched as this has performed with volatility in the past, at almost high levels of reversal.

MSTR closing in on critical break level. Previously I pointed out the MSTR possible topping pattern at the 4.23 and spoke at length about how this pattern tends to predict a revisit of the 1.27.
This 1.27 move is always a crash and in a pattern like this tends to come in at around a 76% drop from the high.
Now MSTR is heading into the 2.20. If this level breaks we usually have a period of capitulation to not less than the 1.61. Most of the time the 1.27 ultimately ends up hitting/

I heard we're selling kidneys to back speculative bets. If it all comes to pass Saylor was just a troll who stuck to the bit, I'd feel this made a lot of sense given he tends to say things that are either trolling or insane.
And I'd like to think more people listen to a troll than an insane person.
Anyway, up review of his latest advice to sell a kidney rather than selling BTC, I'd like to announce my plans for gambling the proceeds of body parts.
If we get to 320 I'm selling my kidney to buy the 180 puts in MSTR.
I'll be an investor. Doing investor things.

MicroStrategy's Path: Prepare for Volatility and Short Squeeze P
- Key Insights: MSTR's connection to Bitcoin creates high volatility, making it
a candidate for short-term trading strategies. With crucial support at $142
and resistance at $543, watch for price movements that could trigger a short
squeeze. The current market sentiment suggests active trading around these
levels, driven by broader cryptocurrency trends.
- Price Targets: Next week targets include T1 at $1,050 and T2 at $1,120,
reflecting a potential bullish trend. Stop levels for LONG positions are set
with S2 at $138 and S1 at $142, adhering to the required hierarchy S2 < S1 <
975.91 < T1 < T2.
- Recent Performance: MSTR's recent market activity has showcased significant
fluctuations, closely mirroring Bitcoin's price movements. The stock has
experienced sharp declines in correlation with Bitcoin dips, but the
potential for reversal exists as support levels are tested.
- Expert Analysis: Experts emphasize the importance of monitoring price levels
closely for potential short squeezes. The market sentiment remains
cautiously bullish with a focus on recovery, provided MSTR can maintain its
support. Analysts suggest remaining vigilant as the cryptocurrency landscape
evolves.
- News Impact: Recent fluctuations in Bitcoin have had substantial adverse
effects on MSTR's stock price. Investor sentiment is heavily influenced by
changes in the cryptocurrency market, highlighting the risks and
opportunities that lie ahead for MSTR as it navigates these dynamics.

MSTR Bounce expectedIt looks like price found a support at the L-MLH.
From here, I expect a bounce, at least up to the Center-Line, if not all the way up to the Upper-Medianline-Parallel.
Long term, my expectations have not changed.

Let's break the range on $MSTR!Exciting news for crypto enthusiasts! A new state strategic reserve for digital assets that features five top cryptocurrencies, with Bitcoin and Ether front and center. Bitcoin, the undisputed heavyweight of the crypto world, saw an impressive 8% surge to about $90,800 following the announcement, NASDAQ:MSTR

ONCE IN A LIFETIME Fibonacci PyramidBuys: 152 to 294 Target 662🎯
FIBONACCI algo Finally Stepped in LAST week starting LIGHT and WILL ADD MORE
I plan to automate LEAPS and sell PUTS step by step all will be ALERTED here DROP A LIKE

MicroStrategy $MSTR | MicroStrategy’s Bitcoin Bet Sees 20% DropMicroStrategy NASDAQ:MSTR | MicroStrategy’s Bitcoin Bet Sees 20% Drop Feb28'25
With recent downturns in the crypto market, Bitcoin's sharp drop has significantly impacted companies like MicroStrategy NASDAQ:MSTR , which has heavily invested in crypto. I've kept this analysis updated for my students throughout the week and figured I'd post it publicly.
This is what I would personally look at before entering trades, everything is subject to change on a daily basis and as I analyze different timeframes and ideas.
ENTERTAINMENT PURPOSES ONLY, NOT FINANCIAL ADVICE!
trendanalysis, trendtrading, priceaction, priceactiontrading, technicalindicators, supportandresistance, rangebreakout, rangebreakdown, rangetrading, chartpatterntrading, chartpatterns, spy, btc, bitcoin, mstr, micro, microstrategy, strategy, cryptocurrency, cryptodrop, cryptotrend, memecoins, crypto, digitalcurrency, digitalassets, mstrdrop, btcdrop, bitcoinidea, mstridea, mstranalysis, btcanalysis, cryptoanalysis, cryptotrades,

The Case for a 76% drop on MSTR: Norms of fib levels in a trend.If you draw a fib from the high to the low of the 2022 drop in MSTR, you'll see we have now completed all of the fibs of this swing.
In this post we're going to take a detailed look at two things;
1 - How a trend typically forms heading into a 4.23 extension.
2 - What typically happens at 4.23 extensions.
Everything we cover here will be generic rules for trend development. It's equally valid on bull and bear moves (we'll use examples of both) and it can be used on any timeframe. We're going to stick to big charts for this but these same concepts also scale down to day trading.
We are going to look at these specific hypothesis';
1.27 - 1.61 will produce some sort of pullback.
The breaking of 1.61 will produce a steady trend to at least 2.20.
Around 2.20 - 2.61 there will be some sort of reaction.
The move from 2.61 to 4.23 is very strong.
4.23s can mark the end of major moves.
These conditions in MSTR are marked into the chart pic. Let me show you another example on a bear trend to get us started.
This was the last bull swing before the 2007-2008 reversal. We're using the topping swing for our fib. We can draw this really early as soon as we see the first possible break.
We drop to the 1.61 and then we bounce. It looks like a recovery in real time.
Then once the 1.61 is broken we drop quickly to the 2.20.
Look closely here. The move to the 2.20 isn't the big red candle. There's a wick. That tells us this was a flash event. Crashed to the support, rapid bear trap. Filling our conditions of the expectations of a 1.61 break and the reaction 2.20.
The wick candle pullback went to around 1.61 and then there was capitulation when the 2.61 was broken.
We get to the the Final Boss of the fibs. The 4.23. There's a head fake under it and then a recovery back over it.
And the 2008 crash is over.
Want another one? Here's BB. The pattern expressed over a very long time. Full booms and bust.
Saw a lot of these patterns in 2021.
Imagine if you could have used the same playbook we can observe on the all time BB chart and used the same set of rules to understand all the key parts of the 2021 trend. That'd be weird.
Attached is a pic of the real time 2021 mention of fading the BB rally at the 4.23 (just to show this isn't just perfect fitting after the fact).
Let's jump back to another low. Here was the BTC low.
Or a bull one.
What Happens at 4.23 Fibs?
Most of the time when 4.23 fibs are hit there is a large correction or a full blown reversal. Cases of 4.23's breaking without retesting the 1.61 - 1.27 (and that's a crash, big move) are rarer.
In the times there is a 4.23 breakout, the following trend is usually exceptional. When looking at big instances of failed 4.23s they're usually found around the middle of a bubble or crash (depending on if it's a bull or bear break). It's much more difficult to show examples of the failed ones without being able to zoom in and out a lot, but you can look for them in places like the Nasdaq bubble, NVDA rally and in failure points of uptrends heading into crashes.
Almost invariably, the trend goes into a state of hyper performance if the 4.23 is broken.
However, if it is not broken - then we're usually going to ultimately end up spiking out the 1.27 fib. Which round trips most of the move.
If MSTR is a 4.23 blow off, it's give up most of the gains of the recent rally. That is inside of the bullish perspective. The correction comes to 1.27. If 1.27 fails, then you can end up with that lifetime BB chart.
Action around the 4.23 itself is fraught with caveats when it comes to actionable trading. You have to always have the assumption that if you're wrong you're going to be betting against a punishing trend and you have to be risk cautious and quick to get out / plan new levels. It always has to be remembered if wrong, the fade will fail spectacularly.
Further complicating things is we really can't be sure what sort of 4.23 head fake we're going to get. There are times we reverse right at the 4.23. Or come up a bit shy of it. Other times we make a nominal head fake that you could have started betting against almost as soon as it got passed the level and it went nothing but well for you.
Then there are the super blow offs. BB was somewhere in the range of 20 - 25% blow off. I remember this well (I'd shorted the 4.23 touch) it only lasted an exceptionally brief amount of time and was ultimately the Mother of all wicks but if I'd be fully exposed to all that price move - wouldn't have mattered. I'd probably have got nailed before it.
When it comes to the actual tactical betting on a 4.23 reversal, it's tricky. The core underlying theory of the 4.23 decision is a simple binary one though. Usually when the 4.23 is hit we're going to head into hyper trend conditions. These can be higher (and this is hard to quantify targets for with fibs) or they can be crashes (which we can usually roadmap with the 1.61 - 2.20 - 4.23 thing).
Extremely polarizing level here. Either all fib bases bear cases are entirely annulled for the foreseeable future or a drop of about 75% is setting up.
The 4.23 pullback/reversal is the far more common outcome.
====
Bonus doom posting:

What happens next?Bitcoin, NVDA, SPY, QQQ, SMH... Will the markets crash and burn or will they survive? 6300 or 5750... stay tuned.

MSTR-SELL strategy weekly chartOf course this share follows BTC and both are moving south. I think we are only seeing the start of it, even though very short-term we might be a bit oversold, the bigger picture is far more dangerous.
The share price is negative and we broke trend suppoort $ 302 and this suggest we should move towards cloud support $ 148 area.
Strategy SELL @ 260-290 and take profit near $ 155 for now.

price is playing inside a trianglethis is the path that i'm thinking price is going to print.
next week we go up to make d and then go lower to make e.


MSTR and OBVEvery time during this cycle that MSTR OBV has retested previous maximums, it has been followed by a bull run. It seems that we are about to do the same.

Microstrategy follows BTC patternWell known crypto bull Michael Saylor and his Microstrategy. Here we are, approaching demand zone as BTC drops. We are early here but keep an eye on it for later entry or DCA on the way down.

GME ( Bitcoin ) Vs MSTR Hi everyone
Just sharing som ideas… We heard from news about GME stock and Bitcoin… What will be the impact of GME really get in ???
The simple idea lets match to look at what happened for ( MSTR ) when it get into Bitcoin, the stock start impacted with Bitcoin price and it increased from 45$ to 500$.
That mean the GME will have a high potential for the price to be impacted with Bitcoin..
Thank you 🙏
