Time to Fade the Now Consensus View on Gold and Gold Miners?This has reached a bit too consensus for me.
Fading/closing longs on Gold/gold miners.
NEMD trade ideas

Newmont Mining - The Long Play Going ForwardGold Miners have suffered, and this one has now capitulated in my opinion.
Yielding 5.6%+ and near a hefty demand level between 38-35, I'd expect a new uptrend in this one sooner rather than later.
(See pink circles in the longterm squeeze indicator chart, extremely eversold - second most since 1985)

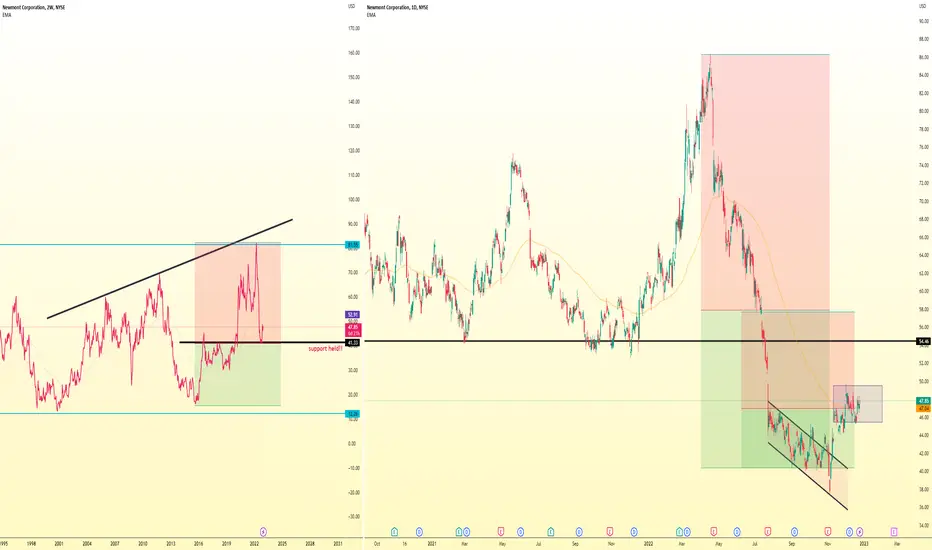
Fib level support heldNEM support level @ fibonacci level
61% held.
this is a bullish signal.
GOLD will rise in 2023, i mean the USD will
continue to depreciate. expect NEM
to bounce higher. sellers have been exhausted.
$NEM with a Bullish outlook following its earnings #Stocks The PEAD projected a Bullish outlook for $NEM after a Positive over reaction following its earnings release placing the stock in drift B with an expected accuracy of 83.33%.

NEM is going Up It the right time to ride this long wave of #NEM after the major drop and finishing the accumulation phase. I always use S1&S2 to help me identify the key levels and get some free signals, but this time I used naked chart with market structure only.

NEM bullish into January - Target $70NEM follows the sine wave very well. Has tested support and currently Bollinger bands squeeze. When BB squeeze, you have a very hefty upthrust. About a 50% run into late January.

Short Newmont Mining $NEM1. Trend is down over year and half
2. TTM Squeeze that usually bounces off opposite wall before reversing
3. Hitting resistance trendline repeatedly
4. Under 200ema
I could see this ultimately hitting 200ema, which I would dump everything into going short, but this spot is good for a short as well. Always keep more dry powder and don't blow your load in one go!

NEM is nearing a rocket zone on dailyPrior area of congestion at 46.65 when cleared should give a good low volume rocket thrust up to the 50.84 area. If you didn't get this at the bottom you missed a good bargain.

NEWMONT and TD ReinforcementNEWMONT has TD Reinforcement in daily chart and also TD Buy Setup in weekly chart with bullish divergence signal. The best strategy is not only buy or long NEM but you are also able to short put option for playing with time decay. I recommend to apply the strategy before earing period to take an advantage of imply volatility. However, don't forget to limit your risks before trading. Good Luck!

Newmont: 2x potential outlier basing @2009 channel+ Cup NeckNewmont gold miner, after more than doubled from a 2016 Cup & Handle formation, came back down to retest the neckline at around 40. As you can see in the chart, it reached the top of the 2009 channel near 85 on
April 2022 & went vertically down to retest the channel base near 40, with the usual chopping near the mid channel dotted blue line.
Very bullish cases: target levels are 50 (previous strong support), 60 (projected ma200 zone) & 70 (projected channel median line)
It has been basing for 7 weeks holding 40
Basing around the 2009 lower channel
Retested successfully 2016 Cup & Handle neck@40
Slight Rsi divergence
Macd holding above zero
Made higher high & higher low
About to cross daily dma50 to regain channel
WARNING: with GDX & GDXJ gold miners looking very bearish at this point, I MAY BE WRONG! So watch carefully the 40 zone as it is the line in the sand.
Not trading advice

'Financed Spread' Trade Idea for a 1/20/23 Expiration"Financed Spread" idea.
1/20/23 Expiration.
SELL $50 Call.
BUY $45 Call.
--{Current Share Price: $42}--
SELL $40 Put.
The credit will be around $166 and the collateral will be $4,000.
The max gain of $666 hits at a share price of $50 (19% price gain from current (10/1) price).

NEWMONT - Long IDEA- Great risk reward entry on this US listed miner.
- Longterm support trendline
- Morgan Stanley has increased their exposure to NEM in the second quarter.
- SL and initial TP on the chart

Newmont: Humpty Dumpty 🥚🧱Humpty Dumpty sat on a wall,
Humpty Dumpty had a great fall.
All the king’s horses and all the king’s men
Couldn’t put Humpty together again .
Well, Newmont shouldn’t have such a great fall that it can’t be put together again. Tough, just like the egg headed character from the British nursery rhyme, it is sitting on the big yellow wall between $42.50 and $23.41, in which it should drop to finish wave (2) in yellow. Afterwards, Newmont should turn upwards, heading for the resistance at $86.37.

Buy $NEM - NRPicks 05 AgoNewmont Corporation is engaged in gold production and exploration. It also explores for copper, silver, zinc and lead. The company has operations and/or assets in the United States, Canada, Mexico, Dominican Republic, Peru, Suriname, Argentina, Chile, Australia and Ghana.

Newmont breaking out of the box and going lowerThe Bollinger Bands contracting inside the Keltner channel predicts an explosive move ahead that will last at least 8 days. Combine that with Newmont's Price Action creating a box which looks like it's breaking through. I would not be surprised if there was a retrace to the top of the box later today if action is aggressive, or Monday morning - then it's Sayonara Sucka.
I've already detailed all the reasons why in my gold/dxy threads why miners will experience more pain ahead. I'm selling OTM calls and buying ITM puts with the credit here. If it goes up, it's a squash - if it goes down, excellent revenue to average in at a lower price until miners turn around.

NEM-BUY medium-termThere is lot's of talk for further GOLD weakness. That is fairly strange considering inflation, and uncertainties with weaker economies that may enter recession in the near future, if one reads into the latest development. Especially the US housing market.
GOLD per se, seems slowly building up support form the medium-term, but bearing in mind we can range downward in the near term, but not very likely or certain.
This stock seems good opportunity buying into Bollingr Band with a likely objective near $ 60.00 or higher.
NEM BUY+++++ way oversoldStill no change in view, NEM went lower than expected but appears to still have long term support in place and resistance around $53 range. We should see a retracement back to $63.68 .5 fibonacci range in coming weeks/ months. Copper and Gold miners are way oversold and been taken out to the woodshed with an artificially inflated dollar on the backs of $33 trillion national debt and trillions in funny money printing which will ultimately be the dollars demise. I have October 21st $52.50 calls. GL


$NEM with a Bullish outlook following its earnings #Stocks The PEAD projected a Bullish outlook for $NEM after a Negative Under reaction following its earnings release placing the stock in drift D with an expected accuracy of 90%.

Long term channelI think the risk to reward is good here for Newmont. Especially for anyone lacking any precious metal exposure

NEM BUY+++++++ on verge of breaking out!NEM and other gold miners have been decimated in recent months due to a collapse in commodities. NEM appears to have bottomed, based and consolidating. I would expect a move to $60-65 in coming weeks. NEM is highly oversold on daily and weekly charts and Copper/ GOLD seems to have bottomed in $1665 range recently. Purchased a total of 500 $52.50 NEM October 21st calls.

NEM BUY++NEM has been in oversold territory for many days and appears to be consolidating here as it's held support. I believe short term commodities have bottomed (copper, gold etc) and NEM is attractive here. I would expect a bounce to $60-65 in coming weeks.

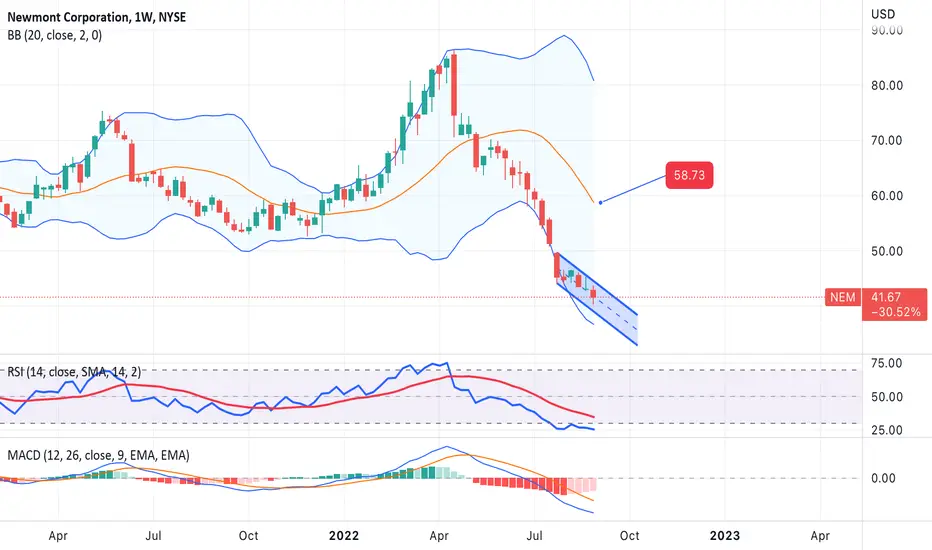
Newmont Corp. stock analysis: Has NEM bottomed out?Newmont ( NEM ) stock prices have been falling precipitously, halving in value from highs of $86 in mid-April, due to lower gold prices and rising input costs weighing on the company's earnings.
On July 25, following the release of the disappointing second-quarter results, with EPS down to 0.46 (-30% lower than expected), the world's largest gold miner fell to a year-to-date low of $44.
Since then, however, NEM appears to have formed a very solid support at $44, which has not been broken downwards, indicating that the sellers’ strength may have faded.
NEM could have bottomed out here, but it has yet to gain traction, as prices have consolidated in a tight range between $44 and $47 over the past two weeks.
The RSI is still in oversold territory (26) but is rising slightly. Instead, the MACD provides a bullish crossover signal as the MACD line crossed from below to above the signal line.
If we are on the verge of a new bull trend, the first hurdle to overcome is undoubtedly the psychological level of $50, which served as support prior to July 25th. A breach of this level would also lead to a breakout of the 2022 bearish trendline and encourage a test of $54.04 (the 23.6% Fibonacci retracement level from April 2022 high to July 2022 low). Alternatively, if there is a fresh round of pessimism, the market may retest the $41-41.7 level that served as support in March and April of 2020.
Analysis written by Piero Cingari, forex and commodity analyst at Capital.com
