NFLX BUYPeace be upon you, merchants. There is a chance to get into the company Netflix. Market only to buy. Otherwise, I do not recommend selling
NFLXD trade ideas

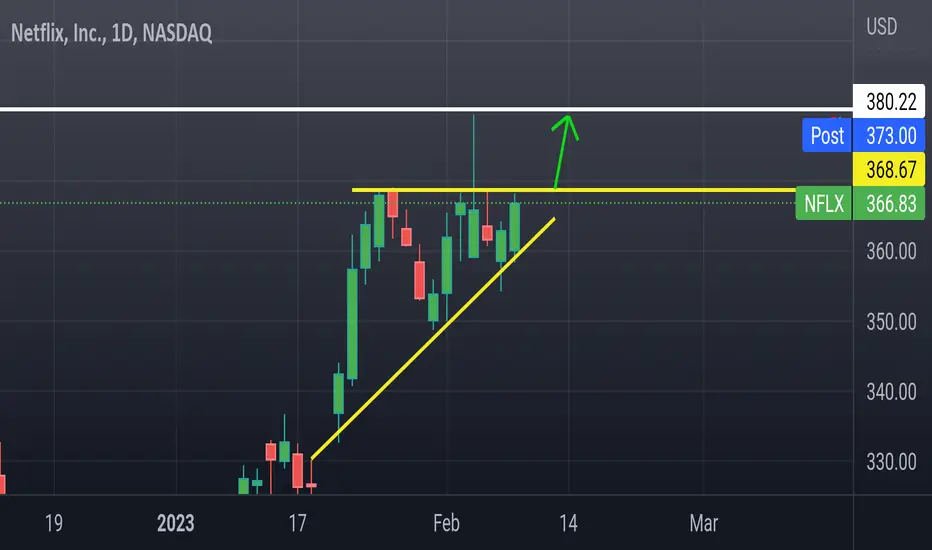
NFLX SHORt iTIf it fails to break above 375 before Friday, we will have a bloody weekend.
Also don't be too hopeful after that.
Good Luck

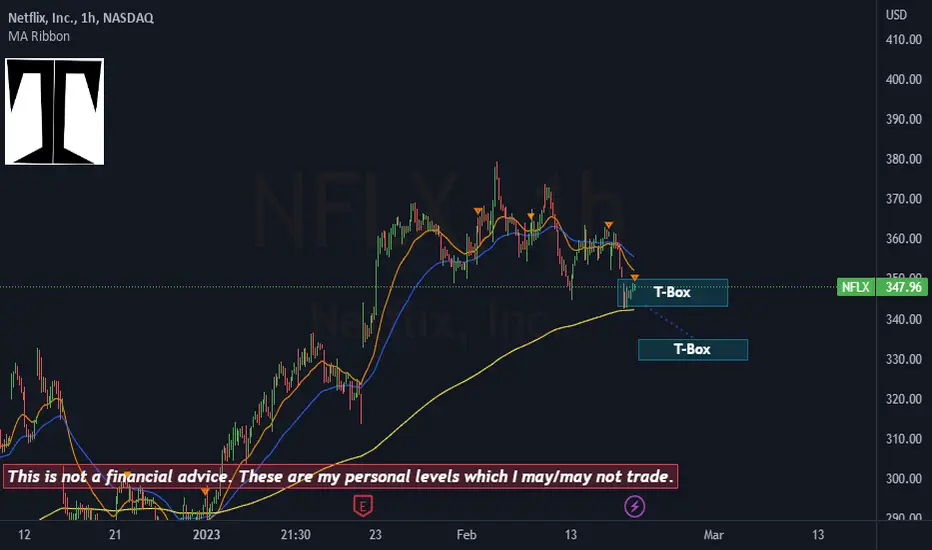
Next T-Box :NFLXPlaying the ema 21h on the ema 250h the price could move from the current box to the next one and create a nice test of the 21h on the 250h.
On the opposite side, the price can find support directly on the 250h.
NFLX AnalysisPrice played out nicely according to my analysis last week. Price gave a confirmation to go lower on the lower timeframe. I'm expecting price to continue lower, targeting the fair value gap at 332.63.

MACD Signal for Long in NFLX with MA50MACD line crosses over signal line below base line (around -10) indicating possible reversion of downfall price that breaks MA50 upwards with separation of MACD and signal lines, possible entry in long and indicating strong momentum, which in times loses some strength, but never touches MA50, until it breaks downward with a previous MACD/signal line crossover at around 12.5, suggesting closing the position.

NFLX: New Bottom!We could be a speculator's ascent targeting area: 352.61/357.86.
And if the downtrend is broken we may continue to form an upward wave ( I don't think so).
Perhaps the rise may be interrupted before touching the downtrend at 352.61 and we target the demand area : 336.

NFLXFinally broke and closed below 354 fib support and 21ema at 352...
Next targets are fibs below
My final target is 330 or 50sma

$NFLX finished inside on the daily above the 9EMA.$NFLX finished inside on the daily above the 9EMA. I'm looking for a 2-1-2u with a breakout.
Calls over $363.75
Target $374
Puts under $354.24
$Target $344

"Possible" Bullish MoveVolume is not where I like it and the market is kind of slow right now, but aside from that the moving averages are starting to line up. There's a cup and handle pattern combined with a possible trendline break and NFLX appears as if it is trying to break away from a previous consolidation area.
Look for price to cross the trendline and break above the 200 MA on volume.
Also worth mentioning, VIX is below 20 and the market appears as if it could potentially rally.
For these reasons, I have it marked as to watch closely and wait for further clues for entry. I believe the move can range from $3 to $4 but who knows... this is merely an assumption.


NFLX14 straight session and NFLX couldn't close above 368.
NFLX along with META, TSLA, and NVDA has had enormous gains in the couple of months;
Coincidentally they suffered the biggest pullbacks late last week.
1.Daily selling pressure increased on NFLX
2. Broke wedge support.
3. Triple top playing out on the hourly.
My short target would be 315 gap close .
Keep in mind , no matter how bearish this setup looks, if CPI causes the market to rally NFLX could move in a bullish direction.
Any stop losses should be a close over 368

NFLX consolidation before push to 417 💪as long as trend support zone holds bullish bias is logical, nice break past 330 long trigger straight to my target of 350!
i set a new explosive long trigger at 370, next time this breaks we will see next leg higher in my opinion

NFLX: Buy ideaOn NFLX we have a good spring effect on vwap so it's mean that we will have a big probability of an uptrend.Thanks!

Calm before the stormThere is a pattern of tops both in RSI and MACD. I expect it to reach the highs on both indicators again. Therefor, I believe it will go up a bit more, around 385. After that it will head down towards the support of 335 or possibly lower depending on how bearish the market will be in the coming months.

Buy ideaWe are in downtrend with a candle with a small body and a long wick so it's mean that we will have a big probability of an uptrend. Thanks!

NFLX AnalysisPrice played out nicely as analyzed last week. Price gave a confirmation to go lower at this bearish POI at 366.43. Potential target for this down move is the bullish POI at 300.66.

NFLX Monthly analysisI would like to see price retrace to this monthly bearish breaker to finish creating the market maker sell model. PUT CITY! (High, Low, Higher high/ manipulation and grab on buyside liquidity, delivering huge monthly diplacement candles breaking structure and creating a lower low. With in this set up we have a monthly fvg witha breaker within as well as OTE in the same targeted are for going short. AMD (Accumulation Manipulation Distribution)

NFLX 280 gap closeAscending triangle formed.
Target is gap from April 2022.
Entry - 270
Target -280
Stop loss - 268
NFLX Potential for Bullish Rise | 8th February 2023Looking at the H4 chart, my overall bias for NFLX is bullish due to the current price being above the Ichimoku cloud , indicating a bullish market.
Looking for a pullback buy entry at 332.72, where the overlap support and 38.2% Fibonacci line is. Stop loss will be at 273.41, where the recent low is. Take profit will be at 472.02, where the overlap resistance and market gap are.
Any opinions, news, research, analyses, prices, other information, or links to third-party sites contained on this website are provided on an "as-is" basis, as general market commentary, and do not constitute investment advice. The market commentary has not been prepared in accordance with legal requirements designed to promote the independence of investment research, and it is therefore not subject to any prohibition on dealing ahead of dissemination. Although this commentary is not produced by an independent source, FXCM takes all sufficient steps to eliminate or prevent any conflicts of interest arising out of the production and dissemination of this communication. The employees of FXCM commit to acting in the clients' best interests and represent their views without misleading, deceiving, or otherwise impairing the clients' ability to make informed investment decisions. For more information about the FXCM's internal organizational and administrative arrangements for the prevention of conflicts, please refer to the Firms' Managing Conflicts Policy. Please ensure that you read and understand our Full Disclaimer and Liability provision concerning the foregoing Information, which can be accessed on the website.

QuickTrade Idea n.280 # NFLXI am Bullish above $365.84 with target at $373.61
I am Bearish below $355.65 with target at $350.02

Netflix no more password sharing =(Its time to sell netflix as we can no longer share passwords :(
Nothing to do with Bearish Regular divergence on Daily chart
or even a formation of bearish variant flag, that may indiacate a bearish continuation, may be merely coincidental =/
NFLX calls?nflx calls might looking good today. usually people will sell on market open so wait for that and then get in to the calls

NFLX AnalysisPrice reacted a little from the bearish POI at 366.43 from my last analysis. Price is unable to push higher with a strong rejection. I'm expecting price to continue lower with a confirmation on the lower timeframe.
