NFLX & chilling until...Earnings. I have been bearish on this stock technically. Currently it is floating within the Bollinger Bands. Today (3/26) was pretty bearish on the market overall. I read that NFLX will be raising rates or creating alleged value within its ad tiers. I like commercials, so I'll keep watching them lol. Anyways... I just know that people will be affected by loss of jobs/income. NFLXing may not be top of mind for many. I also hear rumors of a stock split. That would be great. & if it happens, I'll still be looking for pullbacks. Will see how week and month close. Earnings 4/17.
***Side note... I remember when the original CD business launched during my college days. Oh how I wish that I was investor savy at the time. Sigh... Looking forward to earning some moolah on my trade ideas now.
NFLXD trade ideas

Netflix (NFLX) Share Price Jumps Nearly 5%Netflix (NFLX) Share Price Jumps Nearly 5%
According to the charts, Netflix (NFLX) shares rose to their highest level since early April, while the S&P 500 index (US SPX 500 mini on FXOpen) declined by approximately 0.2% yesterday.
Since the beginning of 2025, NFLX’s share price has increased by more than 8%, showing resilience in a volatile stock market that remains sensitive to the escalation of the global trade war.
Why Is Netflix (NFLX) Gaining in Value?
The strong performance may be attributed to three key factors:
Jason Helfstein, an analyst at financial holding company Oppenheimer, believes the company likely faces “limited” risks. Netflix does not sell tradeable goods subject to tariffs and could even benefit from a potential economic downturn if consumers opt to stay home more often.
According to The Wall Street Journal, Netflix has set a target of reaching a market capitalisation of $1 trillion and doubling its revenue to $39 billion by 2030.
Positive sentiment ahead of the earnings report – yes, Netflix is one of the first to release its quarterly results.
Technical Analysis of NFLX Share Chart
The share price is moving within an upward channel (shown in blue), with strong support in 2025 provided by both the lower boundary of the channel and the $840 level – a level originating from the powerful rally at the end of 2024.
On the other hand, the price has now approached the psychological $1000 level. It is possible that, in light of the upcoming earnings release (scheduled for tomorrow, 17 April), the bulls may attempt a breakout and aim to secure a foothold in the upper half of the channel.
This article represents the opinion of the Companies operating under the FXOpen brand only. It is not to be construed as an offer, solicitation, or recommendation with respect to products and services provided by the Companies operating under the FXOpen brand, nor is it to be considered financial advice.

Netflix (NFLX): Streaming Leader Enters Momentum ZoneNetflix, Inc. (NFLX) is a global leader in streaming entertainment, offering a vast library of TV shows, movies, documentaries, and original content to subscribers in over 190 countries. With hits like Stranger Things, The Crown, and Squid Game, Netflix continues to shape pop culture and redefine how people consume media. The company is also expanding into gaming and advertising-supported tiers to grow its user base and revenue streams. As more viewers shift from traditional cable to on-demand streaming, Netflix remains at the center of digital entertainment.
The stock chart recently found support at the 0.50 Fibonacci retracement level and closed above the 0.236 line—placing it in the momentum zone. This technical setup, backed by strong volume, signals increased buying interest and suggests the potential for a continued push higher as bullish sentiment builds around the stock.

Netflix Short PositionHi traders,
Lets have a look at the Netflix 1D timeframe chart.
We can see that the price is approaching the horizontal resistance.
We expect that price will get reject at the horizontal resistance therefore, the short position can be taken
Entry, target, stop loss, are shown on the chart.
Risk/Reward ratio: 7.33

NFLX - Long Term ChannelA large channel for NFLX that I think price will remain in
I do think a bear move is coming soon before the run up plays out
This is similar to an earlier situation on the NFLX chart that I have labelled with circles in red
Weekly chart

Netflix Earnings Growth Expected As It Prepares For Q125 ResultsNetflix (NASDAQ: NASDAQ:NFLX ) is set to report its earnings for the quarter ending March 2025 on April 17. Analysts expect year-over-year growth in both revenue and earnings. However, consensus earnings per share (EPS) estimates have been revised down slightly by 0.07% over the past 30 days. This suggests a cautious outlook among analysts.
At the close on April 11, Netflix stock traded at $918.29, down by 0.31%. In after-hours trading, the price edged slightly higher to $919.80. The stock traded with a volume of 4.07 million shares. RSI stands at 47.76, reflecting neutral momentum.
The final result could trigger a sharp price move. A positive earnings surprise might push the stock higher. On the other hand, a miss could lead to a decline. The outcome will also depend on management’s commentary during the earnings call.
Technical Analysis
On the daily chart, Netflix recently bounced off a key demand zone near the $820–$830 range. This zone had previously served as a strong support area. After touching this level, the price formed a reversal candle, signaling potential buying interest.
The stock is now hovering around $918.29, near the 50-day and 100-day moving averages at $961.61 and $931.24, respectively. If the price clears these levels, it may aim for the recent high of $1,064.50. A short-term retracement could occur before a possible continuation higher.
Volume analysis shows a spike during the bounce from support, indicating accumulation. The price pattern suggests a bullish structure is forming. Overall, eyes remain on the April 17 earnings report for the next major move, which might see Netflix surge to a new all-time high.

Simple analogy if it breaks again looking for channel continueGot a few areas but don't see the upside continuation as a solid move right now but it does carry bearish sentiment until a direction is confirm, it looks like a sideway move.

Could Netflix (NFLX) Be Gearing Up for a Major Correction?Netflix has had an impressive bull run since mid-2022, but based on historical structure and price behavior, a correction could be right around the corner.
🔍 Chart Breakdown (9W Time Frame):
Current Price: ~$870
2025 Projected High: $1,064.50
No significant correction since 2022
Bearish Target Zones:
📉 Zone 1: ~$443 (-46% from current levels)
📉 Zone 2: ~$344 (-57% from current levels)
Market Structure Notes:
Bullish momentum has been non-stop for 2+ years
The last time Netflix saw a proper reset was during the 2022 market correction
If this candle breaks structure to the downside, the selloff may be fast and steep
Support Zones are clearly outlined between the 2023 lows and historical demand blocks
💬 My Prediction:
I believe Netflix is overdue for a pullback, and based on the volume and vertical structure of this bull run, we could be setting up for a mean reversion play back to strong support areas.
I’m not saying Netflix isn’t a long-term powerhouse, but even the strongest runners need to rest. Price doesn’t move in a straight line forever.
📌 Not Financial Advice — just technical breakdown and a probability-based setup.
🔖 Hashtags:
#Netflix #NFLX #StockMarket #CorrectionIncoming #BearishSetup #TechnicalAnalysis #CandlestickChart #InvestSmart #TradingView #StockPrediction #Watchlist

NFLX & chilling w/ putsUpdate to my chilling status on NFLX. 4/7/25 gap down, retest of a critical breakdown point for me 910.
Target 825-775 (this week or next week).
Overall mkt bearish due to Tariffs.
@ContraryTrader even left us a clue in my previous update (May/June).Thank you!
*The magic wand feature seems to be extra... & I love that. I'll get a handle on it. Until next time, shorting pops through earnings.

Netflix Short Idea: 30% Downside!Netflix - NASDAQ:NFLX Weekly Chart Analysis
Short Idea:
- Expanding Triangle Pattern Breakdown
- H&S Breakdown
- AVP GAP to fill
- Declining Wr%
- Red H5 with bearish Cross
Targets:
$750/ 695/ 595/ 543/ Maybe $400's
Not Financial Advice

Bearish Setup on NFLX: Correction Wave (C) UnfoldingTF: 4h
NFLX appears bearish at the moment. The corrective structure on the 4-hour timeframe suggests a potential decline. The current formation indicates that wave B likely completed at 998.61 , and the stock has now begun its descent into wave (C) of the correction.
The correction may extend to the 100% projection of wave A at 788.67 , or potentially deepen to 659.06 , aligning with the 1.618 Fibonacci extension of wave A. After the completion of wave (C), traders can buy for the target up to wave B at 998.61 .
I will continue to update the situation as it evolves.

NETFLiX: $855 | reset for next generational gainsa FRESH BEAR is as Wicked as a Bull on Steroids
money go rounds
as this is anchored to Tariff circus
money managers who invested in the last decade are booking profits
as time for retirement to enjoy life
next batch of retirees should be lucky to wait at $300 zone to hop on
markets are cycles and this one
gives the best bang for every buck both long and short players
just size in entries as this can wick you out both ways

Net FlixNetflix stock drop from $870 First target $673. Buckle up, it's a strong horror film, this is just the beginning. The next target is $485, stop loss at $1000.

$NFLX interesting setup; conflicted.Head and shoulders but some kind of support there in $870-$880? Looks good to retest $1000 as well. Hmm.
WSL

If you fail, fail fast and learn from it. Lessons learned from my mistakes.
Rule 1: Dont lose money.
Rule 2: Never forget rule 1. Warren Buffett.
Rule 3: The market is always right.
Rule 4: The trend is your friend.
Rule 5: Dont fight the trend.
Rule 6: Figure out your method of trading and stick with it.
Rule 7: Ignore the noise. Ignore the news. Ignore the narrative. The charts are EVERYTHING!
Rule 8: Understand pattern recognition, have factors, find support and resistance.
Rule 9: Dont be fooled by lies and deception.
Rule 10: Never forget Rule #1 :)

Netflix Wave Analysis – 25 March 2025Netflix Wave Analysis – 25 March 2025
- Netflix broke resistance zone
- Likely to rise to resistance level 1050.00
Netflix recently broke the resistance zone located between the resistance level 960,00 (former support from February), resistance trendline of the daily down channel from February and the 50% Fibonacci correction of the downward wave 2 from last month.
The breakout of this resistance zone accelerated the active intermediate impulse wave (3).
Given the clear daily uptrend, Netflix can be expected to rise to the next resistance level 1050.00, target price for the completion of the active impulse wave (3).

NFLX LEVELS ENDING MARCHThis is really due to pairing w TKO honestly
and I believe they will get exclusive rights to the NFL or NBA or MLB within the next 12-24 months whcih will double current revenue.
thats my outlook

NFLX eyes on $860-ish: Major Fib Cluster and Key Support to holdNFLX dropping rapidly along with the market wide pullback.
It has just hit a major fib cluster at the $859.07-865.73 zone.
If this zone fails then look lower at the $811.19-814.75 zone.
Previous Analysis that gave several entries:
========================================================
.

Netflix Gap Filled: Will the Channel Hold ?👋 What’s up, traders! Netflix is at a critical support zone—what’s your take on this setup?
🚀 Hope everyone’s having a great trading day! Here’s an interesting technical setup on NFLX. Let’s break it down together!
Netflix (NFLX) has been trading inside a well-defined ascending channel, respecting both channel resistance (upper boundary) and channel support (lower boundary). Recently, the stock experienced a sharp sell-off, leading to the completion of a major gap fill, highlighted in blue.
Historically, gap fills often act as key decision points, where price either reverses or breaks down further. Now, NFLX is testing a critical support zone at the lower boundary of the channel.
Why is this level important-:
The gap is now fully closed, removing the imbalance created by the previous breakout.
The ascending channel support is holding for now, making it a key zone for buyers.
If buyers step in, a bounce could follow, while a break below this level may lead to further downside.
Key Observations & Market Psychology-:
Gap Fill Completed: The price has fully retraced the previous breakout gap—this is often a point where traders react.
Strong Bearish Momentum: The recent decline was aggressive, showing significant selling pressure.
Volume Analysis: If buying volume increases at this level, it could indicate a potential reversal. Conversely, heavy selling volume may confirm further downside.
Confluence Factor: This support aligns with previous price action, making it a high-probability zone for a reaction. Let's discuss trading plans according to above obsevations.
Bullish Scenario (Bounce from Support)-:
If the price respects the channel support and forms a bullish reversal candlestick pattern, such as a hammer or bullish engulfing, this could trigger a bounce.
A move above $920 - $940 would indicate strength, with targets at $970 - $1,000.
A break above $1,000+ could lead to a continuation toward the channel resistance around $1,050.
Bearish Breakdown (Failure of Support)-:
If NFLX breaks below the ascending channel support with strong volume, further downside could be expected.
The next key support zone would be around $840 - $800, where buyers might step in again.
Increased selling pressure could accelerate the decline, making short positions favorable.
Educational Insight: Why Do Gap Fills Matter?
Gaps occur when price jumps between two trading sessions without any activity in between. These gaps often act as magnets, as price tends to revisit them before deciding the next trend.
Why does this happen?
Gaps represent areas of low liquidity that markets often seek to fill.
Once a gap is filled, the price either reverses strongly or continues in the direction of the trend.
Final Thoughts & Trade Approach
Netflix (NFLX) is currently at a make-or-break level, and the next few trading sessions will determine it's direction.
If buyers step in, this could be an excellent long opportunity.
If sellers push it lower, the breakdown could open doors for further downside.
What’s your take on NFLX? Will it bounce or break down? Let’s discuss in the comments!
Hope you will like the publication
Best Regards- Amit

bear call spread on NFLXWE LOOK like a head and shoulders here. The LAST time we broke below the 100 sma, we went 50% towards the 200 sma. That can / could happen again, especially with AAPL And QQQ being weak...

Elliott Wave View: Netflix (NFLX) Resumes Rally After 3 Waves CoShort term outlook in Netflix (NFLX) suggests that the ETF has ended wave IV at 853.68. Decline from 2.18.2025 high is in progress as a zigzag Elliott Wave structure. Down from 2.18.2025 high, wave ((A)) ended at 955 and wave ((B)) ended at 1000.89. Wave ((C)) lower unfolded in 5 waves impulse structure. Down from wave ((B)), wave (1) ended at 958.17 and wave (2) ended at 995.6. Wave (3) lower ended at 858.11 and wave (4) rally ended at 896.9. Final leg wave (5) ended at 853.6 which completed wave ((C)) of IV.
The stock has resumed higher in wave V, but it still needs to break above 2.18.2025 high at 1065.05 to rule out a double correction. Up from wave IV, wave (1) ended at 927.18 and wave (2) pullback ended at 887.5. The stock has resumed higher in wave (3). Up from wave (2), wave 1 ended at 917.2 and pullback in wave 2 ended at 901.27. Expect the stock to extend higher 1 more leg to end wave 3, then it should pullback in wave 4 before turning higher again. Near term, as far as pivot at 853.6 low stays intact, expect pullback to find support in 3, 7, or 11 swing for further upside.

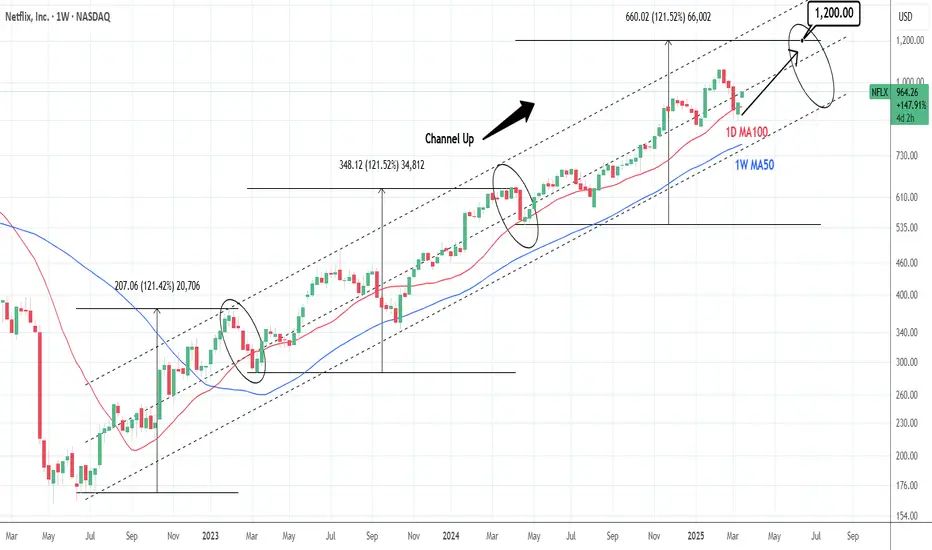
NETFLIX: Strong buy opportunity with this 1D MA100 bounce.Netflix is neutral on its 1D technical outlook (RSI = 52.399, MACD = -10.400, ADX = 30.636) and is rebounding on the 1D MA100. This is another HL on the 20 month Channel Up, which should be enough to give the stock a push to a new HH. The Channel Up is on its 3rd main bullish wave and both prior saw a +121.52% price increase. We expect the 3rd one to be completed by July. The trade is long, TP = 1,200.
## If you like our free content follow our profile to get more daily ideas. ##
## Comments and likes are greatly appreciated. ##
Netflix Caught in a Bearish Crab.The Netflix stock exhibited robust growth in 2024, primarily driven by a surge in subscribers and expansion into new markets.
However, a bearish Crab harmonic pattern has been identified on the chart, suggesting a potential significant price correction.
The pattern indicates that the stock price might initiate a decline from the 1029 level.
The XA, AB, BC, and CD legs of the pattern, defined by Fibonacci ratios, clearly outline the bearish formation. When coupled with other technical indicators, this pattern provides a compelling bearish signal for Netflix. Nevertheless, it's essential to remember that technical analysis alone is insufficient for investment decisions.
Fundamental factors, such as increasing competition, content costs, and changes in consumer preferences, should also be considered. Investors are advised to conduct thorough research and potentially consult with a financial advisor before making any investment decisions based solely on this technical analysis.
SEYED.
