NKE: Macro structure [Monthly time frame]Price reached the top of the macro support: 56-27.
The correction from Nov'21 top has a picture perfect three-wave structure that has reached area of an ideal extension to finish itself (60-44 support).
Although, within the context of todays market uncertainty, recovery from this support zone, might still be a larger bounce before one more leg-down deeper into macro support
Best of trading and investing decision and thank you for you attention!
NKE trade ideas

If you own a pair or NIKE! then this is your time #Shareholder Confessions from the Desk: Kim K Didn’t Move Nike, But Let’s Be Real…
So, it turns out Kim K’s magic touch didn’t send Nike stock into orbit. Shocking, I know. Apparently, even the queen of shapewear can’t single-handedly inflate a multi-billion-dollar company’s share price.
But let’s take a step back—because at this price, Nike is looking very interesting.
Forget the short-term noise. Nike is still the #1 IT gear for young adults and Generation Chic. You know, the people actually setting trends and spending money:
#Rappers – Because what’s a flex without fresh kicks?
#Tech bros – Coded an app? Great. Now go drop $200 on some sneakers.
#Creatives – The artists, designers, and influencers making sure you think about buying Nikes even when you’re not.
At the end of the day, Nike isn’t just a brand—it’s a lifestyle, a uniform, a status symbol. Stocks go up and down, but when it comes to culture, Nike runs the game.
So yeah, maybe the Kim K collab didn’t ignite a moonshot. But give it time. The streets, the startups, and the studios are still rocking the Swoosh. And that’s why I’m watching.
NKE Breakdown Brings Long-Term Buy Zone Into FocusNike has already been in a prolonged downtrend, but today’s 14% drop, closing at $55.58, added serious fuel to the fire — driven by tariff-related headlines and broader market pressure.
Despite the steep selloff, I’m not stepping in just yet. There’s still a lot of macro uncertainty, IMO, and with momentum and technicals working against it, I’m anticipating the possibility of additional downside.
I’ve mapped out a potential buy zone on the chart. First key support sits at $49.93, which marks the top of the zone. The lower band extends down to $35.90. It’s a wide range, but it aligns with a longer-term technical support area where I’d consider incremental, tiered buys for a long-term position.
For now, it’s on the watchlist — not the buy list. 👀

NKE: Long-term BEAR MARKET (+32 MONTHS) - A counter tradeNIKE has been in a bear market for the past 32 Months. Currently trading below EMA200 - A juicy entry without thinking. I believe this stock will reverse as the business will continue and it will face challenges with diverse competition. An easy stock to enter will have some $$$$ and then hold for 2-4 years. Sell when it gains more than 100% from your entry.

OptionsMastery: Sitting in a weekly demand on NKE!🔉Sound on!🔉
📣Make sure to watch fullscreen!📣
Thank you as always for watching my videos. I hope that you learned something very educational! Please feel free to like, share, and comment on this post. Remember only risk what you are willing to lose. Trading is very risky but it can change your life!

Nike (NKE) Game Plan: Is Now the Perfect Time to Buy?1. Technical Analysis March 2025
Nike’s stock ( NYSE:NKE ) is currently trading near a 52-week low of $63.19, signaling a bearish trend driven by weak earnings and macroeconomic challenges.
• Moving Averages: The 50-day MA is below the 200-day MA (death cross), confirming a long-term downtrend.
• Relative Strength Index (RSI): Near 30, indicating oversold conditions and a possible short-term rebound.
• Support & Resistance:
• Key support: ~$60 (historical demand zone)
• Key resistance: ~$75–$80 (previous consolidation area)
• Volume Analysis: High selling pressure, but institutional investors may step in at lower levels.
2. Fundamental Analysis March 2025
Nike remains a global leader in the sportswear industry, but recent headwinds have impacted on its financial performance.
Key Financial Metrics (Q3 2025)
• Revenue: $11.3 billion (-9% YoY)
• Net Income: Declining due to lower sales and margin compression
• EPS: Lower than expected, prompting downward revisions by analysts
• Dividend Yield: ~2.3%, with 23 consecutive years of dividend increases
• Debt-to-Equity Ratio: ~0.6, indicating moderate leverage
• Price-to-Earnings (P/E) Ratio: Lower than historical averages (~18–22x), making it relatively undervalued compared to its long-term trends
📈 Strengths:
• Brand Power & Innovation: Nike’s brand remains dominant, and new product lines (e.g., Pegasus Premium, Vomero 18) are receiving positive feedback.
• Global Reach & Direct-to-Consumer (DTC) Shift: Strong e-commerce presence, which could improve margins over time.
• Dividend Growth: 23 consecutive years of increases make Nike attractive to long-term income investors.
📉 Weaknesses & Risks:
• Declining Sales: A 9% revenue drop YoY, with a 17% decline in China—a crucial market.
• Tariff Concerns: New U.S. tariffs on Chinese imports could impact profit margins.
• Competitive Landscape: Adidas, Puma, and newer brands (On Running, Hoka) are gaining market share.
• Macroeconomic Uncertainty: Consumer spending on discretionary goods remains weak.
3. 5-Year Price Prediction (2025–2030)
Year Price Range Prediction
2025 $55 – $85 (high volatility, potential recovery)
2026 $75 – $100 (rebound if sales improve)
2027 $90 – $120 (growth phase, innovation & DTC strategy gains traction)
2028 $110 – $140 (bullish market conditions, brand strength)
2029 $130 – $170 (potential all-time highs if fundamentals align)
2030 $150 – $200 (long-term upside if Nike maintains market dominance)
Conclusion: Buy, Hold, or Sell?
• Short-Term (2025–2026): High risk, potential upside if Nike stabilizes its sales and margins.
• Mid-to-Long Term (2027–2030): Likely strong recovery, given Nike’s brand strength, innovation, and historical growth.
• Best Strategy: Dollar-cost averaging (DCA) for long-term investors; traders may wait for a confirmed reversal.
⚠️ Disclaimer:
This analysis is for informational purposes only and should not be considered financial advice. Stock market investments carry risks, including the loss of capital. Investors should conduct their own research or consult with a financial advisor before making investment decisions.

Swooshing Back?Nike Inc. (NKE) is currently testing the bottom of a significant weekly gap around the $66 level. A breakout above the $72 level could signal further strength, positioning the stock to target the $88.66 resistance. This trade setup offers an attractive risk-to-reward ratio, with a stop-loss set at $59.30 to manage downside risk.
The Relative Strength Index (RSI) for NKE was at 29.3 on March 21, 2025, indicating oversold conditions and a potential for a bounce.
Analyst sentiment remains positive, with a consensus rating of "Moderate Buy" among 32 analysts. The average 12-month price target is $87.38, indicating a potential upside of approximately 31.3% from the current price of $66.54.
This combination of technical indicators and positive analyst sentiment supports a bullish outlook for NKE, with a potential move toward the $88.66 resistance level.

NKE LongEveryone appears to be saying Nike is dead. Hmm wonder if it catches some relief here…either that or we trend lower to 60s or 50s

Nike ($NKE): Just Bought the Dip (and New Shoes)!Nike stock is at its lowest price in 5 YEARS. This could be the best sale since the clearance rack at the Nike outlet!
Nike NYSE:NKE stock is now at a 5 year low, and I don't see it going much lower from here. Here are some important facts about Nike:
Stock is at a 5-year low despite sales increasing from $37 billion to $51 billion and income doubled.
Down 63% from all-time high, despite good fundamentals.
P/E ratio is at 22. The lowest since 2018.
Forward P/E is at 33, which = growth expectations.
Price to sales is at 2.2
The price to book is at 7.6, the lowest since 2017.
EV/Sales is at 2. The lowest since 2017.
Technical indicators are signaling oversold and the price is at a support level.
All in all, it tells me that Nike is now the cheapest it has been in almost 8 years.
Nike risks and issues:
Inventory is high worldwide, and inventory movement has been slowing down.
Although high, inventory is lower than in 2022 and 2023.
Consumption might still suffer this year in the US due to austerity.
It seems that many analysts don't like the stock because sales (although growing) are growing less than expected, the business in China is slower than expected, and there is a high inventory.
Despite the issues above, what I see is an iconic brand selling at a 50% discount. Sales are up, income is up, ratios are looking good, and the company continues to be a great business, but the stock is selling at a discount. Nike will definitely not go out of business.
This is a good example of buying value at a good price!
Nike is already part of my portfolio (it has been since the Covid crash), but I'm now adding more.
If I were to start investing now, I would start with a little DCA.
Similarly to all my stock investments, I see Nike as a long term holding.
But honestly, I see Nike as an iconic brand on a 50% OFF clearance sale—too good to resist.
I went straight to the Nike store and bought two pairs of sneakers to help flush out that excess inventory. As a proud shareholder, I'm confident I'll see at least $0.01 back in dividends from my shopping spree! 😅👟
Quick reminder: This is my investing journey, not financial advice! 😊

NKETrending down, but at bottom of channel - good area to start accumulating for the inevitable short squeeze

SHORT | NKENYSE:NKE
The weekly chart of Nike (NKE) at $67.67 displays a bearish bias within a descending channel, with the price testing the lower trendline. The analyst targets a breakdown, aiming for 60$ (Target Price 1) and $49.65 (Target Price 2), supported by consistent lower highs and lows, with RSI at 41.67 indicating potential for further downside.

NKE wyckoff accumulationNYSE:NKE appears to be in an wyckoff accumulation pattern. Question for me is whether we will get another spring test or not. Keeping my eyes on possible sweep of the lows before uptrend starts.

Buy NikeIf we draw a Fibonacci chart from the very lowest point NKE has ever been at (0.1$ per share (Imagine buying at those levels)) It's clearly visible we're in a Golden zone.
Add on top of that, drawing a long term trend line, and we're basically there. Very solid entry position.
In combination with this, it's important to know the underlying trend of the business. Under former CEO John Donahoe, Nike shifted its focus toward direct-to-consumer (DTC) sales, reducing partnerships with wholesale retailers like Macy's and DSW. This strategy aimed to enhance profit margins and customer data insights but led to challenges, including increased operational costs and strained relationships with key retail partners. Recognizing these issues, Nike reinstated collaborations with major wholesalers, aiming to balance DTC initiatives with traditional retail partnerships. Elliott Hill, who began his career at Nike as an intern in 1988 and returned as CEO after retiring in 2020, brings over four decades of experience and a deep understanding of the brand's culture and operations. His longstanding commitment and comprehensive knowledge position him well to navigate the company's strategic realignments and drive sustainable growth.

NIKE INC. AMERICAN SHOOES LOOSING GLOSS, AHEAD OF U.S. RECESSIONNIKE Inc. or Nike is an American multinational company specializing in sportswear and footwear.
The company designs, develops, markets and sells athletic footwear, apparel, accessories, equipment and services.
The company was founded by William Jay Bowerman and Philip H. Knight more than 40 years ago, on January 25, 1964, and is headquartered in Beaverton, Oregon.
As of July 15, 2024, NIKE (NKE) shares were down more than 33 percent in 2024, making them a Top 5 Underperformer among all the S&P500 components.
Perhaps everything would have been "normal", and everything could be explained by the one only unsuccessful December quarter of 2023, when the Company’s revenue decreased by 2 percentage points to $12.6 billion, which turned out to be lower than analyst estimates.
But one circumstance makes everything like a "not just cuz".
This is all because among the Top Five S&P500 Outsiders, in addition to NIKE, we have also shares of another large shoe manufacturer - lululemon athletica (LULU), that losing over 44 percent in 2024.
Influence of macroeconomic factors
👉 The economic downturn hurts most merchandise retailers, but footwear companies face the greatest risk to loose profits, as higher fixed costs lead to larger profit declines when sales come under pressure.
👉 The Nasdaq US Benchmark Footwear Index has fallen more than 23 percent since the start of 2024 as consumer spending is threatened by continued rising home prices, banks' reluctance to lend, high lending rates, and high energy and energy costs. food products - weaken.
👉 In general, the above-mentioned Footwear Sub-Industry Index continues to decline for the 3rd year in a row, being at levels half as low as the maximum values of the fourth quarter of 2021.
Investment Domes worsen forecasts...
👉 In the first quarter of 2024, Goldman Sachs made adjustments to its forecast for Nike shares, lowering the target price to $120 from the previous $135, while maintaining a Buy recommendation. The company analyst cited ongoing challenges in Nike's near-term growth trajectory as the main reason for the adjustment, anticipating potential underperformance compared to market peers, noting that Nike's 2025 growth expectations have become "more conservative."
👉 Last Friday, Jefferies Financial Group cut its price target from $90.00 to $80.00, according to a report.
👉 Several other equity analysts also weighed in on NKE earlier in Q2 2024. In a research note on Friday, June 28, Barclays downgraded NIKE from an "overweight" rating to an "equal weight" rating and lowered their price target for the company from $109.00 to $80.00.
👉 BMO Capital Markets lowered their price target on NIKE from $118.00 to $100.00 and set an overweight rating on the stock in a research report on Friday, June 28th.
👉 Morgan Stanley reaffirmed an equal-weight rating and set a $79.00 price target (up from $114.00) on shares of NIKE in a research report on Friday, June 28th.
👉 Oppenheimer reiterated an outperform rating and set a $120.00 price target on shares of NIKE in a research report on Friday, June 28th.
👉 Finally, StockNews.com downgraded NIKE from a "buy" rating to a "hold" rating in a research report on Friday, June 21st.
...and it becomes a self-fulfilling prophecy
Perhaps everything would have been fine, and all the deterioration in forecasts could have been attributed to the stretching spring of price decline, if not for one circumstance - it is not the ratings that are declining due to the decline in share prices, but the shares themselves are being pushed lower and lower, as one after another depressing ones are released analytical forecasts from investment houses.
16 years ago. How it was
On January 15, 2008, shares of many shoe companies, including Nike Inc. (NKE) and Foot Locker Inc. (FL) fell after investment giant Goldman Sachs (GS) slashed its stock price targets, warning that the U.S. recession would drag down the companies' sales in 2008 as consumers spend more cautiously. "The recession will further increase the impact of the key headwind of a limited number of key commodity trends needed to fuel consumer interest in the sector," Goldman Sachs said in a note to clients.
In early 2008, Goldman downgraded athletic shoe retailer Foot Locker to "sell" from "neutral" and cut its six-month share price target from $17 to $10, saying it expected U.S. sales margins to continue to decline in 2008 despite store closures.
The downgrade was a major blow to Foot Locker, which by early 2008 had already seen its shares fall 60 percent over the previous 12 months as it struggled with declining sales due to declining demand for athletic shoes at the mall and a lack of exciting fashion trends in the market. sports shoes.
Like now, at those times Goldman retained its recommendation rating to “buy” Nike Inc shares, based on general ideas about the Company’s increasing weight over the US market, topped off with theses about the Company’s international visibility, as well as robust demand ahead of the Beijing Olympics.
However Goldman lowered its target price for the shares from $73 to $67 ( from $18.25 to $16.75, meaning two 2:1 splits in Nike stock in December 2012 and December 2015).
Although Nike, at the time of the downturn in forecasts, in fact remained largely unscathed by the decline in demand for athletic footwear among US mall retailers, it reported strong second-quarter results in December 2007 (and even beating forecasts for strong demand for its footwear in the US and growth abroad) , Goldman Sachs' forecasts for Nike's revenue and earnings per share to decline were justified.
Later Nike' shares lost about 45 percent from their 2008 peaks, and 12 months later reached a low in the first quarter of 2009 near the $40 mark ($10 per share, taking into account two stock splits).
The decline in Foot Locker shares from the 2008 peaks 2009 lows was even about 80 percent, against the backdrop of the global recession and the banking crisis of 2007-09.
Will history repeat itself this time..!? Who knows..
However, the main technical graph says, everything is moving (yet) in this direction.

$NKE - I don't think it will stay below $70 for too longNYSE:NKE is trading at its 2018 crash low, just $5 away from its 2020 COVID low. 👀
The company said that after the current quarter, things will improve.
China was down 17%, but China is going to implement stimulus measures to boost consumption.
It’s not hard to imagine China’s consumption rebound helping Nike.

NikePoor results mean Nike has broken out of a triangle pattern which started forming in March 2022.
Clean break down with large sell side volume.

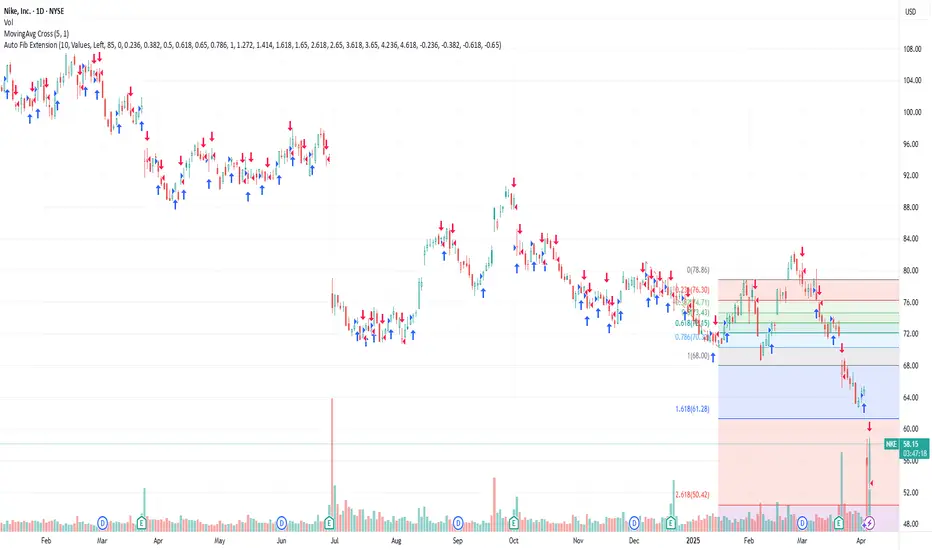
NKE Trade Alert – Earnings Shakeout = Huge Opportunity!Nike (NKE) just dropped some earnings news that could pressure the stock in the short term. A price dip = a golden buying opportunity! Smart traders are watching these levels closely.
📉 New Entry Zones:
🔥 68.00 (Buy zone)
🔥 65.00 (STRONG buy)
🔥 60.00 (Deep discount level)
🎯 Profit Targets:
✅ 78.80 📈 (Solid first target)
✅ 82.50 🚀 (Momentum play)
✅ 88.50 💰 (Moonshot!)
💡 Market volatility = trader’s dream. A dip could fuel a massive rebound. Watch for accumulation in the buy zones!
🚀 Ready to catch the bounce? Let’s trade! 💸🔥 #NKE #StockMarket #BuyTheDip
📌 Disclaimer: This is not financial advice. Always do your own research and consider consulting with a financial professional before making investment decisions. 🚨

Nike (NKE) – Bullish Outlook Nike's recent performance and technical indicators suggest a bullish trend.
1️⃣ Recent Earnings Report
In its fiscal third quarter, Nike reported:
- Revenue: $11.3 billion, a 9% decrease year-over-year but exceeding analyst expectations of $11.02 billion.
- Net Income: $800 million, down 32% from the previous year.
- Earnings Per Share (EPS): 54 cents, surpassing estimates of 28 cents.
2️⃣ Falling Wedge Formation
Technically, Nike's stock has formed a falling wedge pattern, typically indicating a potential bullish reversal. This pattern, coupled with a false breakout, suggests a possible upward price movement.
3️⃣ Analyst Forecasts
Analysts maintain a positive outlook for Nike:
- Average Price Target: $88.71, implying a 21.54% upside.
- Medium-Term Target: $100
- High-Term Target: $120
For instance, Jefferies has maintained a "Buy" rating with a price target of $115.

2/24/25 - $nke - dead money, bro. 2/24/25 :: VROCKSTAR :: NYSE:NKE
dead money, bro.
- the trends are cooked
- jefferies upgrades this to buy and you r chasing it higher on a rough risk day/week/ setup?
- trades in the high 30s PE for no EPS growth
- you really going to wait in this?
- NYSE:DECK is hard enough to own, probably the only ownable shoe co at the moment when factoring returns, growth and valuation
- don't say i didn't warn you
- it's not a short, but in the context of it's market pair (NKE/SPY)... it's a short. if i owned it, i'd clear the whole position without even thinking twice and thank mr. jefferies for being the bag holding cheerleader. donkey iq upgrade.
- and fwiw, i'm not involved. just woke up at 4am to run thru names and did the shoe complex today
- so i'm running hot on coffee and with current POV
but hey. that's the market :)
i'm the other pair of glasses, usually always
V

Nike (NKE) – Post-Earnings Growth Potential to 90 usdNike (NKE) has entered a key growth phase following its earnings report on March 20, 2025. The company exceeded market expectations in both revenue and EPS, reinforcing investor confidence in its long-term strategy.
🚀 Key Growth Drivers:
Strong Earnings Performance: Nike reported an EPS of $0.72 (+5.8% YoY), surpassing market forecasts.
Digital Expansion: Online sales grew by 18%, highlighting the effectiveness of its digital strategy.
China Market Growth: Nike continues to strengthen its presence in China, recording a 12% revenue increase.
Leadership Strategy: CEO Elliott Hill’s focus on wholesale partnerships and product innovation is delivering early success.

$NKE: Nike – Sprinting to Gains or Stumbling?(1/9)
Good evening, everyone! 🌙 NYSE:NKE : Nike – Sprinting to Gains or Stumbling?
With NKE at $73 ahead of Q3 earnings, is this sportswear giant ready to run or tripping up? Let’s lace up and find out! 🔍
(2/9) – PRICE PERFORMANCE 📊
• Current Price: $ 73 as of Mar 19, 2025 💰
• Recent Move: Down from $102.49 high, above $68.63 low, per data 📏
• Sector Trend: Footwear sector volatile with trade tensions 🌟
It’s a rocky track—value might be in stride! ⚙️
(3/9) – MARKET POSITION 📈
• Market Cap: Approx $116B (web ID: 15) 🏆
• Operations: Global leader in footwear, apparel ⏰
• Trend: Strong brand, innovation focus, per data 🎯
Firm in sportswear, but facing headwinds! 🏃♂️
(4/9) – KEY DEVELOPMENTS 🔑
• Q3 FY2025 Earnings: Due Mar 20, $11.02B revenue expected, per data 🌍
• Market Sentiment: Bearish short-term, per posts on X 📋
• Price Action: Down 9.78% in 10 days, per data 💡
Racing toward earnings with caution! 🏁
(5/9) – RISKS IN FOCUS ⚡
• Trade Tensions: U.S.-China tariffs hit margins, per data 🔍
• Economic Slowdown: Consumer spending at risk 📉
• Competition: Adidas, Skims gaining ground ❄️
It’s a tough race—watch the pace! 🛑
(6/9) – SWOT: STRENGTHS 💪
• Brand Power: Global sportswear leader 🥇
• Innovation: NikeSKIMS, new products, per data 📊
• Dividend: 2.03% yield draws income fans 🔧
Got the gear to win! 🏀
(7/9) – SWOT: WEAKNESSES & OPPORTUNITIES ⚖️
• Weaknesses: Bearish sentiment, volatility 📉
• Opportunities: Q3 earnings beat, tech rebound 📈
Can it jump the hurdles or stumble? 🤔
(8/9) – POLL TIME! 📢
NKE at $73 your take? 🗳️
• Bullish: $85+ soon, earnings spark 🐂
• Neutral: Steady, risks balance out ⚖️
• Bearish: $65 looms, market slips 🐻
Chime in below! 👇
(9/9) – FINAL TAKEAWAY 🎯
NKE’s $73 price tags a volatile sportswear play 📈, but brand strength keeps it in the race 🌿. Dips are our DCA sweet spot 💰—buy low, run high! Gem or bust?

NIKE LONG TERM BUY IDEAWe are close to our significant demand level. Hoping that the earnings report pushes this stock down further so we can buy this stock in our golden zone.

NIKE - will the best sportswear deliver?Nike (NYSE: NKE) remains a strong investment choice, driven by its market leadership, brand strength, and impressive financial consistency. With 95% positive quarters since Q2 2021, Nike has demonstrated resilience, profitability, and long-term growth potential. Here’s why it remains an attractive stock:
1. Consistent Financial Performance
Nike’s ability to deliver 95% positive quarters since Q2 2021 highlights its financial stability and strong management. The company has consistently outperformed expectations, maintaining steady revenue growth and profitability even in challenging economic conditions.
2. Global Brand Power
As the world’s leading sportswear brand, Nike commands strong customer loyalty and dominates the athletic apparel and footwear markets. Its global reach, premium pricing power, and continuous product innovation keep it ahead of competitors.
3. Expanding Digital & Direct-to-Consumer Sales
Nike’s digital transformation is driving significant revenue growth. Its direct-to-consumer (DTC) business, including the Nike app and online sales, has improved margins and strengthened customer engagement, making it less reliant on third-party retailers.
4. Strong Market Position & Innovation
Nike continues to lead in innovation with advancements in sustainability, performance gear, and technology-driven products. With ongoing investments in AI, automation, and eco-friendly materials, the company stays ahead in a competitive industry.
5. Long-Term Growth Potential
Nike’s strong brand equity, global expansion, and continued investment in emerging markets position it for sustained growth. Coupled with its impressive track record of positive quarters, Nike remains a reliable and strategic long-term investment.
Entry: 73
Target 107 (the target is set up around the very strong resistance area, if that area is broken we can deffinetely see more momentum to the upside!
SL:55 (Below the strong support area so we can protect the trade)
