C&H Earnings AMCIt is always risky to trade on earnings so do your own research on this one!
This stock rose from the bottom in an ascending wedge pattern/irrational exuberance, but has fallen out of that wedge, just not quite as far as I would have hoped. It is also in an ascending triangle with some tough R at 105.6 (ish)
Hypothetical Breakout: 106
Stop below handle low: Under 93
Target 1: 121 to 132
Target 2: 164 to 175
Be safe!
NKE trade ideas

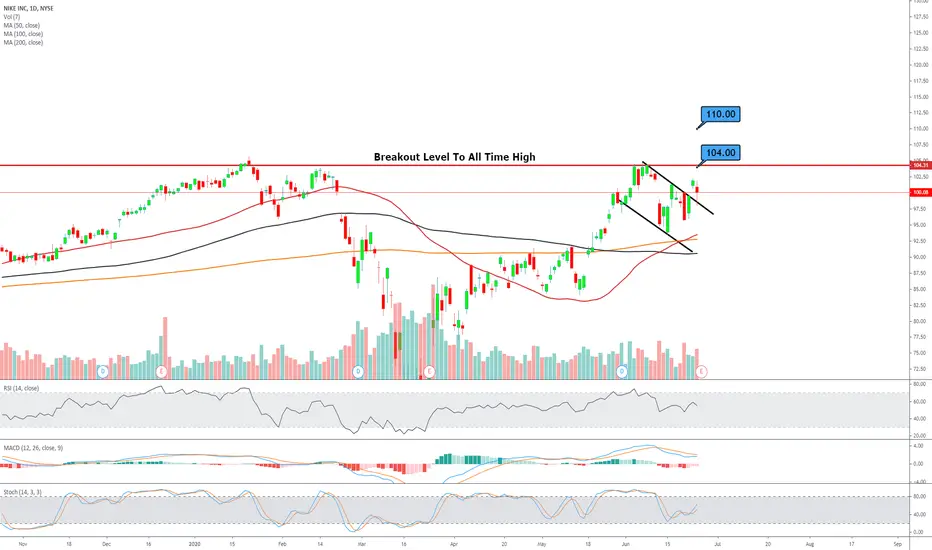
$NIKE $110 price target
Not the ideal timing for NIKE earnings as the market has turned somewhat sour.
Expectations are high and Nike may be seen as a safe bet in uncertain times.
Breakout target $110
buy a fresh pair of nike sneakers or you can trade it.I have decided to start trading nike instead of checking out the latest fresh sneakers.
Im using basic technicals analysis to try and see if i can test the pulse of the asset.
According to news ( found on tradingview.com ) this asset is looking bearish but only the monday open and close of the day would determine if my analysis is correct or does my strategy needs abit more fine tuning
Nike should be dropping but im waiting for the asian session to create inititial high and low and that will be my confirmation.
Follow up post to confirm entry . Stay tuned
WaveMakers.Inc

Nike - A SneakerHeads TA We're expecting a slight retrace in the whole market as it takes a breather from the crazy run it has had since the pandemic started. RSI levels went through the roof, the market is trying for a V shaped recovery, but we have what is expected to be the worst earnings season ever a few weeks out. Until then we'll most likely be jumping in and out of positions for quick swing trades.
Taking a look at Nike. It has proven time and time again to be wary of shorting stocks with cult like followings (Apple, TSLA, Amzn, NFLX). Even when the numbers disappoint, consumers continue to use these stocks and praise the product defying financial statistics. Nike is no different and the SneakerHead following proves this. Even if we see a drop coming we would expect the cult to buy the shares back up.
TA:
With the above being said, looking at the TA, for the moment we'll be looking for a quick swing trade entry loading up between $90-$94 region with a tight stop at $88.50, taking profit at the $104 range where we got our most recent resistance. We see Nike has been holding the 55MA, RSI has fallen back into neutral territory, and the DMI and the TTM appear to be gearing up for a squeeze.
Hit us with a like and a follow for more updates. Cheers!
Disclaimer:
I do not provide personal investment advice and I am not a qualified licensed investment advisor. I am an amateur investor.
All information found here, including any ideas, opinions, views, predictions, forecasts, commentaries, suggestions, or stock picks, expressed or implied herein, are for informational, entertainment or educational purposes only and should not be construed as personal investment advice. While the information provided is believed to be accurate, it may include errors or inaccuracies. I will not and cannot be held liable for any actions you take as a result of anything you read here.
Conduct your own due diligence, or consult a licensed financial advisor or broker before making any and all investment decisions. Any investments, trades, speculations, or decisions made on the basis of any information found on here, expressed or implied herein, are committed at your own risk, financial or otherwise.

nike analysis in 15 min SELLmy be the chart will go up and testing the vwap but will go down agin the signal its for sell here

#Nike - Bubble has Burst!! 6M chart printing a Hanging Man & with the parabolic move it has had only way is DOWN!!!
there is also bearish divs printed along with it there a clear double top on monthly chart

Nike should take a breakThe only way to change the bear to bull is with strong stimulus economic package by Fed

Nike Weekly Elliott Wave Perspective Do not ever Forget the content on all of our analysis are subject to change at any time without notice, and is provided for the sole purpose of assisting traders to make independent investment decisions.
Please support us to help more people..


$NKE Seeks to Complete the Full VNKE has broken above sloped and price-level resistance in recent days, and now sits within a pitching wedge of new all-time highs.


NKE - swing puts - pull back should follow soonStock is at resistance. Except for an overnight gap to all time highs, the stops would be over 100.25 (close before "V") and over 100.69 (5/28 high). Even if stock moves up to 103-105, it should turn down back to 94-96 range.
Check RSI and price on 30 or 60 min chart.

2degreez - NKE - Tough Short but a Short is a ShortNKE is a tough short but it appears ready for a short term retrace back down to the bottom of its current trend.
Info is labeled on the chart.
stoch, ttmsqueeze & macd overbought and appear exhausted and headed back down.
This Content is for informational and educational purposes only. This is not in any way, shape or form financial or trading advice.
Good luck, happy trading and stay chill,
2degreez

Price above MA 50, MA 100 and MA 200Price above MA 50, MA 100 and MA 200, Good to go long at market, with an initial target @ 96.55 and a long term target @ 102.25 Trade invalid if price closes below 90.00 (daily)

hello friends , this is my idea about Nike stock price movement
My first analyze ever in trading views, this my idea about Nike stock weekly price movement
Write your comments and questions and also you can share your idea
Thanks for your support and comments under my first idea on this platform.


NKE 19/05/2020NKE,this closure does not please this star, it has broken the box but it would be a better candle shape.


nike chart analysishello friends , this is my idea about nike stock price movement in future , hope it was be a useful for traders

Buy to NIKE Daily Hello traders,NIKE is on an uptrend, if it pulls back it is very likely that the market will turn around to give a strong sign of purchase...
Please LIKE & FOLLOW, thank you!

NKE aiming for the moonNKE is In a current uptrend. Once it pasts and holds above $90.68 the stock is going to skyrocket.
