Nike - This is the bottom!💉Nike ( NYSE:NKE ) creates the bottom now:
🔎Analysis summary:
More than four years ago, Nike created its previous all time high. We have been witnessing a downtrend ever since and a correction of about -70%. But with the recent retest of an important horizontal structure and bullish confirmat
1.49 USD
2.74 B USD
39.55 B USD
About Nike
Sector
Industry
CEO
Elliott J. Hill
Website
Headquarters
Beaverton
Founded
1964
ISIN
ARDEUT111341
FIGI
BBG000HG0S03
NIKE, Inc. engages in the design, development, marketing, and sale of athletic footwear, apparel, accessories, equipment, and services. It operates through the following segments: North America, Europe, Middle East, and Africa (EMEA), Greater China, Asia Pacific and Latin America (APLA), Global Brand Divisions, Converse, and Corporate. The North America, EMEA, Greater China, and APLA segments refer to the design, development, marketing, and selling of athletic footwear, apparel, and equipment. The Global Brand Divisions segment represents its NIKE Brand licensing businesses. The Converse segment designs, markets, licenses, and sells casual sneakers, apparel, and accessories. The Corporate segment is composed of unallocated general and administrative expenses. The company was founded by William Jay Bowerman and Philip Hampson Knight on January 25, 1964 and is headquartered in Beaverton, OR.
Related stocks

Nike is a screaming BUY with target above 80$ in the short termSummary: In short NKE is on reversal mode to the upside and 80$ is on the horizon and 100$+ by next quarter Earnings call which is an upside over 40% NYSE:NKE
Nike (NKE): Technical Strength Above the 200 SMA 🟢
Nike (NKE): Recent Earnings Overview 🏅
Above the 200-Day Simple Moving Average (S

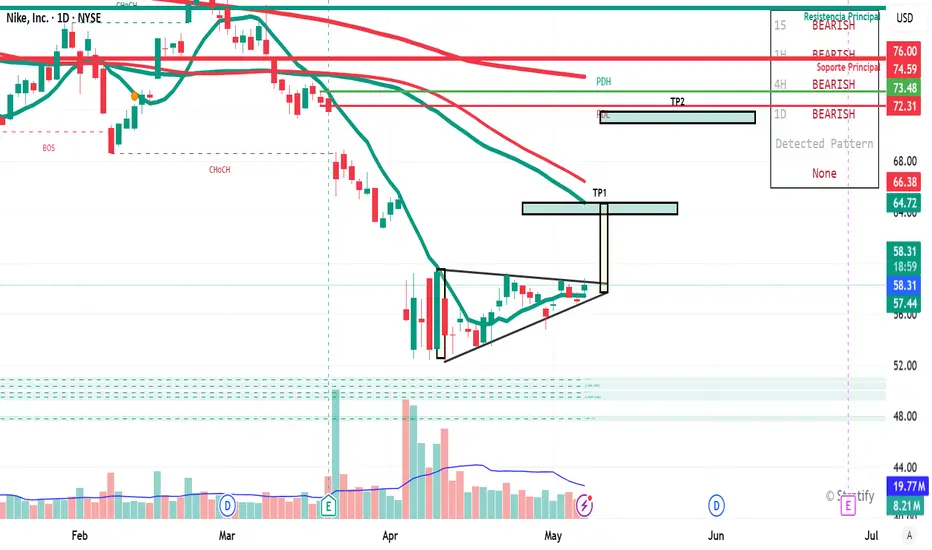
Possible Scenarios for Nike🔺 Pattern:
An ascending triangle is forming, which is a bullish technical pattern if it breaks out with volume above the resistance level.
The TP1 (Take Profit 1) marked in the $64.72–$66.38 USD zone is logical and aligns with previous resistance levels.
🟢 Bullish Signals:
Imminent triangle break
Break of downward sloping channel LongNike has swept liquidity and is now showing a strong bounce to the upside.
Although I didn’t manage to enter the initial long, I am monitoring for a break above the current downward-sloping channel. A clean breakout followed by a retest would provide a more reliable entry point. I’m not aiming to c

NKE Pullback-I'm Buying the DipNike (NKE) is under pressure — post-earnings volatility, macro noise, and sentiment all weighing in. But for swing traders, this looks like a textbook accumulation setup.
📌 Entry Zones I’m Targeting:
🔹 $70.00
🔹 $65.00
🔹 $60.00
Profit Targets (Taking wins before 88):
✅ $78.80
✅ $82.50
Let the m

Long NKE on pull back after break?Nke just woke investors back up with their recent forecast after earnings. This push has temporarily broken the down trend on the daily time frame and it is holding the break on the weekly. We now have a healthy-looking retest with the rsi on the daily time frame above 50 signaling a bounce is comin

Nike Looks Ready — A Smart Time to Consider InvestingOn the monthly chart, NIKE has been in a downtrend since November 2021, but the signs are pointing toward a potential trend reversal. Here's why I believe the bottom may already be in:
✅ MACD Histogram shows a strong positive divergence, signaling weakening bearish momentum.
✅ The RSI downtrend

NKE is a SELL here!Short term overbought, longer term nasty chart and tariff issues courtesy #donthecon because after all boys and girls "trade wars are easy to win" He hasn't won yet as he's been preoccupied ending the Ukraine war "day 1" and counting all the money Mexico sent to pay for the wall

NKE - Fallen-Angel reversal + weekly divergence - LongNKE - Nike from Smart Money divergent scanner back on the 15th of April. It's also a fallen angel pattern; it's rolled up beautifully and hitting its first target. Some small insider buying.

$NKE Tradespoon – Long Entry $76.39Tradespoon model generated long signal for NYSE:NKE . Predicted range: $76.39–$80.79. Trend: +2.78%. NYSE:NKE

See all ideas
Summarizing what the indicators are suggesting.
Oscillators
Neutral
SellBuy
Strong sellStrong buy
Strong sellSellNeutralBuyStrong buy
Oscillators
Neutral
SellBuy
Strong sellStrong buy
Strong sellSellNeutralBuyStrong buy
Summary
Neutral
SellBuy
Strong sellStrong buy
Strong sellSellNeutralBuyStrong buy
Summary
Neutral
SellBuy
Strong sellStrong buy
Strong sellSellNeutralBuyStrong buy
Summary
Neutral
SellBuy
Strong sellStrong buy
Strong sellSellNeutralBuyStrong buy
Moving Averages
Neutral
SellBuy
Strong sellStrong buy
Strong sellSellNeutralBuyStrong buy
Moving Averages
Neutral
SellBuy
Strong sellStrong buy
Strong sellSellNeutralBuyStrong buy
Displays a symbol's price movements over previous years to identify recurring trends.
US654106AG8
NIKE 16/46Yield to maturity
6.59%
Maturity date
Nov 1, 2046
NKE4971170
NIKE, Inc. 3.375% 27-MAR-2050Yield to maturity
6.57%
Maturity date
Mar 27, 2050
NKEB
NIKE 15/45Yield to maturity
6.28%
Maturity date
Nov 1, 2045
NKEA
NIKE 13/43Yield to maturity
6.21%
Maturity date
May 1, 2043
NKE4971169
NIKE, Inc. 3.25% 27-MAR-2040Yield to maturity
5.92%
Maturity date
Mar 27, 2040
NKE4971168
NIKE, Inc. 2.85% 27-MAR-2030Yield to maturity
4.41%
Maturity date
Mar 27, 2030
US654106AF0
NIKE 16/26Yield to maturity
4.35%
Maturity date
Nov 1, 2026
NKE4971167
NIKE, Inc. 2.75% 27-MAR-2027Yield to maturity
4.22%
Maturity date
Mar 27, 2027
See all NKED bonds
Curated watchlists where NKED is featured.


