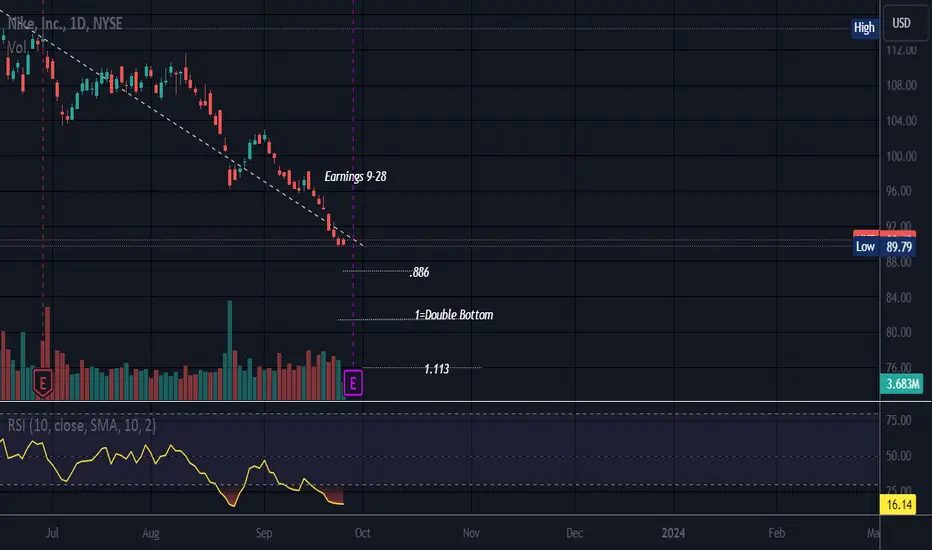
NKE NIKE Options Ahead of EarningsIf you haven`t sold NKE here:
Then analyzing the options chain and the chart patterns of NKE NIKE Options prior to the earnings report this week,
I would consider purchasing the 89usd strike price Puts with
an expiration date of 2023-9-29,
for a premium of approximately $2.13.
If these options prove to be profitable prior to the earnings release, I would sell at least half of them.
Looking forward to read your opinion about it.
NKED trade ideas

Deeply OversoldThis stock has taken some punishment as of late.
It is oversold but securities can remain oversold or overbought for extended periods.
Short is low at just over 1%.
Possible M pattern forming.
Earnings are Thursday AMC.
Perhaps earnings will be outstanding but retail does not seem to be in favor right now, and even dirt can get cheaper )o:
No recommendation
$NKE - Watch these areas for entry or DCANYSE:NKE is quite oversold. There are two possible areas for a reversal:
$88
$82
If you are waiting to BUY Nike, watch these two areas for signs of price stabilization.
The earnings report (ER) is scheduled for 09/28.

NIKE : Adding onto the positionNike, Inc. is undeniably a global powerhouse in the athletic footwear and apparel industry, boasting a strong presence in the S&P 500 and a legion of celebrity endorsements.
Pros:
Strong Business Moat: Nike's brand recognition, innovation, and global reach create a formidable competitive advantage. This moat suggests that the company can maintain its market leadership even in the face of competition.
Long-Term Potential: With its established brand and global footprint, Nike has demonstrated its ability to weather economic storms and remain a relevant player in the industry. This stability makes it a compelling choice for long-term investors.
Share Buybacks: While buying back shares at an expensive valuation can be a double-edged sword, it signals management's confidence in the company's future growth prospects. This can be seen as a positive indicator.
Premium Valuation: Companies with strong moats like Nike often command premium valuations, which can potentially translate into robust returns for shareholders.
S&P 500 Inclusion: Being part of the S&P 500 index gives Nike added credibility and attractiveness to institutional investors.
Celebrity Endorsements: Nike's association with celebrities and athletes not only enhances its brand image but also broadens its appeal among diverse consumer segments.
Low Net Debt: A healthy balance sheet with low net debt reduces financial risks and provides flexibility for future investments or acquisitions.
Cons:
Decreasing Gross Margin: Nike has faced challenges with decreasing gross margins due to factors like rising raw material costs, increased labor expenses, and escalating logistics and shipping costs. These issues can squeeze profitability.
Strong US Dollar Impact: Exchange rate fluctuations, particularly a strong US dollar, can adversely affect Nike's international sales and profitability.
Economic Slowdown: As a provider of discretionary products, Nike is vulnerable to economic downturns, which can lead to decreased consumer spending on non-essential items.
Competition: While Nike enjoys a strong position in the market, it faces niche competition from various brands, which can chip away at its market share.
Global Challenges: Issues such as geopolitical tensions, trade disputes, and supply chain disruptions can impact Nike's growth and profitability, given its global operations.
Conclusion:
In conclusion, Nike stands as a market leader with a solid business moat, global recognition, and celebrity endorsements. Despite some headwinds, including decreasing gross margins and economic uncertainties, the company remains technically sound and offers a compelling long-term investment opportunity.
Investors should be aware of the risks but also recognize that strong brands like Nike often navigate challenges successfully over time. If the stock's valuation becomes more attractive in the future, I might even considering adding more into the stock.
As of now my total holding in the stock has summed up to about 2.5% of my capital.

Earnings JournalAT A GLANCE
Simplistic Analysis: mean reversion/swing back to the centerline.
Earnings Anticipations: positive surprises for EPS & Revenues.
Trade Type: Touch & Go don't wait for a close.
Research Depth: technical glance only.

Nike, Inc. (‘NKE’)Shares of Nike, Inc. (symbol ‘NKE’) have managed to have an overall balanced performance throughout the quarter but have declined around 7% since the beginning of the month. The company’s earnings report for the fiscal quarter ending August 2023 is due for release on Thursday 28th of September , after market close. The consensus EPS is $0.73, against $0.93 of the same quarter last year.
‘ The company has a relatively positive financial image to display with the total assets outweighing the total liabilities at a ratio of 1.6 : 1 while the current ratio is at an outstanding 272% meaning that the company has the ability to repay its short term liabilities with the assets currently in possession. On the other hand the debt makes up for around 38% of the total liabilities which is generally not very good news for investors. ‘ said Antreas Themistokleous, trading specialist at Exness.
From the technical analysis perspective the price is trading below all the technical indicators of moving averages and the bearish trendline making the outlook in the near short term rather bearish. The faster moving average (50 days) is trading well below the slower one ( 200 days) further validating the bearish narrative for the company share.
On the contrary the Stochastic oscillator is in the extreme oversold territory while the lower band of the Bollinger bands could act as a short term support level. Both of this indications could point to a minor correction to the upside but nothing major at least for the coming sessions.

Nike is about to test strong supportNike is about to test strong support
This chart shows the weekly candle chart of Nike's stock over the past four years. The graph overlays the bottom to top golden section at the beginning of 2020. As shown in the figure, Nike's stock has hit its lowest point in recent years, hitting the 2.618 level of the bottom up golden section in the figure. The low point in October last year hit the 0.500 level of the bottom up golden section in the figure, and the high point in January this year hit the 1.618 level of the bottom up golden section in the figure! So, in the future, the bottom of the graph should be used as the dividing line for judging the strength of Nike's stock, which is 0.618 on the golden section!

Nike bull setup The primary idea here is to long the impulse move up from 81 to 130 usd in the retrace for a potential cell wave c/3
the alternative is that it is a new 1-2 setup
The wxyxz down could also be a new impulse but should be completed in a high interest zone and thus the trade should at least pull to breakeven even if my idea is not correct.
nfa

NIKE - BEARISH SCENARIODuring Nike's recent annual meeting, shareholders rejected a proposal from Arjuna Capital that called for increased transparency in pay equity data for female and minority employees. This proposal did not receive the required majority vote to pass. Nike has faced growing pressure for supply chain transparency, including calls to compensate workers in Cambodia and Thailand for COVID-19-related wage losses. Nike stated it hasn't sourced products from the Cambodian factory since 2006 and found no evidence of owed wages to Thai workers.
Cancel culture may play a crucial role in the future value of the shares as it already happened to a few Fortune 500 gains.

Target 107.79Following daily chart.
Got a long signal both of my indicators.
TP1 - 106.44
TP2 - 107.79
TP3 - EMA100 doesn't depend on price.
SL - Following indicator SL but under 97.37 daily close, you can stop also.

Nike Monumental Macro TA FindingsHi guys! This is a look into Monumental MACRO developments occuring in Nike stock market structure, some of which are happening for the 1st time in history.
For this reason and in my opinion, its a very important time to keep eyes on Price action.
The aim is to briefly go over what those developments are and what it may mean for NIKE's Current market trend. Hopefully providing insights for investors.
For this analysis, we are looking at Hieken Ashi candles on the 6 month timeframe.
Note that: Our current candle will close in January 2024. So it has alot of room to change by the time the candle closes.
Ive chosen Hieken Ashi candles to provide clarity in patterns of trend that occured in Nike's History.
Our major development is that we have broken down BELOW and confirmed resistance against our MAJOR MAJOR Historical Support Trendline for all of Nike's Market History.
This is the 1st time we have ever done this.
It warrents caution as this signifies Major Trend Change, perhaps even macro trend reversal.
While we were above the Spport line, we knew that everytime we came down we would atleast test that line.
Now that we are BELOW it, we need price to find the next support.
Currently ive highlighted by a Black Support Trendline, that very support area. We've maintained support since January 2020.
This line coincides with another black line that marks Resistance.
When combining these 2 black lines, we have ourselves a Symmetrical Triangle. That is very likely to play out sooner or later.
If we are able to break above it, it may be probable for us to get back ABOVE the MAJOR SUPPORT Orange line, continuing our Uptrend.
If we break below, further declines will occur. Further supporting the idea of a Major Trend Reversal.
We are also currently at 4 Red candles in a row. If you notice previous history, 4 in a row has happened only 1 other time. July 83 to Jan 85. And also notice that the 3rd candle of the sequence indicated market bottom with the 4th candle printing a higher low.
Can that be the case for us now? Maybe but things in the past don't have to repeat.
Being inside of the symmetrical triangle, 4 red candles in a row would warrant me to NOT take any investment positions.
In my opinion, if we break out on the upside of the symmetrical triangle and preferably get back above "Orange support line", would i consider taking positions.
I think as of now however, we are at best more likely to either move in a range/ sideways or see further declines as the worst case.
Why i think this, is because of the STOCH RSI.
Notice how we are below the 20 level with a bearish cross/signal.
The last time we did this, we were in here for multiple years which led to moving in a range for many years before continuing to make all time highs.
Within range our, price dropped from the top about 67% to bottom of the range.
If we continue the previous pattern, the same is likely. Hypothetically, we can also drop 60% to $70.00 level, which is a support area.
For that to not happen we would need a BULLISH cross ABOVE the 20 level.
Also notice the RSI, we are currently at the lowest level in all of NIKE history. We are also in an RSI range that coincides with sideways or range bound action.
__________________________________________________________________________________
Thank you for taking the time to read my analysis. Hope it helped keep you informed. Please do support my ideas by boosting, following me and commenting. Thanks again.
Stay tuned for more updates on ETSY in the near future.
If you have any questions, do reach out. Thank you again.
DISCLAIMER: This is not financial advice, i am not a financial advisor. The thoughts expressed in the posts are my opinion and for educational purposes. Do not use my ideas for the basis of your trading strategy, make sure to work out your own strategy and when trading always spend majority of your time on risk management strategy.

Nike - Bottom or ABC?Nike is close to an important level which will determine if a bottom formation is completed or a further slump will occur. Currently a DBW formation is build after almost perfect a Dopple Top Formation has been finished. Currently we are close to the 4 level, the current local low. The RSI is close to oversell, which support the turn around idea, which may result into a W formation whose execution would probably trigger the 5 and the DBW activation. On the bearish side a potential running ABC pattern can be found fitting perfect into the chart and the Fibonacci patterns.

NKE: We continue to correctOn the chart, there is a descending channel + Elliot correction. Plans to go even lower
Good luck to everyone, if you liked it - subscribe.

NKE Long Setup Corrections usually end at 76 fibs and usually the first pullback from that should end a the 61 fib.
At this point, we can buy NKE with a stop under the 76. If we’re right, we should see i go green and say green soon after the entry.
Trading Signal
Long 98
Stop 74
Target 442

$NKE Head & Shoulders Pattern Triggered"Head & Shoulders" pattern, and mentioning the ticker symbol " NYSE:NKE ," which represents Nike, Inc., a well-known athletic apparel and footwear company. The "Head & Shoulders" pattern is a technical chart pattern that traders and analysts often use to predict potential trend reversals in stock prices.
The Head & Shoulders pattern typically consists of three peaks or highs: a higher peak (the "head") between two lower peaks (the "shoulders"). This pattern is considered bearish, indicating a potential reversal from an upward trend to a downward trend. The pattern is triggered when the price breaks below the neckline, which is a support level connecting the lows of the shoulders.

$NKE Double BottomNYSE:NKE recently experienced an unprecedented 9-day losing streak, marking a historic occurrence in their trading history. According to technical analysis, a Double Bottom pattern is emerging, emphasizing the significance of maintaining a weekly close above the horizontal support line. This pattern suggests potential bullish momentum if the specified level is upheld.

NKE long at the supportHello traders,
Today let's have a look at NKE stock on 4h time frame.
NKE shows some weakness .
We believe that the price will retest the support and 103,60 will be an entry for a long position.
After retesting the support, we expect the price to increase and continue ranging.
2 targets and stop loss are shown on the chart

$NKE - Can it breakout?NYSE:NKE has been consolidating in a tight range.
Breaking above $111 would be bullish. Breaking below $104 would be bearish.
Upside targets: $114, $120
Downside risk: $104.
I am long.

$Nike... why dont you just do it Nike to 112 this week ? we saw a nice accumulation between 106 and 110, now volume starting to come up. i love the box strategy. id love a nice strong bullish candle this week going to 112, hopefully can fill that area.

Buying Nike at trend of higher lows.Nike - 30d expiry - We look to Buy at 104.54 (stop at 100.74)
The trend of higher lows is located at 104.50.
The primary trend remains bullish.
This is currently an actively traded stock.
This stock has seen good sales growth.
Dips continue to attract buyers.
Our profit targets will be 114.04 and 116.04
Resistance: 110.85 / 114.76 / 117.00
Support: 107.00 / 105.00 / 102.90
Please be advised that the information presented on TradingView is provided to Vantage (‘Vantage Global Limited’, ‘we’) by a third-party provider (‘Everest Fortune Group’). Please be reminded that you are solely responsible for the trading decisions on your account. There is a very high degree of risk involved in trading. Any information and/or content is intended entirely for research, educational and informational purposes only and does not constitute investment or consultation advice or investment strategy. The information is not tailored to the investment needs of any specific person and therefore does not involve a consideration of any of the investment objectives, financial situation or needs of any viewer that may receive it. Kindly also note that past performance is not a reliable indicator of future results. Actual results may differ materially from those anticipated in forward-looking or past performance statements. We assume no liability as to the accuracy or completeness of any of the information and/or content provided herein and the Company cannot be held responsible for any omission, mistake nor for any loss or damage including without limitation to any loss of profit which may arise from reliance on any information supplied by Everest Fortune Group.

Nike short? Strong negative chart formationNike has performed really bad in the last 2 years and it looks like it will not get better. The current chart formation (i call it M-bounce, dont know the "official" name) indicates a strong sell Signal if the price falls below 103$
the potential fall height: 16% to the last low and 40% to the corona low

NKE weekly long ideaNKE is creating liquidity at 100's. a quick pullback to 100 and bounce will confirm a bullish presence and it could move to 160s based on supply and demand.
If this works out we will get a 3.5R trade.

Nike is in bearish cycle for long termHi Everyone
Welcome to todays trading idea, this is an long term prediction. Nike an us based company, currently making an bearish cycle. You can trade in small amount for investments.
Let me know if you have any question related to forecast.
Thank You
