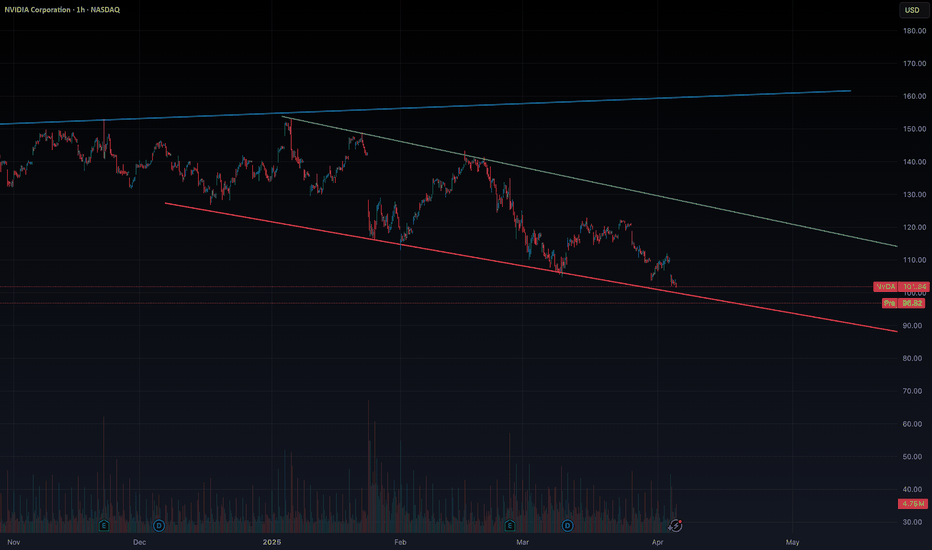
NVDA’s Final Act: A Breakout Waiting to HappenNVDA appears to be nearing the completion of its corrective phase, setting the stage for a potential move to new highs. The current pattern resembles a falling wedge, indicative of an ending diagonal formation, which often signals a reversal and the start of an upward trend.
The structure of the corrective channel, along with the termination of the diagonal pattern, suggests a high likelihood of a running flat formation. Buyers are likely to intensify demand pressure as the price approaches the lower boundary of the trendline. A trend reversal may occur if there is a decisive breakout above the Wave 4 level of the ending diagonal.
Buying opportunity with minimal stop is possible after the reversal from lower side of the channel. Targets can be 112 - 120 - 132 - 140.
I'll be sharing more details shortly.
NVDAD trade ideas
$NVIDIA ─ Wyckoff Distribution #4 aka Rising Wedge PatternVANTAGE:NVIDIA ─ Wyckoff Distribution #4 aka Rising Wedge Pattern
Although Rising wedge turning into more like Rising Channel distribution idea is still valid.
#2 Long Trade TP1 Hit so far 🔥
------------
------------
Note: This is the most positive outcome possible.
As always, my play is:
✅ 50% out at TP1
✅ Move SL to entry
✅ Pre-set the rest of the position across remaining TPs
It's important to take profits along the way and not turn a winning trade into a losing trade.
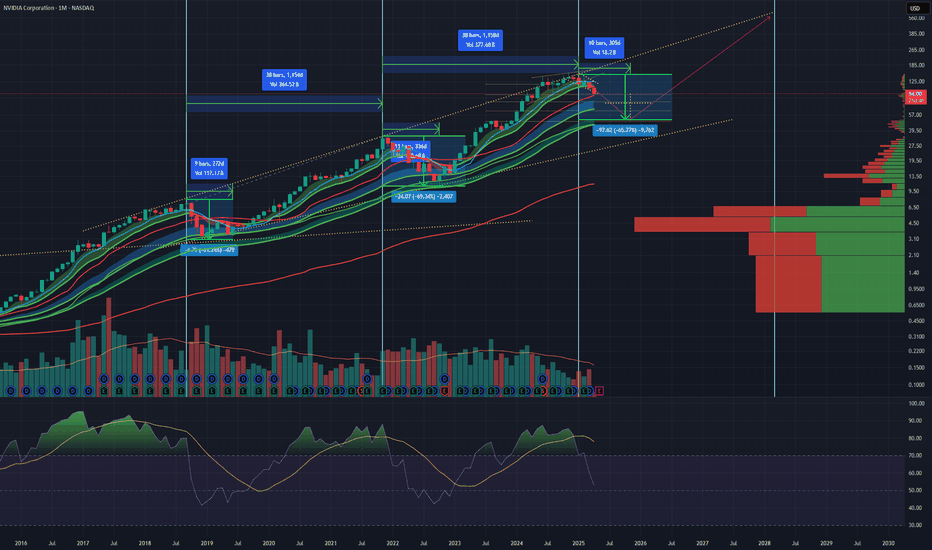
NVDA Major Trend BreakNVDA finally broke down below its major uptrend it has been in since February 2024. It did move below briefly recently during the DeepSeek sell off, but quickly reclaimed. This time it has fallen much farther below so I'd say it's a bit more concerning for bulls. It did bounce and hold right around that low it made the last time it broke, but this looks like a stronger break that has a better chance of staying below.
This is mission critical for the broader market and if it can't reclaim quickly, it is likely a signal of a longer term correction for the stock itself and the entire market. It will be very important to watch moving forward. First downside targets are 97.40 (previous double top and ATH) and 90.69 (August 2024 low).
NVDA Slams into Key Gamma Wall After Tariff Shock. Cont. down?NVDA Slams into Key Gamma Wall After Tariff Shock – Breakdown or Bounce?
🧠 Macro Backdrop:
Today’s broad market sell-off was triggered by news of Trump proposing tariffs, sparking risk-off sentiment, especially in tech and semiconductors like NVDA. The fear of supply chain inflation and global trade disruption hit momentum stocks hard.
This news matters because:
* NVDA is a major global chip exporter.
* Tariffs = higher costs + weaker margins = bearish for NVDA fundamentals.
* Institutions are rapidly de-risking, confirmed by volume + options flow.
📊 Technical Analysis (1H Chart)
Structure:
* NVDA broke back below the 108 support — now acting as resistance.
* Price is currently sitting around 104.13, probing the gamma support band and near a key demand level at 104–105.
* This level coincides with PUT Support and HVL zone, meaning dealers might defend here, if they aren’t forced to hedge further.
Trend:
* Short-term: Bearish.
* Price rejected from the 114–115 CALL wall cluster (Gamma Ceiling).
* Forming lower highs and lower lows, confirming distribution + breakdown structure.
🔥 GEX + Options Flow Analysis
Dealer Positioning:
* GEX: 🔴🔴 — strong negative gamma zone, meaning dealers short gamma and are selling into weakness.
* As price drops, dealers sell more → amplifying downside moves.
* Current GEX Setup:
* Highest positive NETGEX/Call Resistance at 114–115 → unlikely to reclaim this without catalyst.
* Put Support near 104.6, aligning with today’s bounce attempt.
Options Data:
* IVR: 23 → relatively low.
* IVx avg: 54.5 vs current IVx = 23 → volatility is still compressed despite crash.
* CALLS only 6.5% → very bearish skew.
* Put Wall at:
* 104.6 (support) — holding for now.
* 100 — if 104 breaks, this is the next magnet.
🧭 Trade Scenarios
🐻 Bearish Continuation:
* Trigger: Breakdown below 104 support zone.
* Target: 100 psychological + PUT Wall (high confluence).
* Stop: Close above 108.
* Notes: Watch for macro headlines to further accelerate this breakdown.
🐂 Relief Bounce Setup:
* Trigger: Strong bounce and reclaim of 108 with volume.
* Target: 110 → 112 retest (low probability unless sentiment shifts).
* Invalidation: New low below 104 with momentum.
📌 Commentary:
This chart perfectly reflects a dealer-driven gamma crash fueled by a macro catalyst. NVDA was already in a downtrend, and today’s tariff news created the conditions for:
* Breaking demand structure.
* Triggering delta hedging from dealers.
* Pushing price into low-liquidity zones near PUT walls.
The bounce off 104 may be short-lived unless macro fear eases.
⚠️ Final Take:
* Bias: Bearish below 108.
* If 104 breaks, look for a flush to 100.
* Volume confirms institutional exit, and options data shows dealers are selling rips, not buying dips.
📉 Trade Idea:
Buy PUTS (1–2 weeks out) if price rejects 108 retest.
Strike: 102P or 100P
Stop: SPOT above 109
Target: $100–$101 zone
This analysis is for educational purposes only and does not constitute financial advice. Trade at your own risk.
$NVDA | A Double Bottom in the Making? We’re spotting the early structure of a double bottom pattern forming on NASDAQ:NVDA — a classic bullish reversal signal. After a steep decline, price action is showing signs of stabilization, testing support twice, and trying to recover from the lows.
But there’s a catch...
📌 No confirmation yet.
The neckline still needs to be broken with strong momentum to validate this formation and trigger potential upside.
⚠️ Today’s tariff-related news could be the catalyst. A strong reaction may either confirm the breakout or invalidate the pattern entirely.
What to watch:
Break above the neckline with volume = potential entry ✅
Failure + breakdown = more pain to come ❌
This is a key technical level. Stay sharp and let price action lead the way.
NVIDIA The chance to buy for $230 is NOWNVIDIA is forming a Double Bottom on a 1day RSI bullish divergence, same kind it did on the October 31st 2023 low.
The prevailing pattern is a Channel Up and the double bottom could technically kick start the new bullish wave.
The last one almost reached the 5.0 Fibonacci extension before pulling back under the 1day MA50.
Best opportunity to buy in 2025. Target just under the 5.0 Fib at $230.
Follow us, like the idea and leave a comment below!!
Nvidia Wave Analysis – 31 March 2025
- Nvidia reversed from key support level 105.00
- Likely to rise to resistance level 115.00
Nvidia today reversed from the support area located between the key support level 105.00 (which has been reversing the price from last September) and the lower daily Bollinger Band.
The upward reversal from this support zone stopped the earlier short-term ABC correction ii from the start of March.
Given the strength of the support level 3.60 and the bullish divergence on the daily Stochastic, Nvidia can be expected to rise to the next resistance level 115.00.
NVDA earnings bullish I do dowsing with a pendulum & it's a good test to try it for earnings since there are big moves. It's kind of hit or miss, but really interesting & everyone follows NVDA still, so let's see what energy it has!
I get nervous when there's bullish energy & the stock moves as I'm doing my reading, but this is pretty bullish info I have. Watch for a move up maybe 12%, which takes it to around $145. I also got the number 47, so that's a possibility also.
I did have a little bearishness in saying to sell rallies. I'd be watching the date 3/3 for a possible retracement back down if it does, in fact, go up. It pretty bullish short term though.
I have positive energy in indexes too, so I thought it may be in part because NVDA could influence things, so we'll see.
NVDA support idea $108.90I do dowsing with a pendulum to get answers on what to expect in the market and stocks. I checked on NVDA today, and along with indexes soon (tomorrow) making a somewhat lasting (or longer term) low, I have a level for at least a bounce.
Tomorrow could be a big down day for stocks and indexes as I have timing for a low, but we have yet to reach targets. The $108 area has come before in NVDA, so I feel it really should be a spot to watch. The more refined level is $108.90, so it will be fun to see what happens here; and of course, I could be completely wrong & it does something else!
$NVDA and NVDA Dominance Fib retracement levelsNASDAQ:NVDA is now already in bear market territory and the next question when this slide in the stock price will stop. Today in our Daily dose of Chart we are looking into NVDA Feb retracement levels in the upward sloping channels and the NVDA Dominance in NASDAQ.
If we plot the upward sloping Fib retracement channel joining the top candles weekly chart within the upward sloping channel and then plot the Fib levels to the lowest levels of 2023 and 2024 then we see that the current price is at the 3.618 Fib level which is at 104 $. The next level is 4.236 and that level lies at approx. 95 USD. So if the sell of continues then the next price target is 95 USD.
In this blog space we have floated the idea of NVDA Dominance ($NVDA.D) which is just the ratio of NASDAQ:NVDA vs NASDAQ QQQ. The dark green line in the chart signifies the NVDA Dominance and it is currently well of its highs. If we simply plot the Fib retracement on the Dominance Line, then we see the next support is @618 which will give us a price of 99 $ on the NASDAQ:NVDA stock. So that means technical speaking we have great support and price memory between 95 $ - 99 $.
Verdict : Accumulate NASDAQ:NVDA here and go extra-long @ 95-99 $
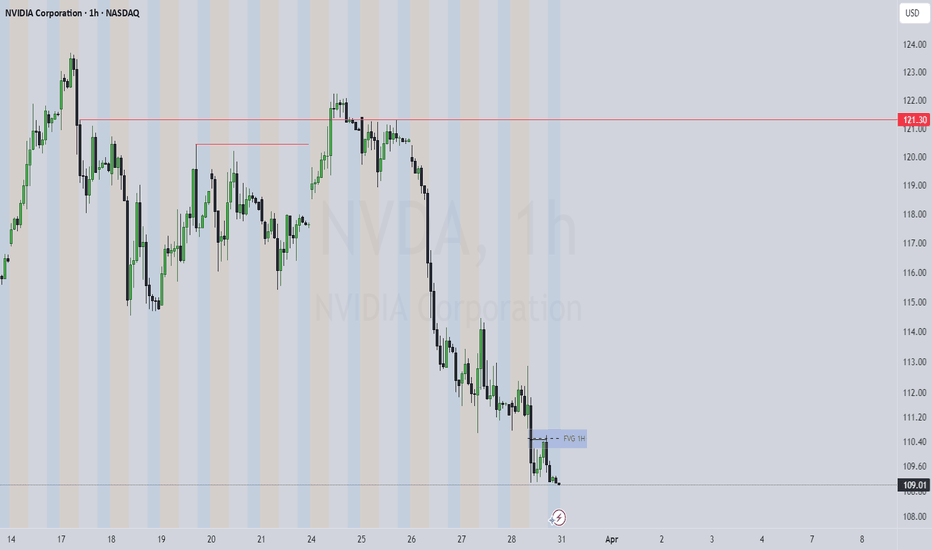
NVDA at a Decision Point – Breakout or Breakdown?🔍 Technical Analysis (1H Chart)
* Market Structure & SMC:
NVDA has consistently respected a downward sloping parallel channel. We see multiple CHoCHs (Change of Character) and a recent Break of Structure (BOS), confirming a bearish trend continuation. Price failed to reclaim the mid-supply zone and is hugging the bottom channel support.
* Supply/Resistance Zones:
* Immediate Resistance: $110.69 (top of current rejection zone)
* Mid Resistance: $114.47
* Strong Resistance: $122.25 (major supply zone)
* Support Levels:
* Immediate Support: $108.64
* Next Critical Support: $104.77 (marked as highest negative GEX / Put Wall support)
* Indicators:
* MACD: Momentum remains bearish with flat histogram bars. No bullish crossover yet.
* Stoch RSI: Oversold but not curling up yet – no strong reversal signal here.
* Volume: Slight uptick on recent sell-off, but not panic volume.
📊 Options Flow / GEX Sentiment (Right Chart)
* GEX Analysis:
* Negative GEX Cluster between $109–105, showing Put Dominance.
* HVL Zone (High Volume Liquidity) near $112, suggesting a magnet zone if bulls recover.
* Strong Call Wall at $118 and $122 — tough resistance ahead.
* Max Put Support Zone at $104.77 – could act as a bounce point or trap.
* Options Oscillator:
* IVR: 24.5 – relatively low implied volatility rank.
* IVx avg: 60.1 – moderate implied volatility.
* CALLS only 5.4% – heavily skewed bearish sentiment.
* Red GEX Bars – dominant Put positions hint at hedge-heavy downside pressure.
🧠 Trade Setups
Scalp/Short-Term Setup
* Bearish Bias unless NVDA reclaims $110.69 with volume.
* 📉 Short Entry: Below $108.50
🎯 Target: $105.00 → $104.77
❌ Stop: $111.00
Reversal Play (Speculative)
* Watch for bullish divergence or sharp reclaim of $112.
* 📈 Long Entry: Above $112 (HVL reclaim)
🎯 Target: $114.50 → $118
❌ Stop: $108
🧨 Options Strategy Idea
Bearish Vertical Spread (Short-Term)
* Buy 110 Put / Sell 105 Put
* Expiration: 1-2 weeks
* Net debit: lower cost with defined risk
* Thesis: NVDA fades toward $105 support
Long Call Idea (Only if $112 flips with strength):
* Buy 115 Call – 2 weeks out
* Needs confirmation of reversal or gamma squeeze
🧭 Bias Summary
* ✅ Directional Bias: Bearish until $112 is reclaimed
* 📉 Price is within a bear channel, respecting structure
* 🔴 Options sentiment confirms downside pressure
* 🛑 Do not long blindly at support – wait for signs of strength
⚠️ Disclaimer
This analysis is for educational purposes only and not financial advice. Always do your own research and manage risk carefully.
NVDA 2 The????NASDAQ:NVDA
Outlook - -GEX and -DEX but +OI This week. NASDAQ:NVDA ’s price action will likely hinge on broader
market sentiment rather than company-specific releases, given no major NVIDIA events are slated.
Weekly -- 2nd consecutive down week with increasing volume
Daily -- Downtrend to next HVL under 106 possible
Hourly -- Consolidating at support zone
10m -- Consolidating
Bias -Monitoring U.S. trade policy updates and technical levels for short-term direction.
Volatility remains high, so caution is warranted.
Pivot - 109.65
Upside Targets:
* 111.47--112.91--113.66--115.01
Downside Targets:
* 109.62--108.45--105.05--104.34


