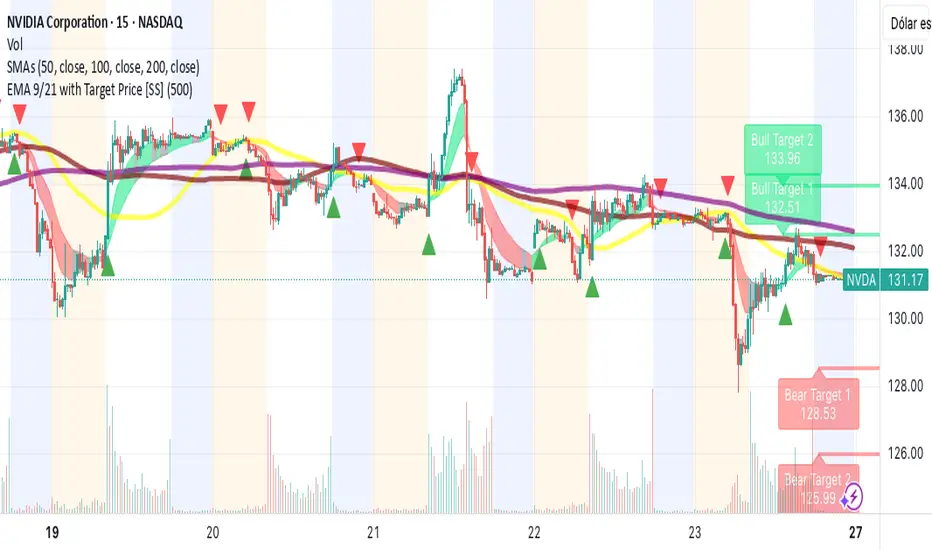
Nvidia Update ahead of Quarterly results In this video I recap my previous Nvidia video where I anticipated a rangebound price action with the possibility of a new low for longs leading towards Quarterly earnings.
With the highly anticipated results only days away I outline the possibility for price to pull back into a really strong level of support for a possible long entry .
Tools used
TR Pocket
Fibonacci
Anchored VWAP
Volume Profile
Thankyou for your continued Support
NVDAD trade ideas

Controlled Risk Growth Strategy🚀 We begin with NVIDIA ( NASDAQ:NVDA ): Tech, AI, and a long-term vision.
Hi community 👋, today I’m sharing the launch of a solid strategy designed to achieve steady growth while maintaining strict risk control in every step.
✅ General strategy:
Max risk per trade: 6%
High-potential trades limited to 15% of portfolio
Based on a custom technical and fundamental 20-point validation system
💥 First trade activated:
🎯 CALL on NASDAQ:NVDA (NVIDIA)
📅 Expiration: September 19, 2025
💵 Strike: $134
💰 Premium: $1,515 (~5% of portfolio)
📅 We're also watching closely the upcoming earnings report on May 28, which could trigger a strong revaluation of the contract if projections are confirmed.
🧠 Why NASDAQ:NVDA ?
NVIDIA isn’t just hype. It’s at the core of multiple tech revolutions:
🔹 Undisputed leader in AI chips
🔹 Key supplier to tech giants (Amazon, Microsoft, Tesla, OpenAI…)
🔹 Developer of CUDA platform used in AI, scientific modeling, and 3D rendering
🔹 Rapid growth across data centers, gaming, and autonomous vehicles
🔹 Strong acceptance from institutional and retail investors
🔹 Consistently high demand and growing global interest in its training tech
🌐 Ongoing and future projects:
Expanding its ecosystem with generative AI
New business units focused on health, defense, and smart cities
Strategic global partnerships in semiconductors and infrastructure
🛡️ Risk management first:
Planned entries
Measured risk
Clear expectations
📌 If you’re looking to copy a strategy that balances vision, analysis, and discipline, you’re in the right place.
#NVDA #CALLoption #RiskManagement #SmartInvesting #TechStocks #PopularInvestor #AIStocks
Highlight Key Price ZonesHere’s my theory.
What if we highlight the candle stick history by assigning different color keys and their representations.
Thus showing us a complete 4 step break down of price and its history.
Edit candle stick properties by changing the source of our discovery path.

$NVDA🚀 Project Stargate in Abilene, TX might be the fuel NASDAQ:NVDA needs to stay strong with top-tier AI chips.
With NASDAQ:MSFT and NASDAQ:META competing in AI infrastructure, this could build a powerful U.S. tech backbone.
Performance drives interest both customers & investors.

NVDA Possible PlaysCurrently looking to see if NVDA can manage to get through next week and bounce up or the alternate route where we see a correction. Thoughts and comments appreciated.
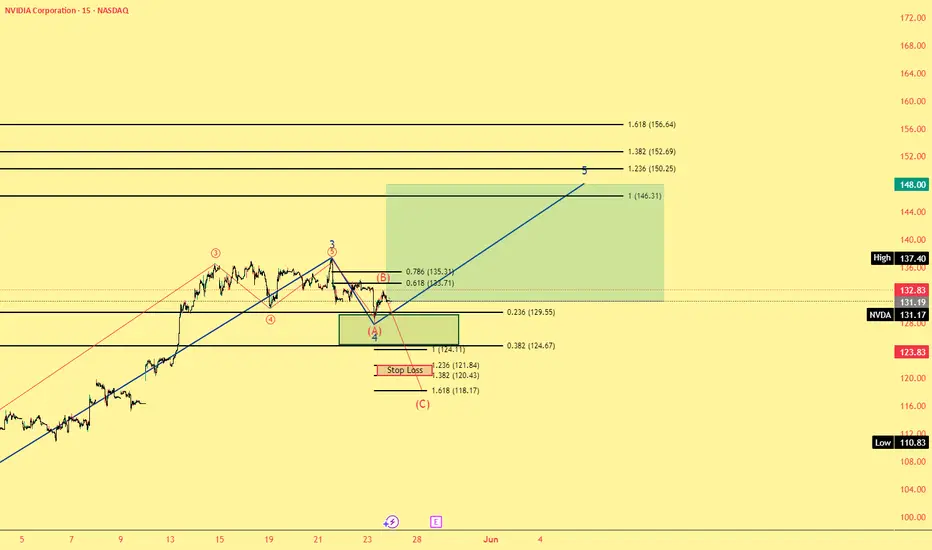
NVDA - PULLBACK AND FINAL PUSH UNTIL CORRECTIONGood Morning,
Hope all is well. NVDA accomplishing quite the push since finding its support in April. We are looking for a pullback and one final push before initiating a corrective wave. If the corrective wave holds above the previous bullish trend you could expect another strong bullish push.
Enjoy!

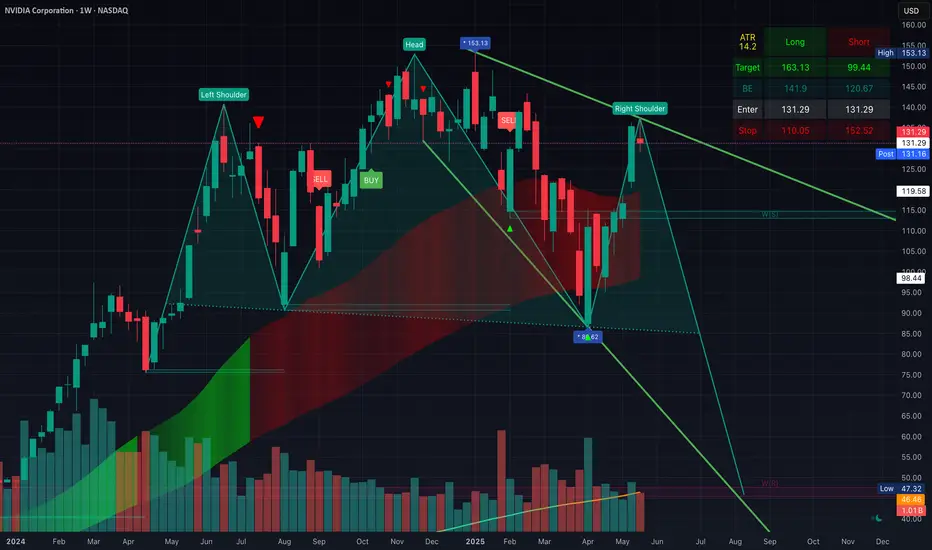
Possible Head & Shoulders Forming On The WeeklyWeekly chart shows a potential H&S forming. Looking for a $120 retest soon minimum. If that breaks, it should retest the March/April lows (also the h&s neckline).... If that doesnt hold, this will plummet to $50 give or take.
Time to take profit/hedge imo
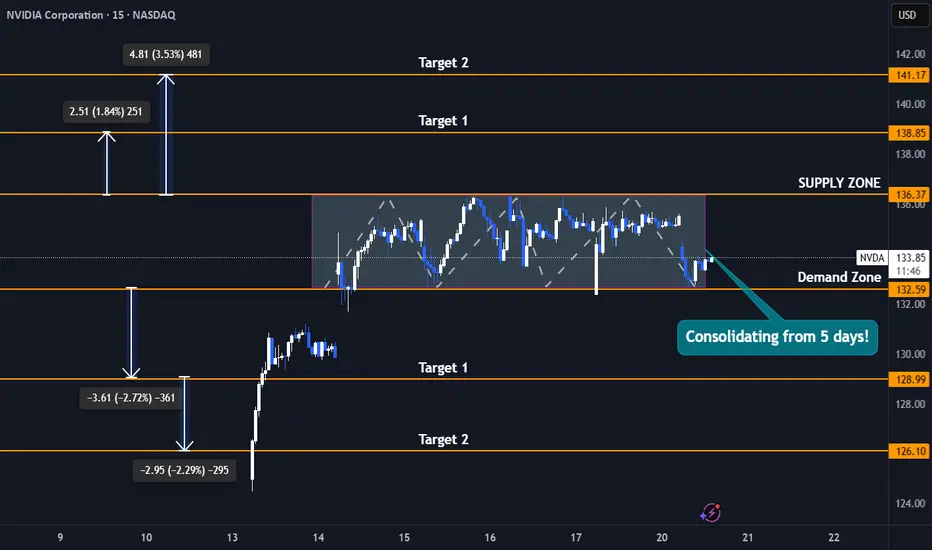
Nvidia Stock 5-Day Consolidation Breakout - Uptrend or Pullback?Trade Duration: Intraday
Trade Type: Breakout
- Nvidia is currently consolidating tightly between $132 and $136, forming a narrow range that reflects a balance between buyers and sellers unwilling to relinquish control. This range-bound action signals indecision, but it won’t last indefinitely.
- Typically, the longer the consolidation, the more significant the subsequent move. As new participants enter the market, a breakout—whether upward or downward—can trigger a powerful surge.
- This move is often amplified by breakout buyers joining in and stop-loss orders of trapped traders being triggered, creating an ideal setup for an intraday breakout trade.
- I plan to initiate either a buy or sell position depending on the breakout direction, capitalizing on the momentum generated by this tight consolidation phase.
Upside Targets : 138$ and 141$
Downside Targets : 128$ and 126$
SHORT | NVDANASDAQ:NVDA
Key Observations:
Current Price Action:
Price: $131.80
Recent Drop: -2.58 (-1.92%)
Support and Resistance Levels:
Immediate Resistance: $134.70 to $138.83
This red zone represents a strong supply area where the price has historically faced selling pressure.
Immediate Support: $122.74 (Target Price 1)
Further Supports:
Target Price 2: $116.65 (Aligned with 0.5 Fibonacci Retracement)
Target Price 3: $108.38 (Previous structural low)
Trendlines:
Red Uptrend Line: Recently broken, indicating weakening bullish momentum.
Green Downtrend Line: Long-term resistance trendline from the previous Lower Highs (LH) is still intact and respected.
The break below the minor trendline suggests a corrective wave (4) might be in motion.
Fibonacci Levels:
0.382 Fib Retracement: $121.22
0.5 Fib Retracement: $116.22
These levels align with potential targets in a wave (4) corrective phase according to Elliott Wave theory.
Target Prices:
Target Price 1: $122.74
This is the closest demand zone and aligns with the 0.382 retracement—high-probability support.
Target Price 2: $116.65
Aligned with the 0.5 Fibonacci level and previous consolidation.
Target Price 3: $108.38
A major structural support and potential wave (4) bottom if market turns sharply bearish.
Summary:
NVIDIA Corporation (NVDA) is showing early signs of a corrective phase after failing to break through strong resistance in the $134–$138 range. The price rejected the resistance zone and is likely entering wave (4) correction. Key support levels to monitor are $122.74, $116.65, and $108.38, corresponding with Fibonacci retracement levels and historical price structure. A break below the short-term trendline increases the probability of a continued pullback before potentially resuming the uptrend in wave (5).

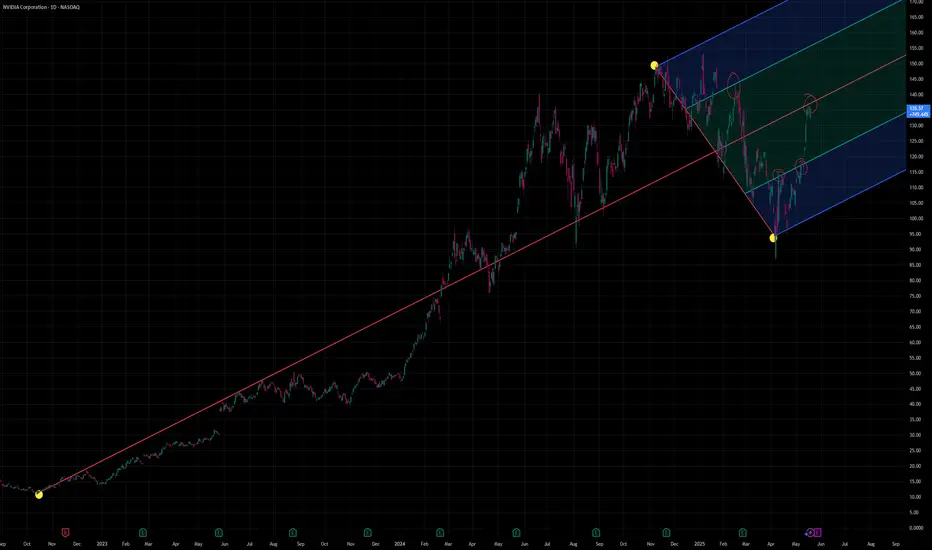
NVDA ..The nvidia levels of interesting worthiness
^^See my other idea on how the lines work and how I use them to see about the worthiness or V-bounces or to determine if flags are forming...
only addition i will put here...is the application of a basic Fib retrace from the top start of the trend in descending pattern to the first breach of the line, after the second pivot point. So the yellow markers show the retrace and the green show the trend line of two worth pivots.
A nice X forms on that candle between the lines and the fib retrace...

NVDA When the Dome is Pierced but the Crowd Doesn’t Cheer.NVDA pierced the dome. But the market didn’t roar—just whispered.
You’d expect prices to leap on headlines like “hyperscalers buying hundreds of thousands of H100s and B200s.” But instead, we’ve seen price hesitations… rejection wicks… and a quiet fade into the resistance box.
That’s the tell.
The “bull case” is loud—CoreWeave, Meta, and Microsoft are all investing capex in datacenter growth.
Headlines scream demand.
Analysts raise price targets.
AI buildout is the macro story.
And yet… NVDA can’t sustain above 137.
Technically, this is what I'm seeing:
A clear inverted dome pattern—price pierced through, but volume didn’t confirm.
Rejection within the gray box: 134–137 remains a trap zone.
Rising wedge structure beneath, with weakening RSI momentum.
Key levels to watch:
137.50: Failure here confirms the fakeout.
134.28: break below, and the dome reasserts control.
130.64: losing this brings 119.59 into play—fast.
Fundamentally, the risk is timing:
Much of the demand for NVDA’s next-gen chips is already pre-booked.
Margins on the newer nodes may face pressure.
The buyer base is concentrated: a few hyperscalers dictate 80% of the flow.
If AI expectations plateau—even temporarily—valuation multiple compression is severe.
And then there’s the macro:
10Y and 30Y yields are pushing higher after a soft CPI print.
Moody’s downgrade lingers in the background.
Japan’s bond market is wobbling.
The bond lords are watching—and if they whisper “not at these yields”, risk assets will reprice.
This isn’t about fear. It’s about understanding silence.
When the loudest news doesn’t move price, something else is pulling strings.
Positioning note:
I hold puts. 5 contracts. Small size, but high conviction setup.
This isn’t just about charts—it’s about recognizing when perception has outpaced inflow, and when liquidity begins to vote.
The dome was pierced.
But without volume, it’s just vapor.
And when vapor meets gravity, price falls—silently.


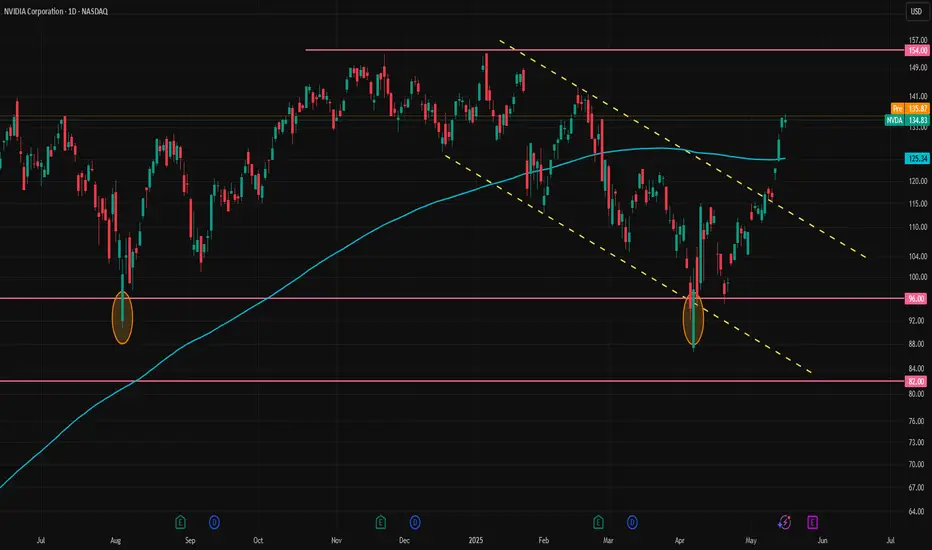
NVIDIA Breaks Out - Is a Bigger Rally Coming?NVIDIA Breaks Out - Is a Bigger Rally Coming?
NVIDIA has broken out of a bullish triangle pattern, signaling that it might be ready to climb higher. In my view, the bottom was reached at 86.00, as even market pressures from Trump couldn't push it down further.
NVIDIA seems to be waiting for more details on the US-China trade deal before making a stronger upward move.
If positive developments emerge, it could trigger a bigger bullish wave, lifting the stock even higher.
You may find more details in the chart!
Thank you and Good Luck!
❤️PS: Please support with a like or comment if you find this analysis useful for your trading day❤️

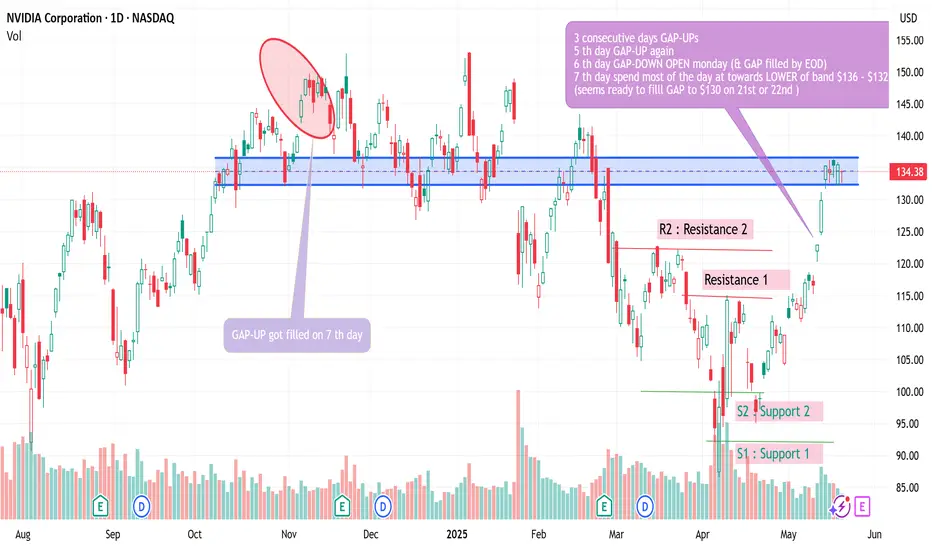
NVDA GAP-UPS on 3 consecutive daysNVDA GAP-UPS on 3 consecutive days
we had a gap up in the past, that got filled on 7 th day
NVDA GAP-UPS on 3 consecutive days
NVDA Still a Monster, But I’m Not Chasing It Just YetNVIDIA is sitting around $135.57 right now, and yeah—fundamentally, it’s crushing it. Revenue growth is off the charts (over 114% YoY) and the data center segment alone pulled in $35B+ last quarter. AI is the fuel, and NVDA is the engine.
That said… we’re getting into overheated territory.
Technically, price is way above its 50/100/200 EMAs, and the RSI is up in the 70s, so we’re clearly in overbought land. Can it push higher? Sure. But I’m not a fan of chasing candles when the chart is screaming “cooldown incoming.”
If we get any weakness or macro jitters (tariffs, earnings nerves, etc.), I’ll be watching for potential entries in the $125–98zone. If we drop into that range with strong volume reaction, I’ll start scaling in.
On the geopolitical front: yeah, the FWB:15B impact from U.S.–China restrictions isn’t nothing—but NVDA’s already moving to offset that with partnerships (like the Saudi AI deal). This isn’t a company sitting still.
📌 Bottom Line:
Long-term, I’m bullish. Short-term, I’m cautious. I’d rather miss a little upside than buy the top and get trapped in a pullback. Let the trade come to you.
Disclaimer: This isn’t financial advice—just sharing my own playbook. Always do your own research and manage risk accordingly.

NVIDIA The 1W MA100 rebound is targeting $225 at least.NVIDIA Corporation (NVDA) broke last week above its 1W MA50 (blue trend-line) for the first time in 2.5 months and all this is generated by April's bottom rebound on the 1W MA100 (green trend-line).
The 1W MA100 has been intact since January 23 2023, so this rebound technically initiates a new Bullish Leg. Since the December 2018 bottom (previous U.S. - China Trade War), the minimum rise on such a Bullish Leg has been +156.11%. As a result, NVIDIA can now target $225 at least before the end of 2025.
-------------------------------------------------------------------------------
** Please LIKE 👍, FOLLOW ✅, SHARE 🙌 and COMMENT ✍ if you enjoy this idea! Also share your ideas and charts in the comments section below! This is best way to keep it relevant, support us, keep the content here free and allow the idea to reach as many people as possible. **
-------------------------------------------------------------------------------
💸💸💸💸💸💸
👇 👇 👇 👇 👇 👇

Interesting NVDA by DXY Pitchfork analysisNot much to say... view other posts/ideas of mine to see what the whole idea of stock/DXY is used
I do a bunch of stuff on the lower chart, Stock/DXY, and translate it point to point on price chart...
here is the 4hr chart in closer view:
FOMO, FOMO, FOMO , all rushing in to buy NVDASo CEO of NVDA has given an impressive speech recently. Read here
And the forum is full of optimism and hype about the share price going to the moon. We have seen this before and it is anyone guess what happens after it reaches the resistance level at 149.28. Will it break out and continue the rally much to the excitement and bet of many investors/traders? Or would there be some form of retracement perhaps due to the downgrading of the US ratings to AA?
I will not chase the high price as it it 3/4 to the top , leaving little meat to the profits and probability of going higher remains unknown but probability of it reversing half or towards support at 91.44 is a possibility.
Thus, I will not be looking at this counter for now. However, I am invested in the VOO ETF (replicating SPX) so indirectly, I am vested in Nvidia.
Fundamentally, this company is also overvalued from looking at its balance sheet. Of course, if the earning growth could match up, the share price can still continue to rally especially it is also a popular stock amongst many retail investors.

Options Trade Idea: NVDA $135 PUT – Exp. May 23, 2025 -SwingI'm entering a NVDA $135 PUT expiring May 23, 2025, as a short-term swing trade based on my technical analysis.
Type: Put Option (ITM)
Strike Price: $135
Expiration: May 23, 2025 (this Friday)
Rationale:
I see signs of a potential downside move in NVDA: bearish RSI divergence, weakening momentum, and rejection at key resistance. I chose the in-the-money (ITM) $135 strike PUT because it has higher delta and holds value better, especially with strong theta decay favoring fast profits ahead of expiration this Friday.

Nvidia —Resistance Turns Support Support Confirmed—ATH 260-194This week closes as a full green candle. A rising window or gap was left along the way. This is a bullish development.
The full green candle comes after a rounded bottom and double-bottom long-term. Coming from a resistance level turned strong long-term support.
Keeping it simple, NVDA has been rising and the chart shows potential for additional growth. There can be retraces and corrections; Any retraces and corrections are an opportunity to buy-up, rebuy and reload.
In the case of a strong correction, always, we will end up with a higher low compared to the 7-April weekly session. This session marks the bottom of the correction.
A higher low means the bullish structure remains intact. A bullish structure means a bullish trend. A bullish trend means rising prices which will end up with a new All-Time High in late 2025.
Two new All-Time Highs possible and highly probable in 2025. 194 (mid-term) & 260 (long-term).
Thank you for reading.
Support boost and follow.
Namaste.

NVDA$ - possible pullback to $50 (-67% from pick) in the making.NASDAQ:NVDA have done this before (67% pullbacks after long rally).
NVDA is following very predictable patterns for many years now, despite excitement around this stock - stock made "new recent low" and current rally maybe just a part of a "head and shoulders" in the making. If "new all time high" is not reached with in the next few weeks - we will see stock pullback to $50 or less in the next 6-9 month.

Possible Targets for Nvidia on Both Upside and DownsideNvidia has surged more than 55% since the early April dip and over 40% from the second dip, as expected in our earlier post. This massive rally was supported by a softening in trade policy (Bloomberg trade uncertainty index fell to 7.67 from 16.27), Nvidia's valuation being well below historical averages, and momentum sparked by Trump’s Middle East business trip.
Despite the surge, Nvidia still trades below its historical average based on forward price-to-earnings ratios. The stock has averaged a forward P/E of 32.2x over the past year, 34.2x over the last two years, and 40.2x over the past five years. Its current forward P/E stands at 28.4x. If Nvidia were to return to these averages, the implied price would be:
1-year average (32.2x): $153.04
2-year average (34.2x): $162.20
5-year average (40.2x): $190.79
However, relying on the 5-year average may not be ideal, as Nvidia’s explosive growth potential is no longer at the same trajectory it was five years ago. The 1-year average at $153.04 could be a more realistic near-term target.
Around the 1-year p/e price target, Nvidia has also a notable technical resistance. The stock has an infamous double top at $154 that has capped price advances twice before in November and January. This suggests that a short-term bet on further upside could be risky.
If Nvidia pulls back to around 120 level, however, it may offer a good buying opportunity, with upside potential toward 150 or higher, depending on the broader macroeconomic conditions at the time.
Please also check our earlier post:
NVIDIA (NVDA) 4H Outlook – May 2025Price has recently shown multiple Breaks of Structure (BoS) to the upside, suggesting a potential shift in market sentiment. After a liquidity sweep of the prior low, price began forming higher highs and higher lows.
Currently trading around $116.62, NVDA may revisit the demand zone between $107.99–$110 (highlighted in green) before resuming bullish momentum. If that level holds, we could see a continuation towards the $129.41 target zone, aligning with prior market structure and supply.
This setup aligns with smart money concepts—monitor for confirmation at the demand zone before entering long.
