OXY Bullish BreakoutOXY poised to breakout to $49 in the near term.
Bellwether XOM has already made a move above it's 200 day SMA, I expect OXY and other energy laggards to follow suit.
53.75 medium term target.
Good luck! This is not financial advice.
OXY trade ideas

$OXY – Positioning for a Bullish Breakout ?📊 Technical Overview
NYSE:OXY has been in a prolonged downtrend, but recent price action is showing a potential structural reversal:
LL to HL / HH shift suggests the downtrend may be bottoming out.
Currently forming a Higher Low (HL) after printing two Higher Highs (HH) – a classic bullish market structure.
Key support held firm around the $34.80–35.00 zone, which aligns with a historically strong demand area.
Target range identified between $55.35–55.55, where previous consolidation occurred.
A sustained move above $45 could confirm a breakout from the current consolidation and open up room to the upside.
💡 Macro Tailwinds
Several economic and geopolitical factors may support a bullish case for NYSE:OXY :
🔺 Oil Price Stability
WTI crude has been resilient above $70–75, with supply constraints and geopolitical tensions (e.g., Middle East & Russia sanctions) keeping a floor under oil prices.
If oil trends higher (seasonal summer demand + hurricane season), OXY’s revenue outlook improves.
🌍 Global Energy Demand
Global demand for fossil fuels remains elevated, particularly in emerging markets.
While ESG pressures remain, oil & gas continues to be critical in the transition phase.
💰 Warren Buffett Factor
Berkshire Hathaway continues to increase its stake in Occidental, signaling long-term conviction.
Buffett now owns over 28% of OXY, and the market often treats this as a strong vote of confidence.
🏦 Interest Rates & Fed Outlook
As inflation eases, markets are pricing in potential rate cuts in late 2025, which could support capital-intensive sectors like energy.
Lower rates also improve discounted cash flow models, increasing fair value estimates.
🧠 Sentiment & Valuation
OXY remains undervalued vs peers on a forward P/E and EV/EBITDA basis.
With strong free cash flow, OXY is aggressively paying down debt and buying back shares — supportive of long-term price appreciation.
RSI and MACD are neutral – plenty of room for momentum to build.
🎯 Trade Plan
Entry Zone: $42.50–43.50 (Current consolidation area)
Stop Loss: Below $38 (invalidates HL structure)
Target 1: $50
Target 2: $55.50
Target 3 (Stretch): $60+ if oil prices surge
⚠️ Risks
A break below $38 would invalidate the bullish structure.
Oil price weakness due to recession fears or unexpected OPEC policy shifts.
Broader market volatility (Fed, inflation, geopolitical shocks).
🔍 Bottom Line
OXY is showing early signs of a bullish reversal on the chart — supported by strong fundamentals, insider confidence (Buffett), and resilient oil prices. If this HL holds, the setup offers a solid risk-reward opportunity toward previous resistance levels.

OXY marching towards 52 price levelHalleujah! OXY share price has just breaks out of the bearish trend line since April 2024.
I expect the rally to continue especially with the Israel/Iran war ongoing and the tension/chaos that it is sending to the investing world.
Buy on pullback

OilIran, israel, buffet.
You know the drill, just do your own research about last 5000 years of history and the Middle East.

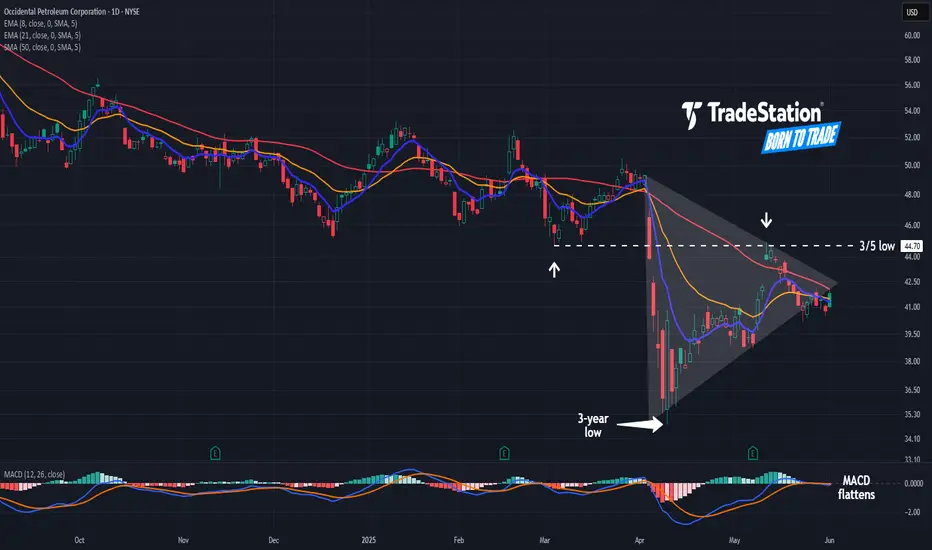
Can Occidental Hang On?Occidental Petroleum has staggered since tariffs were announced in early April, and some traders may expect the energy driller to continue lower.
The first pattern on today’s chart is the March 5 low of $44.70. The tariff news drove OXY through that support to a three-year low. It then rebounded but stalled at the previous low. Has old support become new resistance?
Second, OXY has made higher lows and lower highs. Such a narrowing range may create potential for prices to start moving if the triangle is broken.
Third, the stock has remained below its 50-day simple moving average. That may reflect a bearish intermediate-term trend.
Finally, the 8-day exponential moving average (EMA) just crossed under the 21-day EMA. That may reflect a bearish short-term trend.
Check out TradingView's The Leap competition sponsored by TradeStation.
TradeStation has, for decades, advanced the trading industry, providing access to stocks, options and futures. If you're born to trade, we could be for you. See our Overview for more.
Past performance, whether actual or indicated by historical tests of strategies, is no guarantee of future performance or success. There is a possibility that you may sustain a loss equal to or greater than your entire investment regardless of which asset class you trade (equities, options or futures); therefore, you should not invest or risk money that you cannot afford to lose. Online trading is not suitable for all investors. View the document titled Characteristics and Risks of Standardized Options at www.TradeStation.com . Before trading any asset class, customers must read the relevant risk disclosure statements on www.TradeStation.com . System access and trade placement and execution may be delayed or fail due to market volatility and volume, quote delays, system and software errors, Internet traffic, outages and other factors.
Securities and futures trading is offered to self-directed customers by TradeStation Securities, Inc., a broker-dealer registered with the Securities and Exchange Commission and a futures commission merchant licensed with the Commodity Futures Trading Commission). TradeStation Securities is a member of the Financial Industry Regulatory Authority, the National Futures Association, and a number of exchanges.
TradeStation Securities, Inc. and TradeStation Technologies, Inc. are each wholly owned subsidiaries of TradeStation Group, Inc., both operating, and providing products and services, under the TradeStation brand and trademark. When applying for, or purchasing, accounts, subscriptions, products and services, it is important that you know which company you will be dealing with. Visit www.TradeStation.com for further important information explaining what this means.
WARREN BUFFETT is missing my Chart Analysis - OXY TO $29 Hello Traders, I am back, because Warren Buffett is making a Huge Mistake!
If he was looking at my chart analysis, he would not making this mistakes. I am sure he is the top fundamental analysis, but I am also sure, he does not know about technical analysis.
If he had known about technical analysis, he would not have allowed Berkshire Hathaway to buy 763,000 shares of OXY for an average price of $46.82, in February 2025.
In late December, Berkshire purchased 8.9 million Occidental shares during a broad market pullback. Occidental remains Berkshire’s sixth-largest equity holding.
Warren Buffett is undoubtedly a master of fundamental analysis, but his recent decision to buy more Occidental Petroleum (OXY) after a 30% sell-off from its record high suggests he may be missing the bigger picture when it comes to technical analysis.
While Buffett has always emphasized intrinsic value and long-term potential over short-term price movements, ignoring technical indicators can be costly—especially in the case of a highly cyclical stock like Occidental. The steep decline in OXY's price is not just a random fluctuation; it reflects broader market sentiment, momentum shifts, and key support levels that Buffett appears to be disregarding.
One of the major issues with Buffett’s approach is that he tends to view price declines purely as opportunities to buy undervalued stocks without considering whether the stock is in a downtrend with further room to fall. Occidental’s 30% drop from its peak could indicate the start of a deeper correction or even a long-term shift in investor sentiment toward oil stocks.
Technical analysts would look at moving averages, relative strength index (RSI), and volume trends to determine whether the stock is showing signs of bottoming or if further downside is likely. Buffett, however, does not appear to incorporate these tools, potentially exposing Berkshire Hathaway to further losses.
Another critical aspect of technical analysis that Buffett seems to overlook is support and resistance levels.
If Occidental broke the current level of support of $45, it could suggest that institutional investors are exiting the stock, meaning that further declines are possible before a true bottom is found.
Rather than blindly averaging down, a trader versed in charts would wait for confirmation of a reversal, such as a double bottom or a bullish divergence in momentum indicators. Buffett’s reliance solely on fundamentals ignores these crucial signals, making his timing questionable at best.
Additionally, market psychology plays a significant role in stock movements, and Occidental’s sharp sell-off could be signaling broader concerns about the energy sector. Even if the company’s fundamentals remain strong, investor sentiment can drive the stock much lower before any recovery takes place.
Buffett’s historical strategy of buying quality stocks and holding them for decades works well in certain cases, but oil stocks are notoriously volatile and highly correlated with macroeconomic factors like interest rates, geopolitical events, and commodity cycles. By ignoring these elements, Buffett may be underestimating the risk of catching a falling knife.
Ultimately, while Buffett’s deep understanding of business fundamentals is undeniable, his reluctance to embrace technical analysis could lead to costly missteps—especially in a stock like Occidental, which is heavily influenced by momentum, sentiment, and cyclical trends. His recent purchases may look brilliant years down the line if OXY eventually recovers, but in the short to medium term, he may have simply stepped into a stock that still has further to fall.
By incorporating chart analysis, Buffett could refine his timing and avoid unnecessary drawdowns, but his firm stance against technical indicators may mean he continues missing key signals in volatile stocks like Occidental.
Follow me and let's show who is the BOSS.
Sell OXY NOW WARREN BUFFETT, if you can hear me.
For my followers stay out if you do not understand, this is a crazy world.
Not allowed for Kids.
ECT

Occidental chart ideaOccidental looks like its trading at a bargain price, it looks like it found support at the weekly trendline. I think OXY is a great energy stock with a positive future, innovating cleaner energy solutions.

OXY (Occidental Petroleum Corporation) – 30-Min Long Trade Setup🚀
🔹 Asset: OXY – NYSE
🔹 Timeframe: 30-Min Chart
🔹 Setup Type: Bullish Breakout (Ascending Triangle Pattern)
📊 Trade Plan (Long Position)
✅ Entry Zone: Above $47.50 (Breakout Confirmation)
✅ Stop-Loss (SL): Below $46.53 (Key Support Level)
🎯 Take Profit Targets:
📌 TP1: $47.92 (Previous Resistance Level)
📌 TP2: $48.93 (Extended Bullish Move)
📊 Risk-Reward Ratio Calculation
📉 Risk (SL Distance):
$47.50 - $46.53 = $0.97 risk per share
📈 Reward to TP1:
$47.92 - $47.50 = $0.42 (1:0.43 R/R)
📈 Reward to TP2:
$48.93 - $47.50 = $1.43 (1:1.47 R/R)
✅ Favorable Risk-Reward Ratio toward TP2
🔍 Technical Analysis & Strategy
📌 Ascending Triangle Breakout: Price is breaking above the resistance line, confirming bullish momentum.
📌 Support at $46.53: The lower trendline acts as a safety net, keeping the uptrend valid.
📌 Volume Confirmation Needed: Look for above-average buying volume above $47.50 to validate the breakout.
📌 Resistance at $47.92: A move above this will strengthen the bullish case.
📉 Trade Execution & Risk Management
📊 Volume Confirmation: Ensure strong buying volume above $47.50 before entering.
📉 Trailing Stop Strategy: Move SL to break-even ($47.50) after hitting TP1 ($47.92).
💰 Partial Profit Booking Strategy:
✔ Take 50% profits at TP1 ($47.92), let the rest run toward $48.93 (TP2).
✔ Adjust Stop-Loss to Break-even ($47.50) after TP1 is reached.
⚠️ Risks & Considerations
❌ Fake Breakout Risk: If the price fails to hold above $47.50, exit early.
❌ Confirmation Required: Wait for a 30-min candle close above $47.50 before entering.
🚀 Final Thoughts
✔ Bullish Setup – Strong upside potential.
✔ Momentum Shift Possible – Watch for volume confirmation.
✔ Favorable Risk-Reward Ratio – 1:1.47 toward TP2.
💡 Stick to the plan, manage risk, and trade smart! 🚀📈
🔗 #OXY #NYSE #LongTrade #TradingView #ProfittoPath 💰📊

Occidental Petroleum - Warren Buffett's Strong EndorsementWhy Buying Occidental Petroleum (OXY) is a Good Investment
Warren Buffett's Strong Endorsement
Berkshire Hathaway, led by Warren Buffett, has been consistently increasing its stake in OXY, holding over 25% of the company. Buffett's long-term approach and confidence in OXY suggest strong fundamentals and future growth potential.
Solid Financial Performance
OXY has a P/E ratio of 20.95 and a profit margin of 19%, showing strong profitability in the energy sector. Its ROE of 15% indicates effective management of shareholder equity.
Strong Free Cash Flow (FCF)
The company generates around $1 billion in free cash flow, which enables it to reduce debt, buy back shares, and pay dividends—key factors Buffett looks for in an investment.
Favorable Industry Trends
With growing global energy demand and OXY's focus on low-cost production, the company is well-positioned to benefit from higher oil prices and long-term energy market stability.
Debt Reduction & Financial Strength
OXY has significantly reduced its debt-to-equity ratio (0.85), strengthening its balance sheet after the Anadarko acquisition. Buffett prefers companies that prioritize financial discipline.
Carbon Capture & Future Growth Potential
OXY is a leader in carbon capture technology, positioning itself for long-term sustainability as the world moves toward cleaner energy solutions. This gives it a competitive edge in the evolving energy market.
Buffett's Potential Full Acquisition
With Berkshire Hathaway increasing its stake and securing regulatory approval to buy up to 50% of OXY, there is speculation that Buffett may eventually acquire the entire company. This could drive further price appreciation for OXY shares.
Conclusion
Buffett's heavy investment in OXY, combined with strong financials, solid cash flow, and promising energy market trends, makes the company an attractive value play for long-term investors.

Bullish Bounce for Occidental Petroleum. OXYA bounce off support, supported by technicals. There is strong price action off a support established by two most recent price lows. Buy signals are thrown off by both VZO and Ehlers Stoch RSI, which in my experience is an extra probability boost to the take.

OXY – 30-Min Short Trade Setup!📌 📉🚀
🔹 Asset: Occidental Petroleum Corporation (NYSE: OXY)
🔹 Timeframe: 30-Min Chart
🔹 Setup Type: Bearish Reversal Trade
📌 Trade Plan (Short Position)
✅ Entry Zone: Below 47.28 (Breakdown Confirmation)
✅ Stop-Loss (SL): Above 48.37 (Invalidation Level)
🎯 Take Profit Targets:
📌 TP1: 46.11 (First Support Level)
📌 TP2: 44.80 (Extended Bearish Move)
📊 Risk-Reward Ratio Calculation
📉 Risk (SL Distance): 48.37 - 47.28 = 1.09 risk per unit
📈 Reward to TP1: 47.28 - 46.11 = 1.17 (1:1.07 R/R)
📈 Reward to TP2: 47.28 - 44.80 = 2.48 (1:2.27 R/R)
🔍 Technical Analysis & Strategy
📌 Bearish Rejection at Resistance: Price is struggling at 47.28, indicating potential downside.
📌 Rising Wedge Breakdown: The pattern suggests further bearish momentum.
📌 Volume Confirmation Needed: Increasing selling pressure below 47.28 confirms the move.
📌 Momentum Shift Expected: If price stays below 47.28, it could drop toward 46.11, then 44.80.
📊 Key Resistance & Support Levels
🔴 48.37 – Stop-Loss / Resistance Level
🟡 47.28 – Breakdown Level / Short Entry
⚪ 46.11 – First Target / TP1
🟢 44.80 – Final Target / TP2
📉 Trade Execution & Risk Management
📊 Volume Confirmation: Ensure strong selling pressure below 47.28 before entering.
📉 Trailing Stop Strategy: Move SL to entry (47.28) after TP1 (46.11) is hit.
💰 Partial Profit Booking Strategy:
✔ Take 50% profits at 46.11, let the rest run toward 44.80.
✔ Adjust Stop-Loss to Break-even (47.28) after TP1 is hit.
⚠️ Fake Breakdown Risk
❌ If price moves back above 47.28, exit early to minimize losses.
❌ Wait for a strong bearish candle close before entering aggressively.
🚀 Final Thoughts
✔ Bearish Setup – Resistance rejection signals downside potential.
✔ Momentum Shift Possible – Watch for volume confirmation.
✔ Risk-Reward Ratio – Favorable 1:2.27 R/R to TP2.
💡 Stick to the plan, manage risk, and trade smart! 📉🔥
🔗 Hashtags for Reach & Engagement:
#OXY 📉 #NYSE 📊 #StockTrading 📉 #TradingNews 📰 #MarketUpdate 🔥 #Investing 💰 #ShortTrade 📉 #Finance 📈 #ProfittoPath 🏆 #SwingTrading 🔄 #DayTrading ⚡ #TechnicalAnalysis 📉 #StockSignals 📊 #FinancialFreedom 💡 #MarketTrends 📊 #StockAlerts 🔔 #TradeSmart 🤓 #Bearish 📉 #RiskManagement ⚠️ #TradingCommunity 🤝 #SmartTrading 💰 #MarketAnalysis 📊 #TrendBreakdown 🚀

$OXY HigherI believe earnings will be better than expected and that we will have our catalyst for wave 3 to be completed. I will update further.
Some Examples on why I am BULLISH.
Exposure to Energy Markets
Occidental Petroleum is among the larger U.S. oil and gas companies. If you believe energy prices—particularly oil—will remain strong or rise, OXY might benefit from higher revenues and earnings.
Warren Buffett’s Stake
In recent years, Berkshire Hathaway has built and expanded a sizable position in OXY. Some investors view Buffett’s involvement as a sign of confidence in the company’s management or in the broader energy sector. However, following any major investor without understanding why they invested carries its own risks.
Debt Reduction Efforts
OXY took on significant debt during its acquisition of Anadarko Petroleum in 2019. Since then, the company has been working on deleveraging (paying down debt), which can bolster its balance sheet over time. Progress on debt reduction may improve its financial stability, although the speed and success of these efforts can fluctuate with oil prices and overall market conditions.
Dividend Potential and Shareholder Returns
Occidental has a history of paying dividends, though it cut its dividend at times due to market conditions. If oil prices stay relatively strong, the company may have the means to sustain or potentially grow its dividend—or use excess cash for share buybacks, which can also boost shareholder value.
Volatility and Sector Risks
Despite potential upsides, the energy sector is historically volatile. Fluctuations in commodity prices, shifts in global supply and demand, and geopolitical events can all significantly impact OXY’s earnings and stock price. Additionally, companies in fossil fuels face longer-term uncertainties related to climate policies and the transition to renewable energy sources.

OXY. LONG.Im in. More aggressive on this stock as it is undervalued. Entry on fib level. Need to pump it from here. Has to hold.

OXY- Late to the party but is it just getting started?Late to the party on this one. Perfect entry was 46.70. Volume is heating up and breaching its Avg 30D vol while breaking out of a trend. Pretty Bullish move. I can see this continuing to 60 based on this push. GL!

OXY: Bullish Breakout PotentialA break above the 50.80 level could confirm the stock is ready to clear its descending channel and shift momentum in favor of the bulls. This price has acted as a pivotal zone in recent sessions, and a decisive close above it would suggest the downtrend may be reversing. A surge in volume above 50.80 would further strengthen the long setup, potentially targeting the high 50s or low 60s if buyers follow through. The RSI on this 2W chart is hovering near the middle (accumulation) range. It’s neither showing an extreme overbought nor deeply oversold condition. That gives price room to run in either direction.
Disclaimer:
This analysis is for educational purposes only and should not be considered financial advice. Trading and investing involve risk, and independent research or consultation with a professional is recommended before making any financial decisions.

OXY Occidental Petroleum Corporation Options Ahead of EarningsAnalyzing the options chain and the chart patterns of OXY Occidental Petroleum Corporation prior to the earnings report this week,
I would consider purchasing the 50usd strike price Calls with
an expiration date of 2025-4-17,
for a premium of approximately $1.56.
If these options prove to be profitable prior to the earnings release, I would sell at least half of them.

Drill Baby Drill? Has OXY reached its bottom?Unless the market overall crashes in February, which there has been talk thereof, I'm looking at a double bottom forming here and the drill baby drill to start to kick in. LEAPS CALLs in this area? Whaddya think?


Long $OXY to $52 and $55OXY breaks the daily trendline and retests it. If the weekly candlestick forms a reversal pattern (e.g., a Doji), consider entering a Long position in the area $48–$49.
Targets:
- First take-profit at $52.
- Second target at $55.
- Stop loss below $47.
Disclaimer: This is not financial advice. Trade at your own risk.

OXY at the bottom of the trending channel. Will it bounce here?Positive RSI divergence at the bottom of the trending line. Rumor of increase of dividends in February and a possible Canadian retaliation may push NYSE:OXY up to 66 USD or higher

$OXY - Potential for Longs
NYSE:OXY has been in this descending channel for a while now and it recently broke the trend line to the upside.
I can see NYSE:OXY bouncing on the order block/retesting the trend line before moving higher.

Long OXYAs growth starts to keep a bearish trend, I expect this breakout to continue on Oxy. I have been layering into call spreads for about a month since the local lows. Lots of room to run on the weekly stochastic RSI rising from low volatility. This stall candle we just printed is bullish and I expect continuation next week since we strongly confirmed this break out. Oxy is a great hedge to the current market right now if you long it.
My plan:
March 60-62.5 Call spreads (already in the position)

OXY: Questionable Financials and Bearish Chart PatternOXY has o.k. financials but not great:
PE: 12.65
Current ratio: 1.00x (below 1.20x is bad)
Quick ratio: 0.76x (below 1.00x is bad)
The EBITDA margin is really strong at 52% and consistently strong over the years. However, its free cash flow varies between significantly negative and positive.
$28 billion in debt
$2 billion in cash (low compared to the debt level)
1.82% dividend yield (not very attractive for a company that's been around since 1920 and in this industry)
$5 billion free cash flow
The company isn't accumulating cash - it's going to debt service and capital expenditures primarily.
The chart pattern doesn't look to have any upside. There's a down-trend since 2011. There's also a down trend since April 2024. An up-trend since a low of $9 has been broken. Price is currently $48. I'd personally be a buyer at $9.
This is not investment advice.
