Rotation out of tech into energySure tech can have another couple % up as the rotation is underway, but this chart looks quite convincing to me especially with the weekly bullish div on the macd.
Then we have a bullish engulfing weekly candle...
Atop of that, last week Cramer said this oil rally should be faded.
Buffet has been buying (oxy). Although he is not an immediate reversal signal, it shows that the valuation of these companies is at a good area in his eyes.
I would love a small pullback tomorrow but I am not sure we get that. The entry now is not bad, the stoploss would be below the channel which is only 5% loss ish, for an implied 30+% move up.
OXYD trade ideas

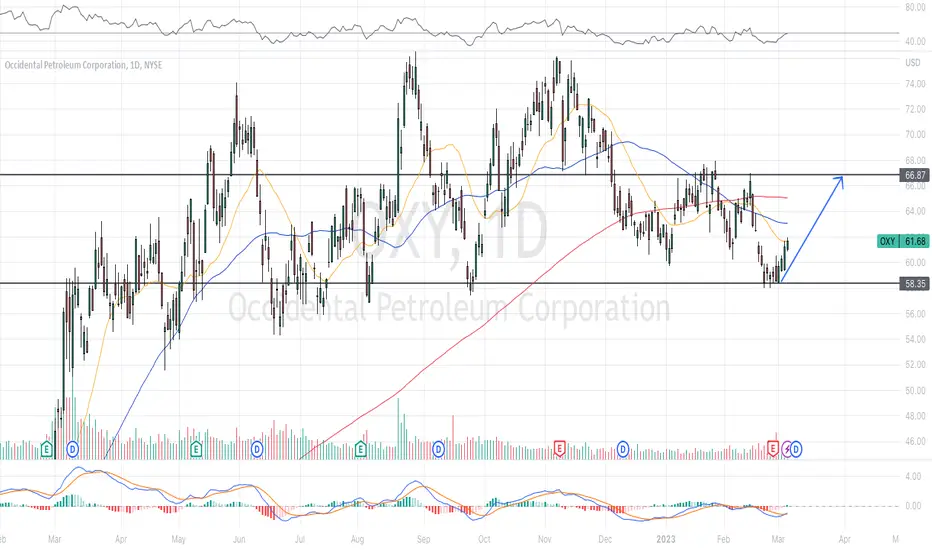
OXYWe've been long on OXY since the 56-57 support.
Already up nicely but I think this one can run more.
You can always DM me for anything trading related !!

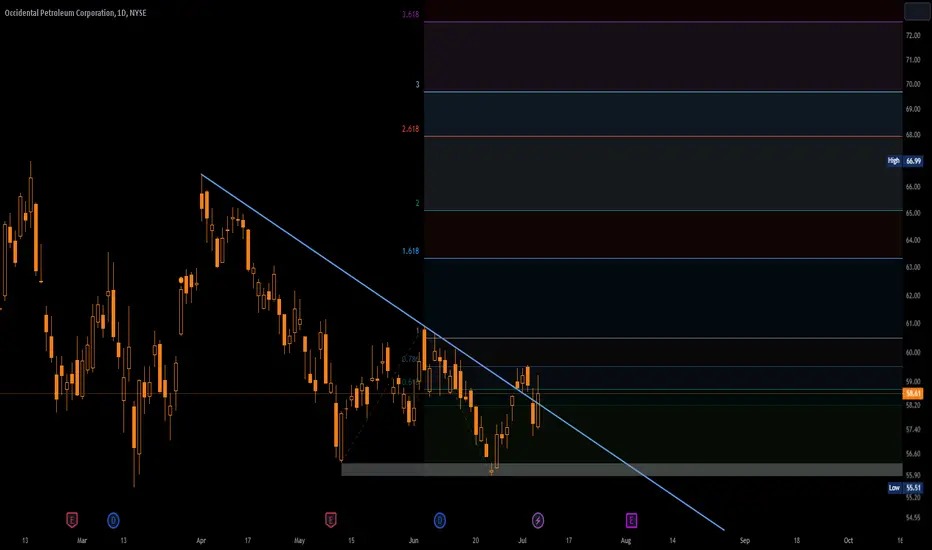
Still bullish on Crude & OXYIm going to try and post this a THIRD time now, as you can see from the first post on June 26th & June 28th. Apparently you cant utilize the Twitter post feature on charts because its solicitation or advertisement, even though im just using the timestamps to show I actually called it publicly like I am stating here.
==========================================================
"Ive been looking at AMEX:XLE and NYMEX:CL1! lately and becoming more bullish for multiple reasons, specifically on NYSE:OXY
OPEC supply cuts and Geopolitical tensions with BRICS nations could cause supply uncertainty
The US Strategic Petroleum Reserve's have been drained
Tech exhaustion is setting in and I believe buyers will rotate into Energy
Trading well after breaking $70/bbl
WTI 50DMA is $73.45
CTA flows are skewed to the upside
OXY 52w low 55.51 - 52w high 77.13 (todays open - 56.15)
price-to-sales ratio in 2016 was 5.5 and is currently 1.54 now
Berkshire keeps buying more and now owns 24.97% of OXY
So my thesis is a mixture of macro, fundamental and technical indications.
The risk-to-reward ratio was there for me so I went long at 1030am on the pullback 6/26/23 and add more on 6/27/23 on the big pullback.
XLE was the leading sector by a mile today.
It needs to clear 58 and 58.75 for a continuation higher.
The chart below illustrates all the timed purchases by Birkshire(Warren Buffet) and the amount of money in each order. As you can see, he buys around the same exact levels for the past year."
==========================================================
NYSE:OXY is currently sitting at 62.66, up roughly 11.6% since my original post 28days ago.
NYMEX:CL1! made a high of 79.28 today, up roughly 15.38% since my original post 28 days ago.
I believe it will be a slow grind from here to 82, but that break upwards needs to happen for continuation.
I maintain my thesis on Crude and the rising tension in the GeoPolitical climate and how it will affect its price. The Saudis maintain their resolve to lessen production in accordance with OPEC. I have theories relating to this one on a potential good trading setup which I will post later. That is all for now.

occidental petroleum is ready to jump occidental petroleum is forming triangle or diametric pattern ,
What is clear is that wave B is almost over and wave C may have $100 target

use 60c expired on 08/18 to trade its earningTipRanks: Based on 13 Wall Street analysts offering 12 month price targets for Occidental Petroleum in the last 3 months. The average price target is $70.92 with a high forecast of $82.00 and a low forecast of $62.00. The average price target represents a 21.00% change from the last price of $58.61.
Expected Move: +/- $1.5
ATR: $1.2
My bullish price target: $62
$Oxy Oily Boiiis Back?NYSE:OXY im seeing a triple bottom/ distribution. Im bullish just bc of the chart. I think the R/R on a swing position targeting mid to upper 60s is great over 58. oil doesnt nornally move fast, so likely guna need time to eat on this. however, we have a sharp reversal so the momentum could continue from the big bounce today.

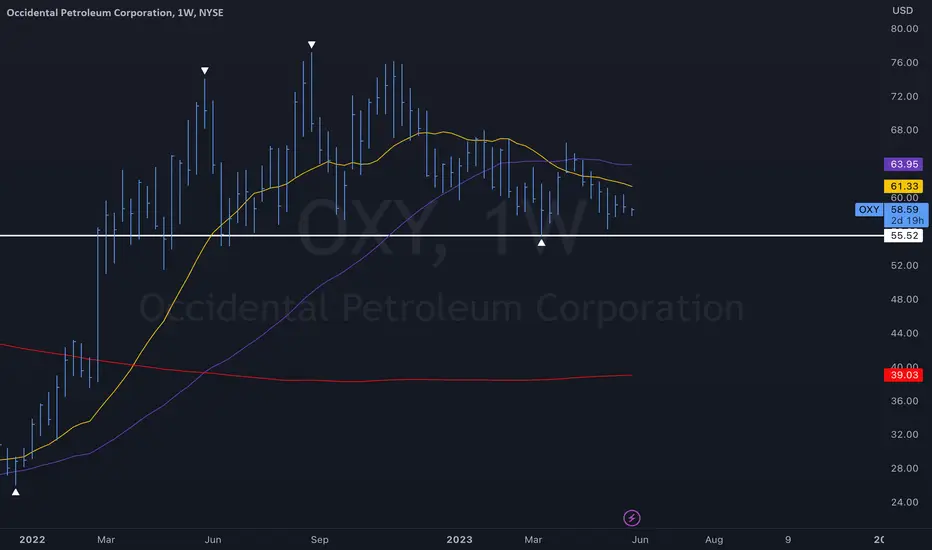
OXY breakdown is clearJust over 6 months ago, OXY was flagged to technically not do the expected rally as it broke down of the H&S shoulder. Many had bought in following the reported Berkshire's purchases of OXY , BUT technicals was telling of another type of scenario. Watching the breakdown was rather painful as it stretched over the last 6 months, with a recovery attempt that failed the shoulder line the second time, as if not clear enough.
Finally, this week closed below the channel trendline (adjusted from previous analyses). Furthermore, this is the 52 week second lowest weekly close... good enough to tell that it will be the 52 week lowest close soon.
Technicals are bearish, not very but clearly.
Therefore, more downside is expected up till October and looking at a target of 50.
The bearish marubozu may be indicating the rather strong downward momentum too.
Point here is that it was clear and heads up given 6 months earlier. Now, we take delivery.
Also note that the USD appears to be strengthening (a lot?) and this can push the breakdown further and faster. The overall equity markets are overbought, and if it is time for a retracement, then OXY can be affected further.
Heads up... again.

$OXY bullish above the horizontal lineMr. Buffet keeps buying NYSE:OXY but a closes below the weekly horizontal line and the next support is the 200 weekly moving average.
Inside and UP for $OXYCan NYSE:OXY take out both pivots on the 2 Day chart? Would be a nice inside and Up as per #TheStrat

$OXYNYSE:OXY
Looking good for longs her eon the support trend line, trying to get above anchored vwap.
stop loss: any strong close below 57.97$.

OXY: Buy ideaBuy idea on OXY as you see on the chart because we have a good spring effect on Vwap indicator.Thanks!

look for buys on the pull backHello,
Look for buys on this stock once you see a pull back. Buying at the current levels does not make sense to me since the risk to reward ratio will not be great.
I will be looking for buys from 53 areas with the top as the target.
Best regards,
The shark ke

OXY: Sell ideaAs you see on the chart on OXY we have a sell idea after the breakout of vwap indicator.Thanks.

Bullish Reversal Expected for Occidental Petroleum (OXY) NYSE:OXY Occidental Petroleum (OXY) experienced a sell off on May 8th, with a decrease of $1.73 (-2.85%). The stock has a very strong support level at $58.64, and I believe that if OXY reaches this level or falls slightly below it, a bullish reversal is likely. This pattern is similar to what happened on May 4th, 2023. Traders should also be aware that OXY is scheduled to report earnings after the closing bell tomorrow.
We anticipate a potential bounce for OXY at the strong support level of $58.64. If the stock hits this level or falls slightly below it, we expect a reversal to the upside, similar to the price action observed on May 4th, 2023. Our target prices for this bullish reversal are:
1. Target Price 1: $60.11
2. Target Price 2: $61.16
Occidental Petroleum is set to release its earnings report after the bell tomorrow. This event could introduce additional volatility and impact the stock's price in either direction. Traders should monitor the situation closely and be prepared to adjust their strategies based on the earnings results.
In summary, this trading idea suggests a bullish reversal for Occidental Petroleum (OXY) at the strong support level of $58.64, based on the technical analysis from May 8th. However, traders should be cautious and prepared to adjust their strategies in response to the company's earnings release tomorrow, which could lead to increased volatility in the stock's price. As always, it is essential to manage risk and maintain proper trading discipline when executing any trading idea.

OXY longBuffet name, pretty good value name in this environment
Insiders buying pretty heavy
fundamentally,
- operating margin was up significantly in 2022 at an average of 36.6
- net income up huge over the last 6 years average
- assets to liabilities is solid: ~75b in assets, ~45b in liabilities
- free cash flow up significantly last year, and well over 6yr average
- p/e is an avg of 5, p/cf is an avg of 3.75 for '22
technically,
- long term vwap anchored to the last higher low before '22 regime change acting as weekly support
- weekly RSI getting close to bottoming territory

oxy price bullish ideaas you can see, the major structure is sideway
price trap the support level
price then made inverse head and shoulder breakout and retest which complete falling wedge pattern
and ready to go up
oil price has positive impact from supply side , oil future also show bullish momentum.

Analysis of OXY stock price breakout and potential continuation It appears that there has been a breakout of resistance at the level of 61.88 in the price of the stock of OXY.
This breakout could potentially lead to a continuation of the upward trend in the price, with a possible target
of 66.46. On the downside, there is a support level at 60.47, which could act as a barrier to further declines
in the price. Overall, it seems that the price of OXY may be in a bullish phase, as evidenced by the breakout
of resistance and the potential for further gains. However, as with any investment, there is always a degree
of uncertainty and risk involved, and it is important for investors to conduct thorough research and analysis
before making any decisions.

Everyone is talking about OXY, are you ?Wait a minute ! Are you feeling the heat when the market is talking about this kid in town ? Read article here
It met with its resistance at 68.24 price level but I believe this will soon be taken out and the price action will pierce through it. The overall high Oil price is definitely helping companies like OXY and others as well.
For those who are core fans of Warren Buffett and believes in his foresight in choosing companies (he has definitely proven it !!!) could enter now while those who are more cautious can wait for the price action to break above the resistance level and await a bullish signal.

Channel DownA channel down is a channel down until broken.
This happens a lot as of late but seems many only make it the next strong resistance level.
There is a lot of R overhead. Buffett bought more of
this again I hear.
There is an old rising wedge that has not been broken yet so it is not valid. If this wedge is broken it could take price under 30.
No recommendation.
Strong bullish Marubozu candle that appears shaven on both ends today.

$OXY, Insider and Buffet bought sharesManagement has been aggressively buying back shares
Strong earnings should allow management to continue dividend payments
Cash flows can sufficiently cover interest payments
Prominent player in the Oil, Gas & Consumable Fuels industry
Barclays analyst raised the price target on Occidental Petroleum (NYSE:OXY) to $78.00 (from $70.00) while maintaining a Overweight rating.


OXY: Two situations: Bullish ChannelOn OXY we have two situations. Firstly we would have an uptrend if and only if the resistance line is forcefully broken by a large green candle and accompanied by large green volume. Secondly, we would have a bearish trend if the vwap indicator as well as the support line are forcefully broken by a large red candle and followed by a large red volume.Thanks!

Occidental Petroleum Corp. ($OXY) LongLook for a bounce on $OXY off support to regain 50dma and test 66. OXY 3/31 62C for $2 looks pretty good for a swing.