PFENot financial advice. The essence of investing & trading is the intelligent and patient preying on the greed, fear, impatience, addiction and ignorance of the majority. It's definitionally Darwinian.
PFE trade ideas

#PFE to 56$?Hello dear Traders,
Here is my idea for #PFE
Price closed above yellow line (previous month high)
Price closed (15min Chart) above purple trigger line to enter trade.
Targets marked in the chart (black lines)
Invalidation level marked with red line
Good luck!
❤️Please feel free to ask any question in comments. I will try to answer all! Thank you.
Please, support my work with like, thank you!❤️

$PFE - descending wedge breakout watch$PFE looks like its about to breakout from descending wedge. A break above $48.50 could send the stock to $51.24. Long term max breakout target is $60.
Target 1 - $51.24
Target 2 - $53.89
Target 3 - $60
Stop loss - $46.23 and below.
Trade is done when it hit one of the target or stop loss is hit.
Disclaimer: Trading note. Not an investment advice.
2X $PFE PUTS SET TO PRINT !????? Possible -10% FALL Pfizer is forming a head and shoulders pattern on the 2HR timeframe it has broken the right shoulder trendline and we will look to enter short and puts and play pfizer stock down to the next key levels!

$PFE with a Bullish outlook following its earnings #Stocks The PEAD projected a Bullish outlook for $PFE after a Positive over reaction following its earnings release placing the stock in drift B with an expected accuracy of 50%.

PfizerLiedPeopleDiedPfizer (NYSE:PFE) said its bivalent RSV vaccine candidate met a main goal of showing efficacy against severe disease but did not reach statistical success in the second main objective in a phase 3 trial in pregnant women who given the vaccine to help protect their infants from RSV disease after birth.
The phase 3 study, dubbed MATISSE, evaluated the bivalent RSV prefusion vaccine RSVpreF (PF-06928316) against placebo to test efficacy against medically attended lower respiratory tract illness (MA-LRTI) and severe MA-LRTI in infants born to healthy women vaccinated during pregnancy.
The study enrolled ~7.4K pregnant individuals who received RSVpreF or placebo during the late second to third trimester of their pregnancy.Pfizer said that an interim efficacy analysis met the success criterion for one main goal. The observed efficacy for severe MA-LRTI was 81.8% through the first 90 days of life, and efficacy of 69.4% was seen for infants over the six-month follow-up period.
The company noted that although the statistical success criterion was not met for the second primary goal, clinically meaningful efficacy was seen for MA-LRTI of 57.1% in infants from birth through the first 90 days of life. Meanwhile, efficacy for MA-LRTI of 51.3% was observed over the six-month follow up period.The vaccine was well-tolerated with no safety concerns for the individuals and their newborns, the company noted.
Pfizer said that at the recommendation of a Data Monitoring Committee (DMC), and in consultation with the U.S. Food and Drug Administration (FDA), the company has stopped enrollment in the study. Based on these results Pfizer plans to submit an application to the FDA by the end of 2022 seeking approval of the vaccine.
IF #PfizerLiedPeopleDied is trending, possibly it is time for Short, just thoughts.
The investments and idea published may not be suitable for all investors. If you have any doubts as to the merits of an investment, you should seek advice from independent financial advisor or other professionals to determine what may be best for your individual needs. We do not and cannot guarantee that your use of our APP and/or any of its features will generate profits. All opinions, news, reviews, research, analysis, prices, or other information contained on or provided via this site are provided on an “as is” basis as general market commentary and/or expressions of opinion only. Information may not be complete, accurate or up to date and may not be suitable for every individual, nor be a suitable basis for an investment decision. No representation, warranty, undertaking, assurance or guarantee (express or implied) is made or given as to the availability, adequacy, accuracy, completeness, reasonableness or appropriateness of any of the information or opinions provided or expressed on or through this site. There is no obligation to notify you of any corrections or modifications.

expect higher pricesPFE bounced off support level
(prev resistance)...
now the Govt will make covid vaccine
part of the system .. so expect more profits for PFE.
also they are increasing prices by 4 times.
when you sit close to govt, you can win.

ready for a pullback?1. above the monthly-weekly-daily opens...Green all around
2. nice close above trendline
3. double bottom'ish
4. nice volume from friday
I like this for a retracement entry

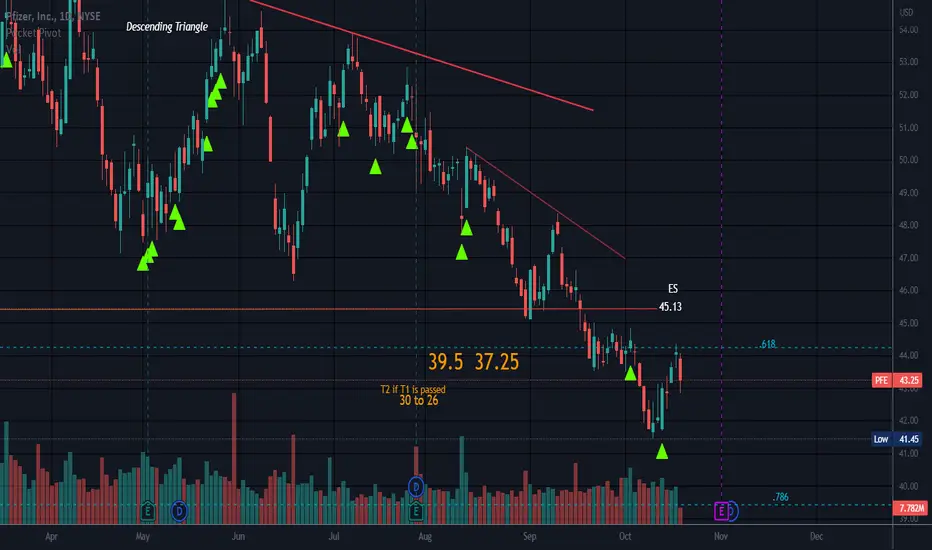
Descending Triangle Price is below bottom trendline which is now resistance.
Earnings 11-1 BMO. Estimates are much lower than last quarter/soft numbers but it is the reaction to the news that counts I suppose..
No recommendation
PFE - Potential Major Top My work shows PFE could be forming a major top in this area.
Long tailed dragonfly with a big gaping gap currently.
Target $23 area.
Not advice.
PFE - Major Collapse IncomingTo continue from my previous thread from a while back.
PFE did top out at fib confluence area and it appears to be a blow off top that should lead to a higher degree correction / collapse.
Will see how it reacts to the 50WMA and lower channel trendline but I am expecting it to at hit the 200WMA at least and I think it may well get as low as $22
Not advice.

Pfeizer to Set New Local Lows. PFEAnother zigzag well in formation with a triangular B Wave. We are anticipating C Wave Shortly. Do not be dissuaded by diminshing negative momentum - Elliott prevails over all.
We are not in the business of getting every prediction right, no one ever does and that is not the aim of the game. The Fibonacci targets are highlighted in purple with invalidation in red. Confirmation level, where relevant, is a pink dotted, finite line. Fibonacci goals, it is prudent to suggest, are nothing more than mere fractally evident and therefore statistically likely levels that the market will go to. Having said that, the market will always do what it wants and always has a mind of its own. Therefore, none of this is financial advice, so do your own research and rely only on your own analysis. Trading is a true one man sport. Good luck out there and stay safe.

Pfeizer is going down. PFEThese guys apparently manufacture COVID vaccines that do not seem to work. Anyway, this one is heading low.
We are not in the business of getting every prediction right, no one ever does and that is not the aim of the game. The Fibonacci targets are highlighted in purple with invalidation in red. Confirmation level, where relevant, is a pink dotted, finite line. Fibonacci goals, it is prudent to suggest, are nothing more than mere fractally evident and therefore statistically likely levels that the market will go to. Having said that, the market will always do what it wants and always has a mind of its own. Therefore, none of this is financial advice, so do your own research and rely only on your own analysis. Trading is a true one man sport. Good luck out there and stay safe.

Longing Pfeizer on the Rebound. PFEPost a very juicy short on PFE, its time to reverse the direction. When facts change, our opinion also changes.
We are not in the business of getting every prediction right, no one ever does and that is not the aim of the game. The Fibonacci targets are highlighted in purple with invalidation in red. Confirmation level, where relevant, is a pink dotted, finite line. Fibonacci goals, it is prudent to suggest, are nothing more than mere fractally evident and therefore statistically likely levels that the market will go to. Having said that, the market will always do what it wants and always has a mind of its own. Therefore, none of this is financial advice, so do your own research and rely only on your own analysis. Trading is a true one man sport. Good luck out there and stay safe.

PFENot financial advice.
The essence of investing & trading is the intelligent and patient preying on the greed, fear, impatience, addiction and ignorance of the majority. It's definitionally Darwinian.

Accumulating PFE from $46.00 - $47.50 This is one of the stocks I hold indefinitely for dividends.
we're at the bottom of our current channel and a double bottom is forming in a major area of support.
In my previous post I stated my accumulation sections are in the lower end of the channel, so this is prime real estate to enter.
Momentum downwards has come to a halt and I believe we will retest the center channel line from this point.
I am diversifying a portion of profits I made from the last 2 trade set ups I've posted into PFE. A fundamentally sound entity in our current market economy.
I'm sure you could assume why.

Charts to Pay Attention To!Just surfing the charts, seeing what's going on with stocks I haven't traded in a while and seeing a lot of things that I am like "Why is no one talking about it?!".
Let's start (also, these are not math based assessments, simple chart setup based assessments):
1. Pfizer, the most obvious. We have it forming a descending triangle. Whether these are bearish or bullish tends to be hit or miss but generally they signal an impending bigger move coming. Be watching to catch it!
RTX
2. RTX has broken out of a demand zone and is holding. This zone has been a reflexive area as of late and historically where RTX bounces. It has an overhead gap around 91 to 92 on the hourly chart. If RTX holds this breakout of the demand zone, the next area of slight resistance is around 91.
CLX
3. CLX (Aka Clorox) honestly takes the cake. This is a really convincing chart and I am planning on probably scaling into a position for a longer term hold on this on Monday. Solid fundamentals as well CLX is trading in a low it hasn't seen since around 2018, this is something both investors and traders should be watching closely!
CP
4. Ah yeah, the notorious bullish bird. My personal favourite (and invented) pattern. We see that CP has broken up of the fluttering wings of my notorious bullish bird. Positive momentum with it favoring a bullish continuation into next week based on a simple probability assessment. We should be seeing it hit the 80 mark very soon and expect to see some pullback before any continuation up. But I am personally watching this myself.
T
5. Poor AT&T. Regardless of your position on this company and its practices T has not seen these lows since 2009. Its extremely oversold and its likely going to rebound in a massive way and you can bet that I am going to be looking to enter on Monday.
TMO
6. Company with a sick name. Does a lot of research analytics stuff. I am not overly familiar with their fundamentals, aside from solid earner and established company that has continued to deliver to investors, which is great, but so is its chart.
That's it!
Just wanting to draw notice to some of these more neglected stocks that not many think about.
Hope you found it interesting!
Trade safe everyone!

$PFE buyPfizer has reached weekly support and bulls are getting in with power from lower timeframes.
we can buy now


PFIZER Early approval for Vaccine Today PFE announced they may get the results of vaccine trials by the end of number and they may apply for early approval from FDA, the chart indicate breakout from down channel , also show reversal head and shoulder , PFE may finally end the long term down trend as they will benefit from vaccine manufacturing and distribution , please share your thoughts.

Pfe curving bottom? Chart shows over reaction and intentional crash and ignore COVID 2023 revenues to ZERO.
Close to oversold on RSI.

make or break time ⌚so close to breaking this extreme support today, I would not be surprised if we saw a gap down below it soon. This doesn't mean we should rush into a trade though, remember its better to wait for a clear break! many traps in this market for both sides, so trade with extra caution.
Watching for downside continuation below 45.52, longs above 47.31

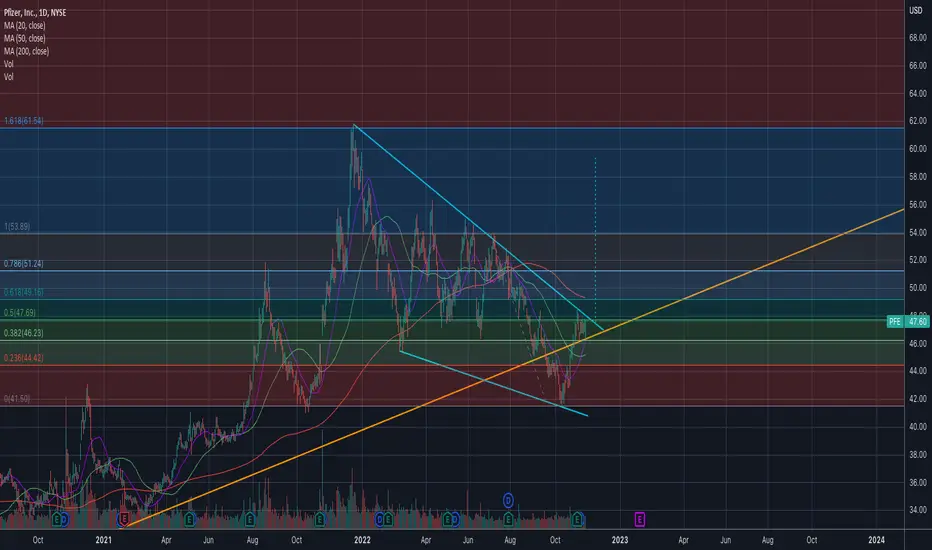
Pfizer's going to rocket?I didn't take a look at Pfizer for quite a while, but just recently going through the list of my favourite stocks I noticed it from the first glance. Something is going to happen...
This declining volume, overlapping of price and a bit of a volume spike on 11th August, all seems to be in line.
The 3rd wave formed in December 2021 and we had a correction for almost a year, now it's time to move on. Fly PFE fly!
Invalidation point is 46.28, with min target of 61-65.
Good luck trader!
