Will PFE take Another Run @ $62 ? Pool Guy Thinks So !PFE had a nice reversal this week, putting in a nice hammer candle on the weekly, bouncing nicely off of the 2001 ATH.
For those with a high tolerance, I'd buy @ $47.50 with stop @ 10% lower. Another run at the all time high will bring us back to $62, or a gain of 30%. A low risk trade with a 3:1 reward if you use the price levels on the chart. Those with a lower risk tolerance would wait for confirmation with next week's weekly close.
On top of that - we should not forget that they have a product likely to be in high demand for some time - which is of course COVID vaccines - probably the only thing better than erectile dysfunction pills.
For those of you old enough to remember, Viagra was the drug that sent them to their 2001 ATH.
Find me a better product than COVID vaccines for a company to sell - the only thing better than penis pills or cigarettes !
PG
PFED trade ideas

Unsustainable Business Modeling Pfizer is losing year after year in producing Antibiotics. Even the most recent Vaccination effort can be looked at as a pitiful failure. Proper Diet and Exercise can solve all of your Health problems anyways. Did you know every 7 years the Human Body completely regenerates itself?

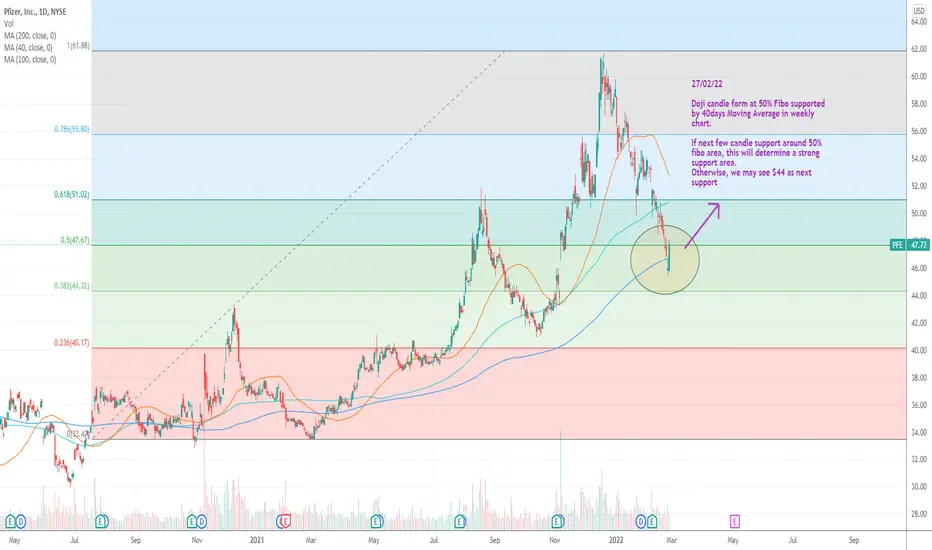
Bias more on upside supported by 40days moving average27/02/22
Doji candle form at 50% Fibo supported by 40days Moving Average in weekly chart.
If next few candle support around 50% fibo area, this will determine a strong support area.
Otherwise, we may see $44 as next support
MACD Confluence is the best standalone indicator signalAfter reading Technical Analysis by Gerald Appel(inventor of MACD), I have realized the strength in the MACD's accuracy lays in using it on multiple time frames in intervals of 4-6x for each chart.
To determine an entry, all 3 charts need to be crossed in the same direction. The trade is higher conviction if you have multiple crosses and also above 0 on the histogram, especially on the higher time frames. When the MACD line is above 0 it's showing strength in that particular direction until a cross shows otherwise.
This example on Pfizer very easily describes this example. The 30 Minute MACD line is trending up towards 0. The 5 Minute MACD line is above 0. It's opening crossed below the signal, but it's still above 0, meaning it is hasn't crossed multiple moving averages downward yet.
At 9:36am, on the 1M Chart, the MACD line has a bullish crossover up above 0. It is showing strong convergence with the 5M crossing up and the 30M going above 0.
If you are scalping. You are taking MACD crosses on the 1M as entries and exits.
If you are day trading. You take entries on the 1M and exits on the 5M.
This example is for scalpers and day traders on the 1M/5M/30M timeframes. The same can apply for swing trading with the 15M/1H/4H. This even works with position trading(1D/1W/1M), although you may wind up getting too many signals than simply following MACD crosses on the W and M.

PFE-BUY++We are at interesting buy levels. The move down is overdone, and that is why a low RSI level.
Strategy is BUY current $ 46 area and lower down again $ 43-44 and profit order at $ 52.50 for now.
PFE still lower to go. Pfizer looks to test $50, and possibly the gap around 46~ if things get really ugly. Omicron is looking really promising as granting significant immunity after infection, which should reduce demand for further vaccinations. These vaccines companies have YEARS of covid priced into their stocks... Short side is getting a bit long in the tooth for new entries, however I am still holding 2/3rds of my puts across the board for these plays.
We posted our short thesis in another thread www.tradingview.com

PFE | Shorting the Vaccine 💉My current position and play is marked on the chart. I am expecting more selling pressure to come in now that we closed below the nearest zone. Expectation is that PFE will head toward the next zone located at the bottom. I will be trailing my stop once PFE begins the bearish move.

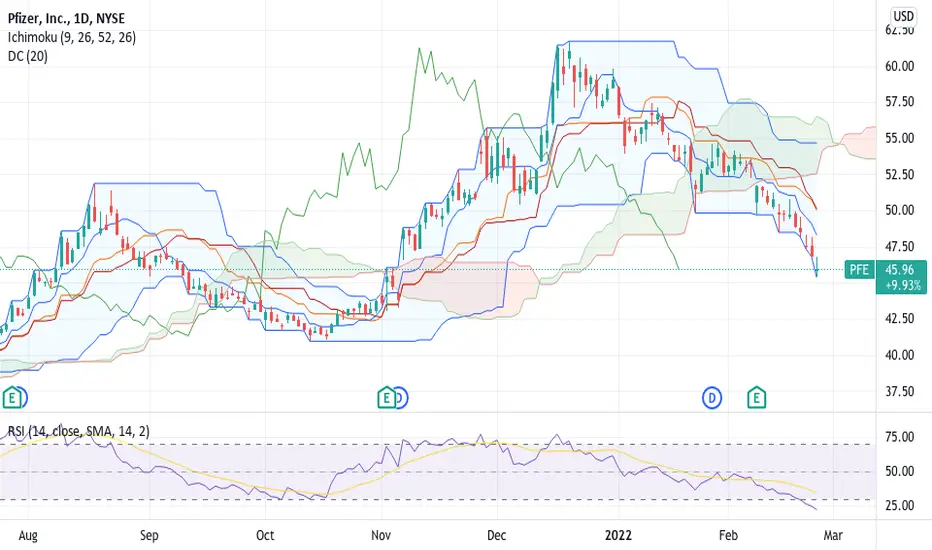
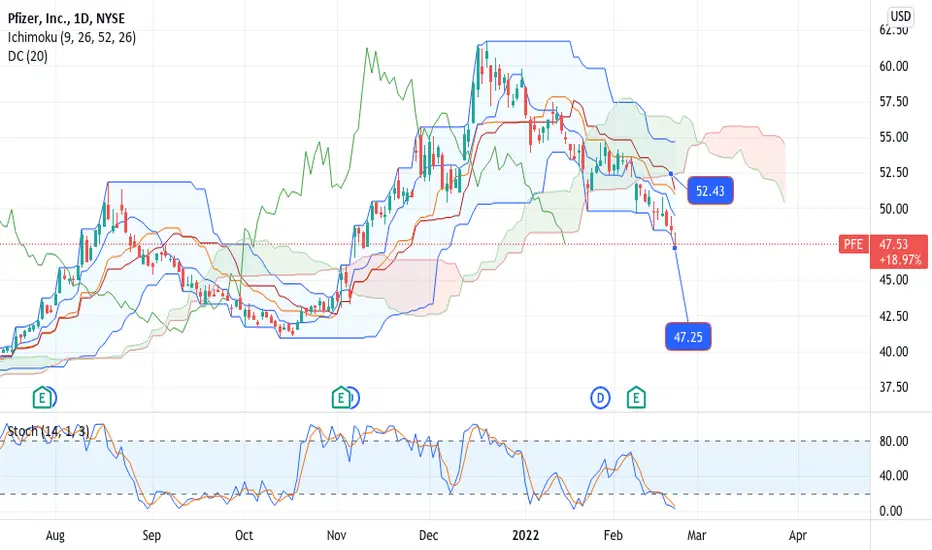
PFE-BUY strategyThere may be still little room lower, but it will not be a lot I feel. the DC suggest the lower move, and the stochastic is negative, but low level.
Strategy BUY $ 44-45 area for a move back towards $ 55. Stop-loss let's say around $ 38 for now.
PFE Long'sAll Long entry points on PFE:
The best Long entry: $39.46
2nd: $41.93
3rd: $43.32
4th: $45.07
5th: $47.99 price is currently trading at this Bull zone, so there could be a bounce here, potentially back up to $52.90 before moving lower.
All Exits:
Best: $59.83
Get out when you want, whenever you're in profit.
SL: $33.90
Risk: 15 - 20%
This play assumes that price will move back up to $59 dollars at least. In the future Bull moves that Pfizer will make. Looking for another breakout to the upside. A repeat similar to the Bull move that happened at $39 and $41.90.

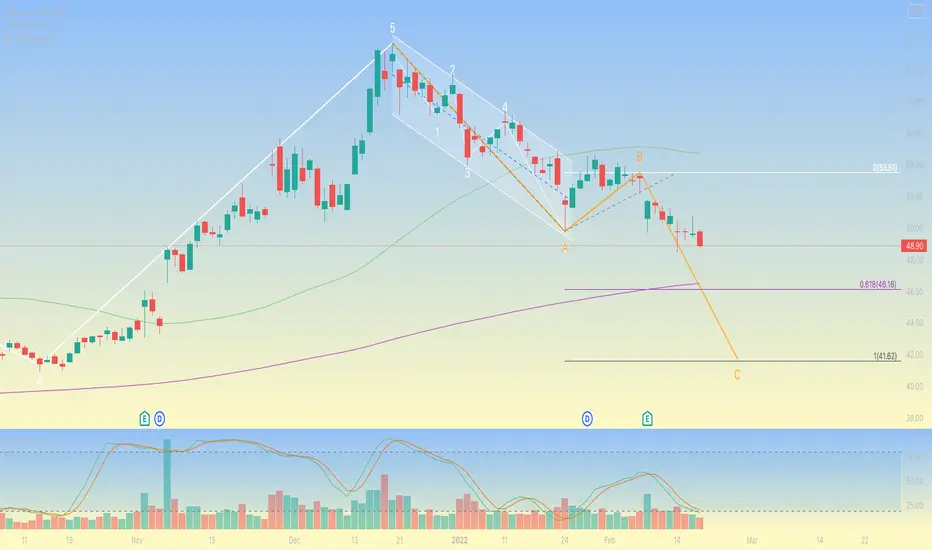
Pfizer more to drop
I see a 5 waves move up finished at $61 on 20th December, fallowed by an A-B-C standard correction.
Using the guideline of equality A=C and the Trend Based Fibonacci extension Pfizer will drop till about 1 level or $41.
This has support as well from $41 OCT 2021 level which is also the W4 level in the previous impulse movement.
Disclaimer:
This is my analysis and does not constitute financial advice
For more analysis like this ON DEMAND please leave me a message.
PFE - SEL strategyThe sell strategy so far working well. I think we may add to the position $ 57-59 range.
Profit target now $ 47.75 (adjusted). Stop loss changed to $ 61.

$PFE - From hard on pills to covid. A story of corruptionIt is not really a story of corruption. It is crazy that the two most successful times in this company's career was by creating Viagra and creating Covid...errrr I mean the vaccine for one of the covid strands....sometimes...when it works. Screw it though!!! The government is giving them billions and billions of dollars for no reason!!! Let the good time roll baby!! I think she will retest the breakout and then continue higher for as long as a democrat is president. I mean covid exists. Dang it....you know what I mean. As long as the US government funnels them billions unnecessarily. I cant stand the CEO and he should be in jail. I choose to be in MRK or many others instead. Not that they are really much better, but PFE CEO is truly an evil person. Good luck to you crazy people who stick with it.
This is not a recommendation to buy or sell. It is for informational purposes only.

3 analysis shows that might be the end of corrective wave harmonic pattern
with good cluster of fibonnaci price
hidden divergence
good luck

PfizerLets see if price can fill the gap
waiting for price to test the lower boundary and volume spikes

Pfizer RSI bearish divergenceon weekly we can see bearish divergence on RSI. there is also possible h&s forming. we have also fundemantals about rigged vaccine trials for emergency authorization acceptance, vaccine deaths piling up and big shareholders of Pfizer dumping their stock.
sell now!
first profit target 32$
second profit target 1$

PFE1Y
RSI is at a top.
MFI is topping.
5Y
RSI is trending up.
MFI is trending down.
ALL
RSI topped.
MFI is topping.
www.conservativebeaver.com
Prediction: The indicators don't look good for too much more upside, but this article sure will drop the stock soon. Falling. There is also a gap at $15.
For my educational purpose, not to be used as financial advice.

Pfizer: Ready to Shoot Lower? Pfizer - Short Term - We look to Sell at 49.33 (stop at 51.54)
The trend of lower highs is located at 53.50. Previous support located at 50.00. A move through bespoke support at 50.00 and we look for extended losses. Closed below the 20-day EMA. The medium term bias remains bearish.
Our profit targets will be 43.51 and 41.00
Resistance: 54.00 / 57.00 / 60.00
Support: 50.00 / 45.00 / 40.00
Disclaimer – Saxo Bank Group. Please be reminded – you alone are responsible for your trading – both gains and losses. There is a very high degree of risk involved in trading. The technical analysis, like any and all indicators, strategies, columns, articles and other features accessible on/though this site (including those from Signal Centre) are for informational purposes only and should not be construed as investment advice by you. Such technical analysis are believed to be obtained from sources believed to be reliable, but not warrant their respective completeness or accuracy, or warrant any results from the use of the information. Your use of the technical analysis, as would also your use of any and all mentioned indicators, strategies, columns, articles and all other features, is entirely at your own risk and it is your sole responsibility to evaluate the accuracy, completeness and usefulness (including suitability) of the information. You should assess the risk of any trade with your financial adviser and make your own independent decision(s) regarding any tradable products which may be the subject matter of the technical analysis or any of the said indicators, strategies, columns, articles and all other features.
Please also be reminded that if despite the above, any of the said technical analysis (or any of the said indicators, strategies, columns, articles and other features accessible on/through this site) is found to be advisory or a recommendation; and not merely informational in nature, the same is in any event provided with the intention of being for general circulation and availability only. As such it is not intended to and does not form part of any offer or recommendation directed at you specifically, or have any regard to the investment objectives, financial situation or needs of yourself or any other specific person. Before committing to a trade or investment therefore, please seek advice from a financial or other professional adviser regarding the suitability of the product for you and (where available) read the relevant product offer/description documents, including the risk disclosures. If you do not wish to seek such financial advice, please still exercise your mind and consider carefully whether the product is suitable for you because you alone remain responsible for your trading – both gains and losses.

$PFE - Sitting on the neck line... In my previous chart I was leaning on head and shoulder not playing out. But now with war about to break out in Ukraine, I am not so sure that the neckline area of $50.25 will hold. We have been on an uptrend that started since March 2021 and has checked back to the trend line once before. If we were to check back to the trend line again after the head and shoulder neckline breaks, it could close the gap at $45.99.
I will be watching $50.25 - $49 area to see if that support can hold. If it breaks, the bear case will play out and we can see $45.99.
Bear Target 1 - $45.99
Neckline - $50.25
Bull case - bounce from neck line and move towards $62.
———————————————————
How to read my charts?
- Matching color trend lines shows the pattern. Sometimes a chart can have multiple patterns. Each pattern will have matching color trend lines.
- The yellow horizontal lines show support and resistance areas.
- Fib lines also show support and resistance areas.
- The dotted white lines show the price projection for breakout or breakdown target.
Disclaimer: Not investment advice.

Pfizer - PFE - is this the end of Pfizer?I guess Pfizer's stock price could help us with knowing when this Covid nightmare might be drawing to a close. This count suggests that we might be about to begin a 5th of a 5th of a 5th. If this count has any merit and the trend does end then we can expect some serious downside to this stock some time in the not too distant future. (A more bearish count could be made for a completed 5th wave already taking place and I show that with the blue count, but the red count is my preferred count.)

Time to buy!Price hit the support again and is bouncing up ! In my opinion a position can be initiated at this level ! Maybe half position now and the second half either on a break of the down trend line or either at the lower support in case the current support breaks ! The dividend is also good ! Just my view :)

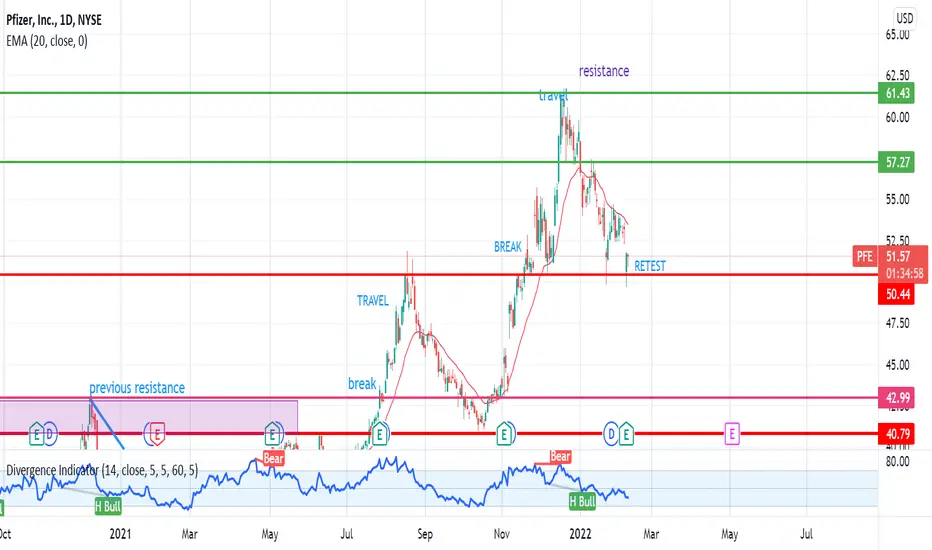
PFE Long from 50.44 levelpfe had a earing report this week. price respected the 50.44 level. would look for buy opportunities.
Pfizer Analysis 08.02.2022Hello Traders,
welcome to this free and educational analysis.
I am going to explain where I think this asset is going to go over the next few days and weeks and where I would look for trading opportunities.
If you have any questions or suggestions which asset I should analyse tomorrow, please leave a comment below.
I will personally reply to every single comment!
If you enjoyed this analysis, I would definitely appreciate it, if you smash that like button and maybe consider following my channel.
Thank you for watching and I will see you tomorrow!

Pfizer - Might get worse! 😨-The reason why PFE is dropping is not the economical situation but rather the COVID situation which is getting lighter (at least in folk's mind) every day.
-We got omicron but it being a light virus almost like a flu also didn't catch much attention lately.
-This stock throughout the pandemic depended on negative news, whoever is chaos oriented invested in this company, but lets all agree that the better the health situation gets and less of a tragedy COVID becomes, the less attention will be on this stock.
-Not to say that the company is worthless now but it wont have the hype it had for sure!
-Earnings are forecasted to decline on average of 6.2% per year.
OUR TARGET PRICE:
$45-$50
