P&G Big potential move in sight.A beautiful and mature bull flag has formed on a key zone of support for the P&G stock. Typically, best practice is to wait for the breakout but I like this chart set up so much I am starting a position at the lows of the flag. I have a healthy stop just under the flag formation.
Set your alerts, this one is going to make some moves soon!
PGD trade ideas

Proctor and Gamble Run Dieing OffProctor and Gamble's massive run is coming to a potential end. Weakness is showing here with color rotations and TOP Signals printing.
Massive 20% run, really good time to take some profits.
Let us know what you think!

Procter & Gamble to break higher?Procter and Gamble Co - 30d expiry - We look to Buy a break of 154.72 (stop at 151.45)
Prices have reacted from 122.18.
Daily signals are bullish.
There is no clear indication that the upward move is coming to an end.
This stock has seen good sales growth.
154.65 has been pivotal.
A break of the recent high at 154.65 should result in a further move higher.
Our profit targets will be 162.88 and 164.88
Resistance: 154.65 / 157.00 / 160.00
Support: 149.00 / 145.00 / 142.00
Please be advised that the information presented on TradingView is provided to Vantage (‘Vantage Global Limited’, ‘we’) by a third-party provider (‘Signal Centre’). Please be reminded that you are solely responsible for the trading decisions on your account. There is a very high degree of risk involved in trading. Any information and/or content is intended entirely for research, educational and informational purposes only and does not constitute investment or consultation advice or investment strategy. The information is not tailored to the investment needs of any specific person and therefore does not involve a consideration of any of the investment objectives, financial situation or needs of any viewer that may receive it. Kindly also note that past performance is not a reliable indicator of future results. Actual results may differ materially from those anticipated in forward-looking or past performance statements. We assume no liability as to the accuracy or completeness of any of the information and/or content provided herein and the Company cannot be held responsible for any omission, mistake nor for any loss or damage including without limitation to any loss of profit which may arise from reliance on any information supplied by Signal Centre.

PG - Small double top spotted at key resistance zoneBelieve that there could be a potential bearish downside towards the support at 146-144 support zone. Thereafter, could have a potential rebound.

Consumer Defensive Plays for a Red December $PG $PEP $CATGiven these potential dampeners on holiday mood, what are some ways to eke out some green amidst a sea of read? In the current economic environment, it may be beneficial for investors to consider consumer-defensive or cyclical stocks as a defensive play. These types of stocks are typically less sensitive to economic fluctuations and tend to perform well during challenging market conditions. Here are three consumer-defensive/cyclical stocks to consider that are have seen steady gains over the past quarter and continue to look attractive:
Procter & Gamble (NYSE: PG): Procter & Gamble is a consumer goods company that produces a wide range of household and personal care products. As a consumer-defensive stock, it tends to be less affected by economic downturns, as people continue to purchase household essentials even during tough times. Additionally, Procter & Gamble has a long history of steady dividend payments, making it an attractive choice for income-oriented investors.
PepsiCo (NASDAQ: PEP): PepsiCo is a multinational food and beverage company that produces a range of products, including snacks, beverages, and cereals. As a consumer-defensive stock, it tends to be less affected by economic downturns, as people continue to purchase food and beverages even during tough times. Additionally, PepsiCo has a strong track record of steady dividend payments, making it an attractive choice for income-oriented investors.
Caterpillar (NYSE: CAT): Caterpillar is a cyclical stock that produces a range of construction and mining equipment. Cyclical stocks tend to be more sensitive to economic fluctuations, as demand for their products is often tied to the overall state of the economy. However, Caterpillar has a strong balance sheet and a long history of steady dividend payments, which may make it an attractive choice for investors seeking a defensive play in a challenging market.
Overall, these three consumer-defensive/cyclical stocks may be a good choice for investors looking for a defensive play amidst challenging market conditions. While they may not offer the same potential for growth as more risky stocks, they may offer a more stable and reliable source of income and may be less affected by economic downturns. As always, it is important for investors to do their own research and consider their individual investment goals before making any investment decisions.

PG Short PG has formed a broadening formation on the daily time frame and an ascending channel on the 4hr time frame. Currently PG has reached it's over head resistance. Current short region is from $150-$153.

PG : Booked profitsThere are chances for the move to continue to a price of about 176$. But if the FED decides to raise the interest rate to 0.75 basis points in the upcoming meeting, then I expect further crashes, so I decided to take some chips off the table.

PROCTER & GAMBLE Rejection approaching. Expect ~$140.Procter & Gamble (PG) has been on a relentless +23% 2-month rally (since October 10), breaking above all possible MA levels: the 1D MA50 (blue trend-line), the 1D MA100 (green trend-line) and the 1D MA200 (orange trend-line). Today it even broke above the August 16 High, the technical Resistance, making the first Higher High after breaking above the 2022 Falling Wedge pattern.
However despite the bullishness and us being long-term buyers on PG, we see the price approaching a level, which based on previous similar patterns, provided a sizeable medium-term pull-back.
That is the RSI on the 1W time-frame which has entered a Zone (red) that since December 2015 makes the price drop to (just below) its 0.382 Fibonacci retracement level. In January 2016, it found support on the 1D MA100, in October 2018 just below the 1D MA100 and 1D MA200 and in May 2020 some way below the 1D MA50.
At the moment the lowest MA is the MA50 but until the pull-back takes the stock lower, we expect the MA100 to be lower and quite possibly on or a little below the 0.382 Fibonacci, assuming this rally gets exhausted a little higher e.g. 153.00. This translates into a 0.382 Fib at 141.20, which makes $140 a fair pull-back price to buy for the next long-term wave to test the 165.40 All Time High Resistance.
-------------------------------------------------------------------------------
** Please LIKE 👍, SUBSCRIBE ✅, SHARE 🙌 and COMMENT ✍ if you enjoy this idea! Also share your ideas and charts in the comments section below! This is best way to keep it relevant, support me, keep the content here free and allow the idea to reach as many people as possible. **
-------------------------------------------------------------------------------
You may also TELL ME 🙋♀️🙋♂️ in the comments section which symbol you want me to analyze next and on which time-frame. The one with the most posts will be published tomorrow! 👏🎁
-------------------------------------------------------------------------------
💸💸💸💸💸💸
👇 👇 👇 👇 👇 👇

PG ShortBounce back to resistance
Earning: 7/29/2022 Est. -1.24
Short 146
Stop 142
Target 130, 122
Risk management is much more important than a good entry point.
I am not a PRO trader.
In my trading plan, the Max Risk of each short term trade should be less than 1% of an account.

PG LONG setupLooking to edge into this at 135.29 for a long position. Target is 170, on around 8/14/23. Plus 25.6%.

PG worth looking at hereProcter & Gamble with a dividend of 2,70%, ROE above 30%, solid balance sheet and P/E of a little over 20 is probably worth looking at here.

$PG with a Bullish outlook following its earnings #Stocks The PEAD projected a Bullish outlook for $PG after a Positive over reaction following its earnings release placing the stock in drift B with an expected accuracy of 88.89%.

AnalysisHello! As you see on the chart we will have a big probability of a downtrend after the breakout with force the vwap indicator and also the support line. In other hand, we will have a continuity of an uptrend after the breakout with force the resistance line.Thanks.

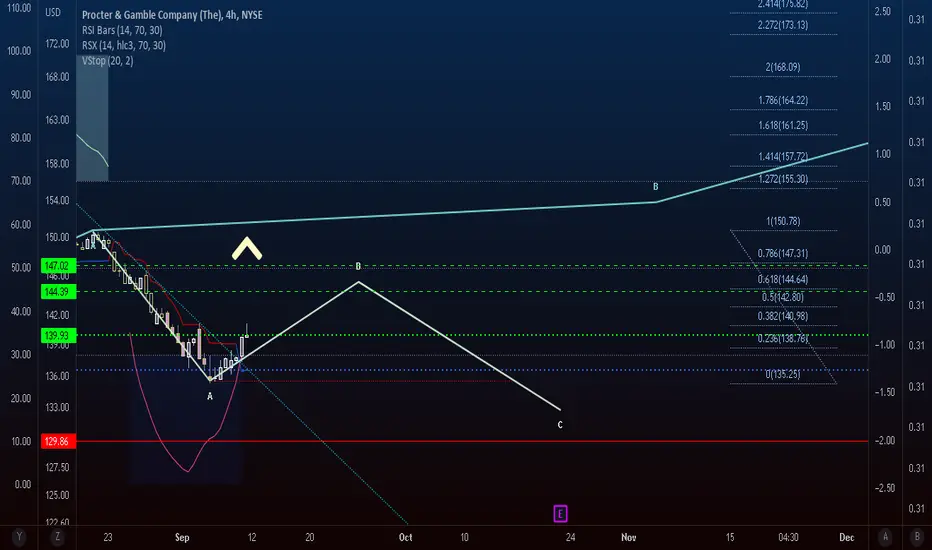
Procter and Gamble reversing. PGPrequalify for exit on A Wave impulse. Super early fib levels for entry, yet not oversold anymore. One attempt at trying to crack the origin of 5th Wave of A. Momentum upgoing here and on the major indices. Volatility flipped on the four hourly.
We are not in the business of getting every prediction right, no one ever does and that is not the aim of the game. The Fibonacci targets are highlighted in purple with invalidation in red. Confirmation level, where relevant, is a pink dotted, finite line. Fibonacci goals, it is prudent to suggest, are nothing more than mere fractally evident and therefore statistically likely levels that the market will go to. Having said that, the market will always do what it wants and always has a mind of its own. Therefore, none of this is financial advice, so do your own research and rely only on your own analysis. Trading is a true one man sport. Good luck out there and stay safe.
PG - Curve Leading to Further UpsidesSimilar curved uptrends can be seen in green rectangle
The first curved uptrend lead to a strong bullish continuation above trend line
Will the second have the same fate? (bars pattern placed)
Continuation result

Oil Lumber Coffee9. 14. 22 what is really profitable about these markets is that they hit a target with a good profit, and if you get out they move down to the breakout area where they went higher initially, in the market gives you another chance to make almost the same amount of money as the original trait. If you're thinking is that a market that reverses and goes higher, and then turn starts to go lower and is therefore going to make new lows.... you'll never take the tray it counts. 1 corollary to this is that if you never got in the market the first time around, then you can get into the market when it comes back to a lower price and a support. Even though this sounds obvious, if a market goes higher and then reverses to go, this does not mean that it's a bearish market, it's just a correction. The better question is how do you know which one it is? The answer is :Look for buyers! It sounds easy, but it took me a long time in my own Quest before I believe it. It's obvious, but it wasn't easy.

PG inverse HSH formationDear All,
chart seems to have an inverse HSH formation and it is almost occured.
This is not a financial or investment advice.

PG: Can we breakout?Procter and Gamble Co -
Short Term - We look to Buy a break of 148.20 (stop at 142.08)
The trend of higher lows is located at 138.75. This is positive for sentiment and the uptrend has potential to return. We are trading within a Bullish Ascending Triangle formation. A clear break of 148.00 and we would look for further gains to 163.00.
Our profit targets will be 162.98 and 172.00
Resistance: 163.00 / 172.00 / 180.00
Support: 140.00 / 130.00 / 120.00
Please be advised that the information presented on TradingView is provided to Vantage (‘Vantage Global Limited’, ‘we’) by a third-party provider (‘Signal Centre’). Please be reminded that you are solely responsible for the trading decisions on your account. There is a very high degree of risk involved in trading. Any information and/or content is intended entirely for research, educational and informational purposes only and does not constitute investment or consultation advice or investment strategy. The information is not tailored to the investment needs of any specific person and therefore does not involve a consideration of any of the investment objectives, financial situation or needs of any viewer that may receive it. Kindly also note that past performance is not a reliable indicator of future results. Actual results may differ materially from those anticipated in forward-looking or past performance statements. We assume no liability as to the accuracy or completeness of any of the information and/or content provided herein and the Company cannot be held responsible for any omission, mistake nor for any loss or damage including without limitation to any loss of profit which may arise from reliance on any information supplied by Signal Centre.

Procter & Gamble CompanyProcter & Gamble Company
Price 145.62 P/E (Trailing) 25.86
Change -0.68 P/E (Forward) 22.85
Change % -0.46% Dividend Yield 2.50%
Prev Close 146.30 Dividend 3.65
Volume 2,973,377 Market Cap 350.06B
Year Low 129.50 EPS (Trailing) 5.66
Year High 165.35 EPS (Forward) 6.40

PG OIL8.9.22 I started with oil. I was looking at market dynamics and describing how this Market may move higher and lower. I decided to look at PG (Proctor and Gamble) Because I believe it represents with might happen to other stocks in markets that most likely will trade much lower.

$PG with a Bullish outlook following its earnings #Stocks The PEAD projected a Bullish outlook for $PG after a Negative over reaction following its earnings release placing the stock in drift C.

PG's Important ZoneGood morning / afternoon / evening.
Decided to do a short term view on one of my favorite stocks out there.
After a miss Earnings and reached Revenue PG fell Below weekly support indicating that the price can be seeing lower levels in August.
129.4 - 135.06 zone is gonna be playing a essential technical levels for PG's share.
A very brief breakout can happen if price confirms 129.4 below, My opinion on this would be; waiting for a confirming levels to start DCA-ing PG.
I will update this post again, If you are interested you can follow me on it.
Cheers.
Disclaimer .
Do NOT trade or invest based upon the analysis presented on this channel. Always do your own research and due diligence before investing or trading. I’ll never tell you what to do with your capital, trades or investments. I’ll also never recommend for you to buy, sell, long or short any asset, commodity, security, derivative or cryptocurrency related instrument as it's extremely HIGH RISK! You should always consult with a professional/licensed financial adviser before trading or investing in any type of assets.
