Palantir (PLTR) Approaching Critical Levels!📊 Technical Analysis (TA):
1. Trend & Structure:
* PLTR is in a strong downtrend, confirmed by multiple Break of Structure (BOS) signals.
* Change of Character (ChoCH) attempts have failed, reinforcing bearish control.
* Key Resistance: ~90-95 (supply zone)
* Support Zone: ~78-80 (high liquidity demand zone)
2. Indicators:
* MACD & Stochastics indicate weakness, signaling further downside potential.
* Volume remains high on selling pressure, further validating the downtrend.
🔹 GEX & Options Flow:
1. Call Walls (Resistance) 🚧
* 100-105: Heavy resistance, unlikely to be breached in the near term.
* 120: Major CALL wall, a strong gamma resistance.
2. Put Walls (Support) 🛑
* 75: Significant put positioning, acting as short-term support.
* 70: Highest negative NETGEX, meaning a strong breakdown could accelerate to this level.
3. IV Rank & Skew:
* IVR 82.7, signaling high implied volatility.
* IV skew heavily favors puts, suggesting continued bearish sentiment.
* Calls only 21.5%, confirming put dominance.
📌 Trading Plan & Suggestions:
* Bullish Scenario:
* A reclaim above 85-90 could push PLTR toward 95-100.
* Calls or spreads with April expiry could benefit from a bounce.
* Bearish Scenario:
* A breakdown below 78-80 could send PLTR toward 70-75, leading to strong put activity.
* Ideal Put Play: Buy March-April 80P or 75P targeting 70-75.
⚠️ Key Warning: If PLTR holds 80, we might see a sharp bounce due to short covering.
🔥 Conclusion: PLTR at a Crossroad – Major Move Incoming!
PLTR is hovering near key liquidity zones, with options flow favoring downside. The next few sessions will be crucial in determining direction. If it fails to hold 78-80, expect further selling pressure. Watch for reaction levels before entering trades. 🚀📉
🚨 Disclaimer:
This analysis is for educational purposes only and does not constitute financial advice. Always do your own research and trade responsibly.
PLTR trade ideas

Opening (IRA): PLTR February 21st 62/68/94/100 Iron Condor... for a 2.16 credit.
Comments: High IVR/IV earnings announcement volatility contraction play.
Metrics:
Max Profit: 2.16
Buying Power Effect: 3.84
ROC at Max: 56.3%
50% Max: 1.08
ROC at 50% Max: 28.2%

Palantir: Bullish Outlook Despite Recent DeclinePalantir has dropped ~31% in 9 days due to market volatility and defense spending concerns. However, strong fundamentals suggest a bullish rebound.
❓Why Palantir Can Rebound
✅ AI Leadership – Palantir’s platforms (Gotham, Foundry, Apollo) dominate AI-driven data analytics. The AI Platform (AIP) enhances adoption.
✅ Strong Financials – Revenue surged from $742.6M (2019) to $2.86B (2023), with Q4 2024 net income at $165M.
✅ Growing Commercial Sector – U.S. commercial revenue up 43% YoY, reducing reliance on government contracts.
💡Recent Developments:
AI & National Security – CEO Karp’s insights on AI’s role in global security.
Industry Recognition – Palantir experience is highly valued in tech.
Defense Contracts – Competing for Pentagon AI-driven contracts.
With innovation, strong financials, and expanding market reach, Palantir is well-positioned to reclaim its highs and beyond. 🚀

PLTR at a Key Turning Point – Reversal or Breakdown? Technical Analysis (TA) – Key Price Action Insights
* Trend: PLTR has been in a clear downtrend, trading within a descending channel. A breakout above this structure could signal a reversal.
* Reversal Zone: The stock is testing a critical resistance zone around $85-$90, which aligns with the Volume Profile Point of Control (POC).
* Support Levels:
* $80: Key short-term support; failure to hold could send price towards $75-$72.
* $72: Strong historical support—a breakdown here could accelerate selling pressure.
* Resistance Levels:
* $90: First major upside level where a rejection is likely.
* $100-$105: Strong supply zone and potential breakout confirmation area.
Indicators:
* MACD: Recently crossed bullish, indicating possible momentum shift.
* Stochastic RSI: Overbought, suggesting a possible pullback before continuation.
GEX (Gamma Exposure) & Options Analysis
* Call Resistance:
* $90 (72.6% Wall): Heavy call positioning here could act as a major resistance.
* $100-$105: Next key call walls—if PLTR can clear these, a strong gamma squeeze could take it towards $120.
* Put Support:
* $80: Highest negative NetGEX level, which aligns with dealer positioning to support price.
* $75-$72: Strong put walls—if these break, expect dealers to hedge by selling stock, increasing downside pressure.
* IV & Sentiment:
* IV Rank (IVR): 71.4 – High implied volatility means options are expensive.
* Options Positioning: Calls 26.4% → Mixed sentiment, slightly bullish bias.
Trading Plan & Strategy
🔹 Bullish Scenario: If PLTR holds above $85 and breaks $90, it could trigger a gamma squeeze toward $100-$105. A daily close above $105 could lead to $120+ in the mid-term.
🔻 Bearish Scenario: Failure to hold $80 could trigger dealer hedging, leading to a breakdown toward $75-$72.
Final Thoughts & Suggestions
* Options Traders: Consider selling puts at $80 or a bull call spread if bullish. For bearish setups, a bear put spread targeting $75 makes sense.
* Equity Traders: Look for confirmation at $90 for a bullish entry or wait for a retest at $80-$75 for better risk-reward.
⚠️ This analysis is for educational purposes only and does not constitute financial advice. Always do your own research and manage risk accordingly. 🚀📉
PLTRPLTR hit the 1.0 I have been waiting for and looks primed for a move higher. The main question I am asking myself, is this just wave A, or is it all of wave (4). We've hit the target area for wave (4), but it was very short. Wave (2) was long, so I expect (4) to be short, but damn, talk about SHORT lol. This consolidation has lasted all of 9 days (7 trading days). This next move higher will tell us the answers we seek based upon the structure that it takes on. If it appears corrective in nature, then it is likely wave B carving itself out. Should it be impulsive in nature, then we know that (4) was short, and we're within wave (5) already. Either way I see this though, we should be moving up very soon if not already starting to.

What’s Driving PLTR’s Recent Rally, and What’s Next?What’s Driving PLTR’s Recent Rally, and What’s Next?
Palantir Technologies (PLTR) has delivered a remarkable performance, surprising many investors and traders with its rapid ascent.
The stock surged from approximately $64 on December 20, 2024, to a peak of around $118 on February 11, 2025—an impressive 89% gain in less than two months.
This substantial rally raises an important question: Is PLTR at a critical turning point?
A key technical consideration is whether the stock will retrace to fill the $15 gap visible on the chart. Historically, gaps often get filled, but strong momentum can sometimes defy this pattern.
Traders and investors should closely monitor price action, volume trends, and any fundamental catalysts that could either sustain the uptrend or trigger a pullback.
As always, exercise caution and apply sound risk management strategies when trading.
📊 My chart analysis tells the story—trade wisely.

Bullish Opportunity: Palantir Technologies (PLTR) Current Price: $83.00
TP1: $90 (Analyst target)
TP2: $100 (Psychological resistance)
TP3: $120 (Upper channel target)
🚀 Why Palantir is a Bullish Opportunity
1️⃣ Strong Q4 Earnings Outlook 📊
Earnings Report Due: February 3, 2025 – Analysts expect another strong quarter.
405% Growth Over the Past Year – Palantir was the best-performing S&P 500 stock in 2024.
Wedbush Analyst Dan Ives Calls Palantir’s Q3 a "Masterpiece" – Revenue surged 30% YoY to $726M, driven by AI demand.
2️⃣ AI Leadership & Competitive Edge 🤖
AIP Named Best AI Platform by Forrester Research – Ranked ahead of Google Cloud, AWS, and Microsoft Azure.
AIP Growth Driving Revenue – U.S. commercial revenue is expanding rapidly, with unprecedented demand for AIP solutions.
Dan Ives Sees Palantir as the Next Oracle – If true, this would mean 185% upside from current valuation.
3️⃣ Institutional Confidence & Price Upgrades 💡
Wedbush Raised Price Target to $90 – Signaling continued AI-driven momentum.
Strong Hedge Fund Interest – Institutional investors remain bullish on Palantir’s AI expansion.
Market Cap Nears $185B – With 81.1% gross margins, Palantir is positioned as a high-growth AI leader.
4️⃣ Government & Commercial Expansion 📈
$400M+ Partnership with U.S. Army – Reinforcing Palantir’s role in defense & AI applications.
Strong Commercial Growth – Demand for AIP is driving both new customer conversions and existing client expansions.
The Biden Administration’s AI Push – Government spending on AI infrastructure directly benefits Palantir.
🔎 Conclusion
Palantir is positioned as a leading AI company, with institutional backing, strong earnings momentum, and government contracts fueling growth. With analyst upgrades and AI adoption surging, PLTR could see a breakout toward $100+ in the coming months.

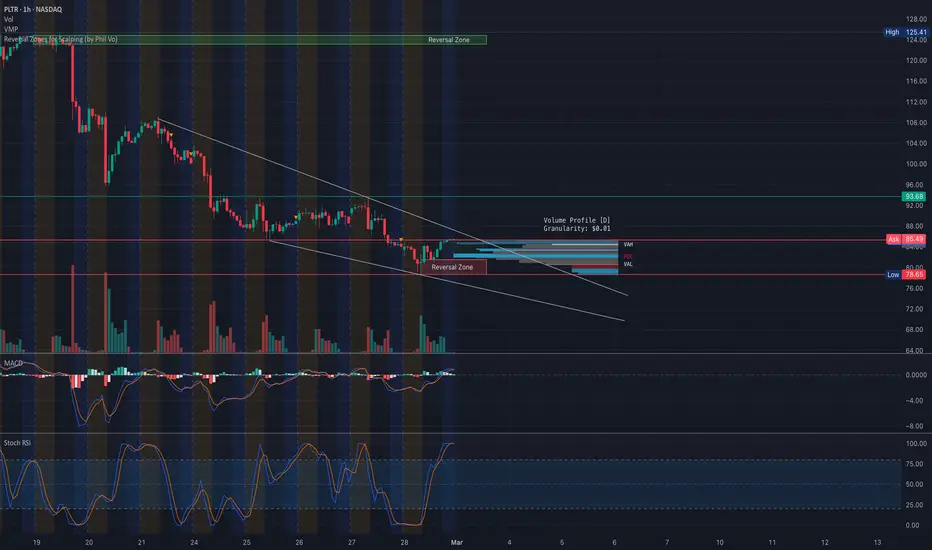
PLTR Hits Rock Bottom! Will $84 Hold or Break Lower? Feb. 28Technical Analysis (TA) & Price Action
Palantir (PLTR) is trading within a falling wedge pattern, indicating that the downtrend may soon be nearing exhaustion. The stock has reached a critical support zone at $84-$85, aligning with the highest negative NETGEX and significant PUT support.
Key observations:
* Trend Structure: PLTR remains in a downtrend, but a reversal is possible if this key support holds.
* Support & Resistance:
* Major Resistance: $90-$93 (previous breakdown level).
* Key Support: $84 (highest negative NETGEX, strong support zone).
* Breakout Target: $100-$105 if momentum shifts.
* MACD Indicator: Showing continued bearish momentum, but near a potential bullish crossover.
* Stoch RSI: Deeply oversold, suggesting a bounce could be imminent.
Options Flow & GEX Analysis
The GEX (Gamma Exposure) indicator highlights significant PUT dominance, with extreme negative gamma near $84. A break below could trigger a major sell-off toward $80, while a hold at this level could lead to a sharp reversal rally.
* IVR (Implied Volatility Rank): 74.2, with IVx avg at 82.4%, indicating high volatility.
* Call Side Bias: 27.6% of options flow, meaning bullish bets are increasing.
* Key GEX Levels:
* PUT Wall & Key Support: $84 → A breakdown could bring $80 as the next stop.
* CALL Resistance & Upside Target: $90 → A move above this level could send PLTR to $100+.
Trade Plan & Suggestions
📌 Bullish Reversal Setup (Preferred Play)
* Entry: Above $86 with strong volume confirmation.
* Target 1: $90
* Target 2: $100-$105 (Extended breakout target).
* Stop-loss: Below $82
📌 Bearish Breakdown Setup (Hedge Play)
* Entry: Below $83 with strong selling pressure.
* Target: $80 → $78
* Stop-loss: Above $85
Final Thoughts
PLTR is at a high-risk, high-reward level, with $84 acting as the major support zone. If buyers step in, a short squeeze rally toward $90-$100 is likely. However, if selling pressure continues, a break below $84 could accelerate losses toward $80. Watch volume and market conditions closely before making a trade.
📢 Risk Management: Keep tight stop-losses, wait for volume confirmation, and manage position sizing carefully.
🔹 Disclaimer: This analysis is for educational purposes only and does not constitute financial advice. Always conduct your own research and manage risk accordingly before trading.

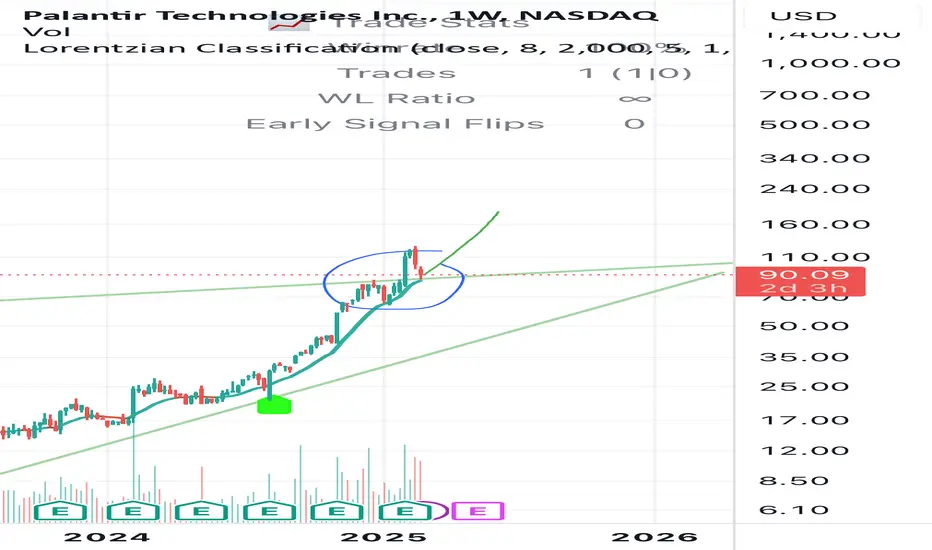
PLTR forecastAbove the monthly trendline ✅
Closed the gap, which was also a resistance level for several months and turned into support ✅
Above the 150 moving average ✅
Broke the downward trendline on the 4-hour timeframe, which aligns with the support level ✅

It will simply bounce off and go further up. Pltr super bullish.Lorenztian classification line. Bounces off at 60-80. Goes up again. Simply clear pattern.
Pltr super bullish.
Magic word - AI . Dont go against AI , especialy gov AI.
pltr top is in.crypto / stocks dump 2025.. back to bullish in 2026.
buy zone 30-45 for NASDAQ:PLTR
look at the stock market cheat sheet.. for the cheat code..

PLTR, BOUNCE OFF GOLDEN FIBONACCI?Palantir Technologies (PLTR) is showing strong potential for growth as it has recently retraced to a key technical support level, often seen as a point where prices reverse and gain upward momentum. The company continues to secure new contracts in both the public and private sectors, which supports its long-term growth outlook. With increasing demand for data analytics and AI-driven solutions, Palantir is positioned to benefit from these trends. Additionally, the stock’s recent retracement into a historically significant price zone could signal a potential price bounce, setting the stage for future upward movement. Investors may find this a prime entry point for long-term growth.

$PLTR 4h RSI, Vol. Bearish Divergence4H chart showing divergence and may not necessarily be a top but could be pulling back for a test of support. Watch 10DMA for potential support.

PLTR at a Key Decision Point! Bounce or More Downside? Feb. 26 Technical Analysis (TA) & Price Action
Palantir (PLTR) has been in a downtrend, forming a falling wedge on the 1-hour timeframe, which could signal a potential reversal if it breaks out. The stock is currently testing a major support level around $85-$89, which aligns with strong options positioning.
Key observations:
* Trend Structure: PLTR remains in a falling wedge, often a precursor to bullish reversals.
* Support & Resistance:
* Major Resistance: $95.73 (previous breakdown level).
* Key Support: $85 (strong PUT support zone).
* Breakout Target: $100 - $108 if momentum returns.
* MACD Indicator: Flatlining, indicating a consolidation phase before a potential move.
* Stoch RSI: Near overbought, suggesting limited upside unless volume confirms a breakout.
Options Flow & GEX Analysis
The GEX (Gamma Exposure) indicator highlights significant PUT concentration around $85, meaning a break below could trigger additional downside momentum. However, if it holds, a relief bounce toward $95-$100 is possible.
* IVR (Implied Volatility Rank): 79, with IVx avg at 84.2%, showing increased volatility.
* Call Side Bias: 36% of options flow, suggesting some bullish positioning.
* Key GEX Levels:
* PUT Wall & Key Support: $85 → Breaking below could drive price toward $80.
* CALL Resistance & Upside Target: $91-$100 → A breakout here could push toward $108.
Trade Plan & Suggestions
📌 Bullish Reversal Setup (Preferred Play)
* Entry: Above $91 with confirmation of strength.
* Target 1: $95
* Target 2: $100-$108 (Extended breakout target).
* Stop-loss: Below $85
📌 Bearish Breakdown Setup (Hedge Play)
* Entry: Below $85 with strong selling pressure.
* Target: $80 → $75
* Stop-loss: Above $89
Final Thoughts
PLTR is at a make-or-break level, with $85 being the critical zone to hold. If it breaks below, we could see a continuation toward $80. However, if buyers step in, a rally toward $95-$100 is likely. Options data suggests a battle between bulls and bears, making confirmation essential before entering a position.
📢 Risk Management: Given the volatility, traders should size their positions appropriately and wait for volume confirmation.
🔹 Disclaimer: This analysis is for educational purposes only and does not constitute financial advice. Always conduct your own research and manage risk accordingly before trading.

Palantir Technologies (PLTR) Scalping & Mid-Term Analysis🔥 Market Overview
Trend: Strong Bearish 📉
Resistance: $88.54 → EMA 9, first major ceiling
Support: $85.50 → Short-term demand zone
Indicators:
MACD: Bearish but momentum is slowing
RSI: 29.61 (Oversold) – potential bounce
VWAP: Below average, sellers maintain control
🩸 Risk: No major news catalyst, but technical weakness dominates
🔥 Scalping Strategy (5x Leverage)
🩸 Momentum Scalping:
Buy: Near $85.50–$86.00, targeting $88.00 (+2.3%)
Sell: Near $88.00–$89.00, targeting $86.00 (-2.1%)
Stop-loss: Below $84.90
🩸 Breakout Scalping:
Above $89.00: Long to $92.00 (+3.4%)
Below $85.50: Short to $83.00 (-2.9%)
🔥 Mid-Term Trend Forecast (1-3 Weeks)
Bullish above $90: Possible retest of $95 if recovery starts
Bearish below $85: Likely drop to $80 if breakdown continues
🔥 News & Market Context
🩸 No strong catalysts = Technicals drive the market
🩸 PLTR in oversold conditions but no major bounce signal yet
🔥 Decision:
🩸 Short-term: Scalp long near $85.50, sell at $88.00+
🩸 Mid-term: Wait for trend confirmation before heavy longs
🩸 Ideal Play: Short bounces, enter aggressive longs above $90
👑 Final Verdict:
"Patience isn’t weakness—it’s waiting for the perfect strike." – LucanInvestor

PLTR Technical Analysis & GEX Options Setup for February 26📌 Key Observations from the Charts
1. Market Structure & Price Action:
* PLTR is in a descending channel, with a strong rejection from the 109 level and now testing the 100-95 support zone.
* Support Levels:
* 100.16 (current price zone, potential reaction area).
* 95.77 (next major support & put wall level).
* 90.00 (extension downside target if selling accelerates).
* Resistance Levels:
* 106.27 (POC, first resistance).
* 109.01 (VAH & major resistance).
* If PLTR loses 95, expect a sharper decline to 90 or lower.
2. Volume Profile & Auction Levels:
* Point of Control (POC): 106.27 → Major liquidity area, key to reclaim for upside.
* Value Area High (VAH): 109.01 → Strong resistance zone.
* Value Area Low (VAL): 100.16 → Key level to hold for buyers.
3. Indicators Review:
* MACD: Bearish, momentum still pushing lower.
* Stochastic RSI: Oversold but no clear reversal yet.
🛠️ Options GEX Analysis
* Call Resistance:
* 120-130 → High gamma resistance, strong call walls.
* Put Walls & Support Zones:
* 95 → Highest Put Wall & Negative NETGEX Support.
* 90 → Major Put Wall—if lost, could lead to further downside.
* Implied Volatility (IVR & IVx):
* IVR 70.3 | IVx Avg 85.9 → High volatility, expect larger price swings.
* Call Positioning 42.6% → Some bullish positioning, but put walls are strong.
📈 Trade Setups & Game Plan
🔴 Bearish Scenario (Preferred Setup)
🔹 Entry: Short below 100 confirmation.
🔹 Target 1: 95.77 (Put Wall Support).
🔹 Target 2: 90.00 (Put Wall Breakdown Level).
🔹 Stop-Loss: Above 104 (invalidates breakdown).
🔹 Options Strategy:
* Buy PUTS 100/95 expiring 1-2 weeks out if breakdown confirms.
* Debit Put Spread (Bearish 100P/90P for risk control).
🟢 Bullish Scenario (Less Likely)
🔹 Entry: If price reclaims 104-106, targeting 109+.
🔹 Target 1: 106.27 (POC, first resistance).
🔹 Target 2: 109.01 (major resistance).
🔹 Stop-Loss: Below 100 invalidates upside move.
🔹 Options Strategy:
* Sell 95/90 Put Credit Spread for a bounce play.
🎯 My Thoughts & Suggestions
* Main Bias: Bearish, unless 104+ is reclaimed.
* Gamma Risks: Below 95, strong gamma exposure can push PLTR lower quickly.
* Options Play: Puts look stronger based on GEX positioning & technical weakness.
⚠️ Disclaimer
This analysis is for educational purposes only and does not constitute financial advice. All trading involves risk, and past performance is not indicative of future results. Please do your own research and consult a professional financial advisor before making any investment decisions.

PLTR All time highsWith PLTR at all time highs where do we go from here? Avg 30D Vol 78.47M and current Vol 128.22M. Until we break the current trend line, i see more upside. I have a measured next move at $134. Let's see if we can get there. GL!

PLTR Weak SupportSee if it can be supported by trending line.
sold 2/3 of my shares at 110ish.
Now hold 1/3 tight.

PLTR - Next Generational Company Palantir Technologies Inc. (NYSE: PLTR) is an American software company specializing in big data analytics. Palantir offers platforms like Palantir Gotham, used by defense and intelligence agencies; Palantir Foundry, designed for data integration and analysis across industries; and Palantir Apollo, which facilitates continuous software deployment. In April 2023, Palantir introduced the Artificial Intelligence Platform (AIP) to integrate large language models into secure networks. Recent earnings have surprised to the upside, reassuring investors that the company is able to monetize its services in an industry where many AI related and data analytic companies to not provide similar competitiveness.
At the moment, Palantir has seen a massive drop from the all time high, creating a potential ABC corrective structure with the 1-1 extension being around the $80 range.
I will be interesting in adding shares if Palantir can flush down to these levels in the coming days!

PLTR: Buy ideaOn PLTR we would have a high probability of buying after a rebound on the support line and also with the breakout of the vwap indicator.

PLTR is looking for the change of consolidation angleHi
PLTR is following this curved consolidation for long, and always followed the Higher lows till now
got the resistance from another tl above also from a monthly level, u will see the origin of the above tl or pattern in below graphics, could follow the curve for 1/2 months more, depends on the market support
posted herewith important nearby 12M levels along with the monthly levels, will update the monthly and weekly levels for coming weeks and month as and when required.
shortly will add few more graphics
thanks

PLTR at a Critical Level! Key Trade Setups for This WeekTechnical Analysis & Market Structure
PLTR has experienced a strong move downward, breaking below key levels before finding support near $95.80. The hourly chart indicates a descending structure with lower highs and lower lows, suggesting continued bearish pressure. However, the 15-minute chart highlights a potential stabilization near key liquidity zones.
Support Levels:
$95.80 (GEX 1st PUT Support - critical defense)
$90.00 (2nd PUT Wall, strong bearish threshold)
$80.00 (Extreme bearish scenario)
Resistance Levels:
$100.00 (Psychological & GEX HVL Sigma zone)
$105.00 (2nd Call Wall - first major bullish test)
$120.00-$130.00 (Major NET GEX Call zone, potential gamma squeeze target)
Options Sentiment & GEX Analysis
The GEX model shows significant positioning around $100, which acts as a magnet for price action. A break and hold above $100 could lead to a gamma squeeze toward $105 and potentially $120.
IVR: 68.4 – Implies medium volatility, still elevated
IVx avg: 88.6% – IV skew favors short-dated options
Call GEX: 22.4% – Calls are building strength but still below major inflection zones
Trade Setups
🔹 Bullish Play:
Entry: Above $100, retest confirmation
Target: $105 / $120
Stop-Loss: Below $98.50
🔻 Bearish Play:
Entry: Below $95.80 breakdown
Target: $90 / $80
Stop-Loss: Above $98
Final Thoughts
PLTR is at a high-stakes decision point with GEX levels aligning near $100 as a pivot. A move above this zone could bring a gamma acceleration toward $105-$120, while rejection signals further downside to $90 and below. Patience is key—wait for retests before entering trades.
🔔 This analysis is for educational purposes only and does not constitute financial advice. Always do your own research and trade responsibly.

PLTR: 150+?Heavy volume picked up to maintain price levels at the 95-105 range. Institutions are just now buying in, they gonna keep the gravy train rolling (opinion).
Technical levels take us to $155 so from here and any pull backs to the mid 90s are buys. Get ready for some serious volatility. Price movements will be large and fast.
Long term buyers beware.
