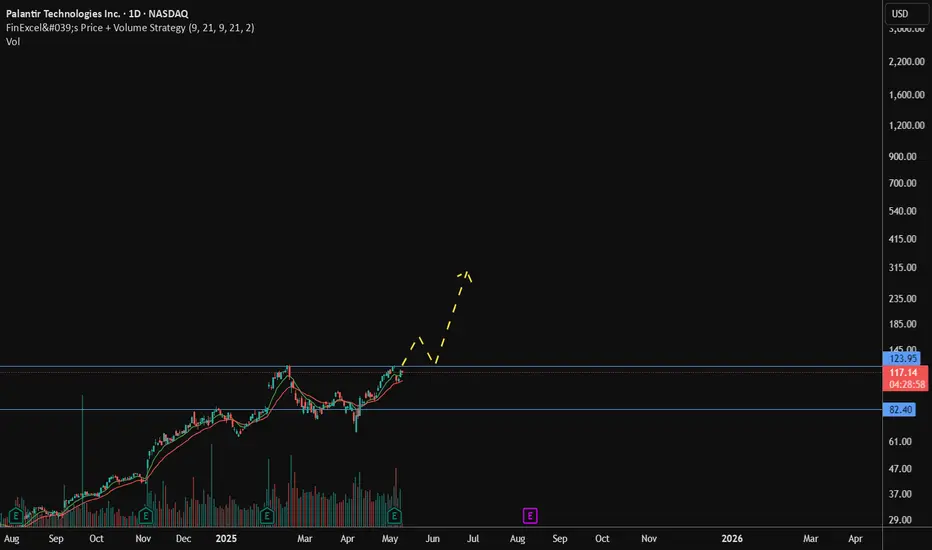
PLTR to $131 Incoming? After-Hours Says Yes.Palantir ( NASDAQ:PLTR ) just closed at $122 after hours, and the technicals are lining up for a potential $131 breakout in the short-term (1–2 weeks). Here’s why:
Technical Backing:
RSI (14): Currently at 68 — entering momentum territory, but not yet overbought.
MACD Histogram: Flipped green with strong separation — bullish continuation expected.
Volume Profile: Highest accumulation zone between $118–$120. Price now firmly above it = breakout ignition.
Fibonacci Extension (1.618): Targets $131–$133 range from previous $110–$122 leg.
Breakaway Gap on earnings — not filled = strength confirmation.
Fundamental Backing:
AI sector strength + strong earnings momentum.
Massive crowd interest + institutional inflows confirmed by volume.
Target: $131
Support: $119
Confirmation: $124 daily close = go time.
As Always Safe Trades and JoeWtrades
PLTR trade ideas

PLTR: Buy ideaBuy idea on PLTR as you can see on the chart after the breakout with force the resistance line by buyers.

Don't hate me... 240 for 2025I know it doesn't make sense, and perhaps there'll be a sizeable correction afterwards. But we have momentum. And the AI bandwagon could not be larger (maybe it can...).
All I'll I can say is. Don't short this stock. Lest ye be remitted to your coke lines in your motel 6 rooms. Mind the drones spraying light fentanyl-laced urine.
All the best.

PLTR: Trade Short 1hr TF.After a strong rally into the premium supply zone (~$125), NASDAQ:PLTR has begun a structural breakdown, failing to hold above $112. Recent rejection from the 0.886 fib level and the cluster of bearish volume signals a possible shift from accumulation to distribution.
🔻 Smart Money Concepts (SMC) Breakdown
BOS and CHoCH confirmed near highs
Price failed to maintain above $112.59 (0.786 fib), now testing $106.33 as support
Liquidity void between $100–$88 with minimal volume support
🧠 WaverVanir DSS (LSTM Forecast Model)
15-Day Prediction: $38.25
30-Day Prediction: $36.01
Projected 65.4% downside from current levels
Model trained with sentiment score = 80 and updated price action
🎯 Bearish Trade Idea
Entry: $110–$112 (retest zone)
TP1: $100
TP2: $88.70 (volume node)
TP3: $38.25 (DSS LSTM target)
Stop Loss: Above $125.50
📉 Volume profile confirms strong resistance overhead, with a price inefficiency below. If $100 breaks, capitulation is likely.

Chapter 6: “The Bear Commander Guarding $131”The NASDAQ:PLTR battlefield was littered with the remnants of shattered dreams. The bulls, once triumphant in their silent ascent, now found themselves regrouping amidst the debris of their failed mission. The climb to $129 had been halted, not by mere resistance, but by a formidable adversary—the Bear Commander.
Stationed at the gates of $131, the Bear Commander was no ordinary sentinel. He was a master tactician, orchestrating defenses with precision and foresight. His stronghold was fortified by layers of sell orders, each one a testament to his unyielding resolve. The bulls' previous assault had been swift and silent, but this time, the Bear Commander was prepared.
As the bulls attempted to regroup, the Bear Commander launched a counteroffensive. A sudden surge of red candles cascaded down the chart, each one a calculated strike aimed at undermining the bulls' morale. The price plummeted from the heights of $124 to the depths of $117, a stark reminder of the Bear Commander's dominance.
Yet, amidst the chaos, the bulls found a glimmer of hope. Technical indicators suggested that the stock was still in a bullish trend, with the 50-day simple moving average at $94.68 and the 200-day simple moving average at $67.08, both below the current price. The Relative Strength Index (RSI) hovered around 61.02, indicating that the stock was not yet overbought.
The bulls knew that to overcome the Bear Commander, they would need to adapt their strategy. They began to accumulate positions at lower levels, building strength for another assault. The path to $131 was fraught with peril, but the bulls were undeterred. They understood that victory would require patience, resilience, and a willingness to learn from past mistakes.
As the market prepared for the next battle, the Bear Commander stood vigilant, his eyes fixed on the horizon. He knew that the bulls would return, and he was ready. The war for $129 was far from over, and both sides were poised for the confrontation that would determine the stock's fate.
In the distance, the first signs of movement appeared on the chart. The bulls were on the march once more, their resolve hardened by previous defeats. The Bear Commander tightened his grip on the defenses, aware that the next encounter would be decisive. The stage was set, and the battle for $131 was about to commence.

PLTRPLTR -- possible trade opportunity
Based on:
1-General market conditions.
2-Sector analysis.
3-Company earning and sales.
4-Chart patterns.

Quick View: $PLTREMA21 crossed above EMA50 and pulled back.
Box right now on the go.
Watching for a #TopSwing Setup
Area of $121 as key resistance.
Support → $114 and $104

$PLTR - retest of $125.50 incomingPLTR- stock bouncing off 9 and 21 ema in the daily rejecting that new high. On watch for possible retest of $125.50 above $120. calls good to add above that level. Stock is decent on the indicator level.

Chapter 5: The Trap Above the CloudsThe climb had been silent. Not rushed. Not loud. The bulls moved with care, like seasoned ghosts, scaling the edge of the white-dashed ridge that curved upward toward myth. They had made it through fire and fog, breaching the strongholds of $113, $117, even slipping past $121 with barely a sound. At last, they arrived just beneath the gates of $124, their breath steady, their formation disciplined. From below, it looked like glory. From above, it was something else entirely: too still, too clean. A silence that felt staged.
And yet, the bulls believed. Not in volume or news. Not even in momentum. They believed in the structure they had built—the clean channel, the steady trendline, the candles that obeyed. Each wick reaching upward toward $129 had been a promise. A whisper. A prophecy. And so, standing on the ledge, they reached.
But the air thinned. The candles hesitated. A shadow moved behind the wick.
Then came the fall.
Not a pullback. Not a test. A full betrayal.
A single red line split the sky open. It came not from resistance, but from underneath—like a trap door ripped from its hinges. PLTR plunged. $122 vanished in a blink. $121 buckled. $119 fell like a tower of ash. $117 cracked. The chart did not bend—it collapsed. One long red candle, screaming downward, dragging hope behind it like smoke.
The bears hadn’t returned with swords. They had waited with silence. What the bulls thought was a staircase was a cage. What they thought was momentum was merely absence—no buyers above, no strength left below. The trap hadn’t been set at the bottom. It had been waiting at the top, hidden beneath the illusion of a final breakout.
Now, the battlefield is scorched. The white ascending path lies shattered beneath the feet of trembling price action. Volume spikes below like gunpowder after the blast. The chart, once proud and sure, now flickers in disbelief. Where once stood a line of ascent, there is now only a scar—bright, wide, and red.
NASDAQ:PLTR stands at $117.66, not broken, but breathless. Not finished, but silenced. The mission is not over—but the plan must change. The bulls will regroup, but they will not forget. Not this time. Because they did not fall from resistance. They fell from overconfidence.
And somewhere above them, untouched, unreachable for now… $129 waits.
Still watching.
Still waiting.
Still undefeated.

Chapter 5: “Operation: Break the Ceiling" (Buy) (Long)The sky was quiet.
Too quiet.
A calm so perfect it made the watchers uneasy.
Price hovered in the highlands of $121, just beneath the outpost towers of $124 —
not pressing, not charging…
simply present.
But beneath that calm…
a mission was unfolding.
A silent infiltration.
The bears had fallen into rhythm.
Their sentries lined the upper fortresses,
comforted by routine.
Sell walls rested like rusted armor at $123… $124… $126.
Nothing unusual.
Nothing alarming.
They had seen bulls climb before — loudly, predictably, emotionally.
But this time…
there was no climbing.
This time,
the bulls were already inside.
They had entered beneath the surface —
not with volume,
but with silence.
Their movements did not trigger alerts.
Their footprints were traced in subtle accumulation,
their weapons hidden inside passive bids and split spreads.
One by one, they infiltrated the upper levels of the chart,
moving through forgotten gaps,
nesting in the creases of illiquidity,
planting their charges .
They weren’t here to trade.
They were here to detonate .
The structure had been compromised.
What looked like sideways movement
was merely preparation.
A disguise.
A mask worn by momentum itself.
They moved with purpose —
not to break resistance,
but to shatter expectation .
The white ascending line arched above them like a tensioned wire.
Beneath it, the bulls crawled like operatives through the ductwork of the market.
And at the center of their plan
sat the payload —
a momentum surge wired to explode
beneath $124… and aimed directly at $129 .
The bears sensed it.
But they didn’t know what “it” was.
They reinforced their walls.
They adjusted their orders.
But they were guarding against noise…
not ghosts .
And then,
without sound, without volume, without warning...
one candle blinked .
It wasn’t large.
It wasn’t dramatic.
But it was perfect.
It sliced upward, clean as a blade.
And in that moment,
everything changed.
The white path lit up.
The tape rippled.
The chart cracked.
Price surged.
Not wildly —
surgically.
$122.60…
$123.80…
$124.90…
Each level breached with clinical precision,
as if it had been drawn,
practiced,
rehearsed.
And through it all,
no bull said a word.
From below, traders watched in disbelief.
“It’s flying—
But there’s no panic.
No chasing.
No… noise.”
Because it wasn’t hype.
It wasn’t FOMO.
It was execution.
And now, as the dust settles,
the operation continues.
The white line has curved again.
The last red band nears.
And just ahead,
above the final towers,
veiled in pre-detonation quiet —
stands $129.
The thirteenth gate.
The last stronghold.
And the final objective in this phase of the mission.
They’re not done.
They’re not loud.
They’re just getting closer.
Mission status: underway.
Next objective: breach confirmed at $129

Put sale on PLTRNice drop on earnings. Appears to be a double Bottom on a daily chart. Strong up trend.
This is a nice buy low, sell high opportunity.

PLTR – Flat Top Breakout + Earnings Gap ReversalNASDAQ:PLTR – Flat Top Breakout with Earnings Gap Reversal
Palantir ( NASDAQ:PLTR ) is setting up for a potential explosive move, combining two of my favorite setups:
🔹 Flat Top Breakout (ATH Setup)
Price is pressing against the $126 resistance, a clear flat top breakout level.
A clean move above this triggers a breakout to new all-time highs (ATH).
🔹 Earnings Gap Down Reversal (Bullish Signal)
Recently, PLTR gapped down on earnings — but bulls stepped in fast, pushing it back up.
This is a classic gap down reversal setup, a strong signal of bullish momentum.
We saw the same setup play out on NYSE:SPOT , which reversed after earnings and broke out to ATH.
🔹 My Trading Plan:
1️⃣ Anticipatory Entry: Looking to buy dips into the shaded cloud zone (dynamic support).
2️⃣ Breakout Confirmation: Add size on a clean breakout above $126.
3️⃣ Stop Loss: Tight stop below the cloud zone to protect capital.
🔹 Why I Love This Setup:
Gap reversals signal aggressive buying even after bad news — a sign of a strong market.
Flat top breakouts tend to have explosive follow-through, especially with earnings momentum.

Seems the bulls are trying to put a floor on price here.The chart speaks for itself. No need for me to put my narrative onto it.

PLTR - hedgeValuation does not make sense (for a long time). I think we will see another round of volatility and decided finally to short it as a hedge against my long positions: GOOG, AMZN NVDA, TTD, NBIS,FSLR).
Negative RSI divergence

Somebody is cleaning house.The key to whether this happens will be in the rapid pace at which shorts take hold here. Talk about narrative, I can't imagine what stories we will be told while they continue the SWEEP all the way down to $61.00. You might not fall for the narrative they try to sell you on, but $61.00 will be a hard pill to swallow if you're just picking up shares now, to say the least.
Now they may SWEEP the high liquidity again before they hit the lows, but I would almost guarantee you that is the next target.

PLTR 114.51Watch retest for long position at 114.51.
Position is looking clean for a nice break and retest setup. Keep in mind the larger market at whole to ensure price action confirms the move.

Chapter 4: “The Winds Shift”The morning sun had barely risen when PLTR stood once again atop its hard-won ground at $119.85.
Behind it lay the shattered green line, now a path paved by victory; ahead, the final gates of $122 gleamed, radiant yet distant.
But as the warrior gazed toward those heights, a subtle chill crept through the air.
The wind — once warm and pushing at its back — began to shift.
Something unseen stirred.
At first, it was a faint resistance, like climbing a hill with each step heavier than the last.
Buyers pressed forward, but their strength no longer carried the same force.
The candles wavered, flickering between green and red, as if uncertain which direction fate would choose.
And then…
the clouds gathered.
A sudden, sharp gust swept across the battlefield.
Without warning, a red streak fell from the sky — a swift, merciless strike.
$119… $118… $117.50…
One by one, the levels gave way beneath the weight of the selloff.
The crowd below gasped, their cheers silenced into stunned whispers.
“A pullback,” said the seasoned watchers.
“No — a test.”
The warrior planted its sword at $117.43, steadying itself against the trembling earth.
This was no defeat.
This was the trial between surges, the quiet before the next roar.
Above, the dashed white line — the ascending path toward $122 — remained unbroken, like a promise waiting to be claimed.
Below, the green line shimmered faintly, its support lingering, a reminder of how far they had come.
In this moment, the battle paused.
The bulls gathered their breath, their resolve.
The bears watched from the shadows, unsure if their strike had been enough.
And the market… waited.
A stillness before the next move.
“We’ve pulled back,” whispered the warrior, “but we have not fallen.”
“The path remains.
The sky above is still ours to claim.”
And as the candles narrowed, coiling in quiet preparation, all eyes turned once again to the horizon.
For though the winds had shifted…
the climb was far from over.

PLTR's high chance of breaking higher highPalantir has got exceptional result in Q1 '25 with net margin increasing to 24.22% from Q4 '25's mere 9.55%
IMO, in the days full of Tariffs, we must focus on trading or investing companies whose majority customers are from the States.
Y-o-Y Growth is significant.
Technical part, my custom indicator has told to buy like from last year Jan, well for now, if the price action breaks the $123 price, I will wait for it to retrace to $123 and then put orders around there.
PLTR seems to be high growth
Chapter 3: “The Skyveil @$116 Shattered” (Buy until $124)The smoke still clung to the air as the dust settled atop $113. Behind them, the battlefield lay littered with broken resistance. But NASDAQ:PLTR did not stop to rest.
No… the warrior lifted its gaze, and there it was:
The green dotted line.
A spectral threshold, shimmering above the plains at $116–$117, a boundary etched by the hands of past momentum. For many, it was a ceiling. For PLTR, it was a dare.
“Cross me,” the line seemed to whisper.
“If you can.”
And so… they marched.
With each step higher, the volume beneath them rumbled like war drums.
Every tick upward: a shield raised, a sword drawn.
$114… $115… $116…
And then — the clash.
The green line wasn’t just a price level.
It was a fortress in the sky.
As PLTR’s price struck its surface, a shockwave rippled through the chart.
Red candles flared, sellers firing their volleys from the ramparts.
The price staggered backward, briefly retreating toward $115.75… $115.50…
But this wasn’t retreat.
This was the drawing back of an arrow before the release.
Suddenly —
A surge of volume.
A roar of momentum.
A candle forged in fire.
A towering green candle burst forth, piercing the green dotted veil, splitting it like thunder cleaving the night.
Stop-losses ignited.
Shorts fled.
Momentum traders piled in, shouting like an army unleashed.
PLTR didn’t just break the green line.
It obliterated it.
The price flew higher: $117… $118… $119.85.
Every level above was no longer resistance —
it was acceleration.
And now, standing tall at $119.85, up +8.5%, the warrior looked beyond.
Ahead shimmered new battlements:
$120… $121… $122.
The final walls before reclaiming the higher kingdom.
The market watched in awe.
“It was never about breaking resistance,” whispered the charts.
“It was about proving the sky was never the limit.”
PLTR stood, sword raised, armor shining in the glow of its momentum.
The green line broken beneath its feet.
The wind at its back.
And as the candles flickered forward, every tick toward $124 felt inevitable.
The battle wasn’t over....
...The conquest had only just begun.

Chapter 2: “The Siege of $113” (BUY) (LONG)As the sun rose over the battlefield of the premarket, a new fire ignited in the heart of $NASDAQ:PLTR. No longer crawling beneath the walls, no longer whispering hope in the shadows — this morning, it stood tall, armor glinting, sword raised, its banner flying at $112.44.
The crowd of traders watched, holding their breath. For the first time in days, the warrior had not just broken the outer defenses…
…it was now staring down the gatekeepers of $113.
Above it loomed the yellow dashed ramparts — the fortified resistance of the bears, the final barricade before reclaiming the highlands of $114 and beyond.
Behind those walls, the bears sharpened their claws, watching the advancing price with growing unease. Their fortress had once been impenetrable. But today… cracks were showing.
And then — a surge.
The premarket volume roared like a war horn. Green candles marched forward, beating against the yellow line like a battering ram. Each tick upward was a shout:
“We’re not backing down.”
“We’re taking back what’s ours.”
The price hovered at $112.44 — tense, ready, coiled like a spring. Every trader, every algorithm, every fund manager watching knew:
This was the moment. The critical battle.

PLTR: Double Top Short?Palantir hit a premium zone and rejected off a weak high (~$125) with strong bearish flow confirmation ($3.1M vs $905K bullish in <30D options). Smart Money Concepts (SMC) signals — including multiple CHoCH and BOS — suggest distribution is underway.
🔻 Bearish Setup (Primary Bias – 65%)
Entry: $110–$112 (supply retest zone)
TP1: $100 (psych + EMA)
TP2: $87.49 (discount zone)
TP3: $71.51 (equilibrium block)
Invalidation: Above $125.50
📈 Bullish Scenario (35%)
Buyers may step in between $100–$106 (EMA cluster)
Breakout above $115 could squeeze toward $125 again
🔎 Volume profile shows topping behavior. Institutional flow favors the short side. Watching for confirmation below $107.

Chapter 1: PLTR's Comeback (Buy)In the land of Wall Street, PLTR was a warrior that had been knocked down but not defeated. After a rough battle the day before, where bears pushed it deep into the trenches (the big drop from above $115), it found itself walking wounded near the $107 valley.
But then something changed.
A small but determined army of buyers started lifting it from the depths, forming a staircase of higher lows ...step by step... each bounce catching on the red upward slanted support line, like hands reaching up from the crowd.
Though the sky was still clouded by blue dashed downtrend lines (resistance clouds of the past), the price began pushing closer to the walls of the bear fortress around $110.
Today, a breakthrough happened:
For the first time in a while, PLTR climbed back over $110, piercing the orange dashed resistance like a sword cutting through weak armor.
The candles stood taller, the volume whispering the promise of strength...not explosive yet, but steady like a brewing rebellion.
The stock was now above the short-term moving averages (green and red lines curling upward), signaling momentum was turning.
The yellow dashed line up ahead (at $113–$114) stood like the gates of a higher kingdom ...the next mission.
But right here, right now, NASDAQ:PLTR was no longer fighting below the fortress walls. It had scaled them.

$PLTRGeo-Economic Strategy + AI = Future Power 🧠💥
As tensions and disruptions rise between India and Pakistan, this may be India’s moment to invest or partner in predictive military AI systems like those developed by $PLTR.
These systems could help anticipate operations before they unfold, protecting infrastructure & economic flow from unexpected military shocks.
Meanwhile, NASDAQ:PLTR is showing strong demand above the $80 level, supported by rising AI competition and global defense adoption.
AI isn’t just for productivity. It’s becoming a strategic weapon whoever owns the best models, owns the advantage.
