PLTR Hovering at $80 Support: Will This Zone Absorb the Panic?
📉 Market Context:
In the aftermath of the Trump tariff-driven market crash, PLTR is teetering at critical gamma + price support around $80.30. The question now: is this a trap door breakdown or a gamma bounce setup into OPEX week?
📊 Technical Analysis (1H Chart)
Structure & Price Action:
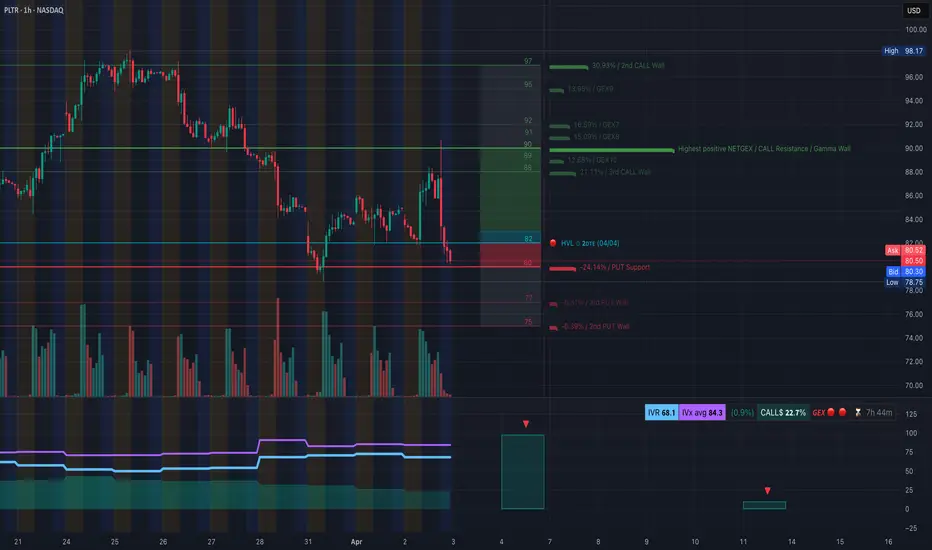
* PLTR’s short-term rally toward $91 was rejected at the GEX resistance zone.
* Sharp breakdown back to $80 confirms this is a contested liquidity zone.
* Current price sits at a red HVL zone, overlapping the PUT Support from options flow.
Key Levels:
* Support:
* 🔻 $80.30–80.00: Major liquidity shelf & highest PUT support
* 🔻 $77 / $75 = deeper gamma cliffs if $80 fails
* Resistance:
* 🔺 $82 = HVL reclaim needed to flip short-term trend
* 🔺 $88–$91 = Gamma Resistance & supply zone
* 🔺 $93–$97 = OTM CALL targets, low odds unless squeeze begins
Indicators:
* Volume spiking on sell candles, confirming the flush.
* No bullish divergence visible yet on lower timeframes.
* Still no structure signaling reversal — watching $80 reaction closely.
🧨 GEX + Options Sentiment
GEX Insight (Options GEX ):
* GEX Sentiment: 🔴🔴🔴 → deep in short gamma territory; dealers may hedge against bounces.
* $80 = Highest negative NET GEX and PUT wall — this level is critical.
* Below $80 → dealer gamma unwinding could accelerate → volatility spike.
* Above $82 → could set up a fast magnet move to $88 if momentum shifts.
Options Oscillator:
* IVR 68.1 / IVx avg 84.3 → still relatively high, room for volatility to contract.
* CALL$ 22.7% → moderate call buyers, but no clear signal of squeeze intent.
* Time decay visible with large bets expiring in next 2 sessions.
🧭 Trade Scenarios
🐻 Breakdown Play:
* Trigger: Candle close under $80.00
* Target: $77 → $75 (gamma void zone)
* Stop: Above $82.00
* Notes: High odds for 0DTE / 2DTE PUTs on a weak open
🐂 Bounce from Gamma Support:
* Trigger: $80 holds + reclaim $82 HVL with volume
* Target: $88–$91 for gamma mean-reversion play
* Stop: Below $79
* Ideal: Buy 0DTE/2DTE FWB:85C or debit spread targeting quick rebound
🎯 Summary:
PLTR is sitting on the edge of a gamma shelf. $80 is the line between bounce and bleed. GEX shows this is the max pain zone. Bulls need to defend this level aggressively, or we open up for a potential flush to $75 with heavy dealer hedging in play.
⚔️ Suggested Trade:
* 🔻 $80P 0DTE if market gaps below $80
* 🔺 FWB:85C 2DTE only after $82 reclaim with strong volume
* 🎯 Scalpers can use $82/$88 as pivot zones
Disclaimer: This breakdown is for educational purposes. Please trade based on your risk management and setup rules.
PLTR trade ideas
[bearish] a quick PLTR short trade- NASDAQ bearish
- PLTR overvalued.
- PLTR broke recent supports.
- Downside reward >> upside risk.
- TP1: 66, TP2(if you're feeling lucky): 42.
- SL: 98.
- R:/R: 1.76 to 3.95
- Note: graph has a 3 day timeframe as bigboi PLTR here likes to be a loud noisy fucker on the daily.

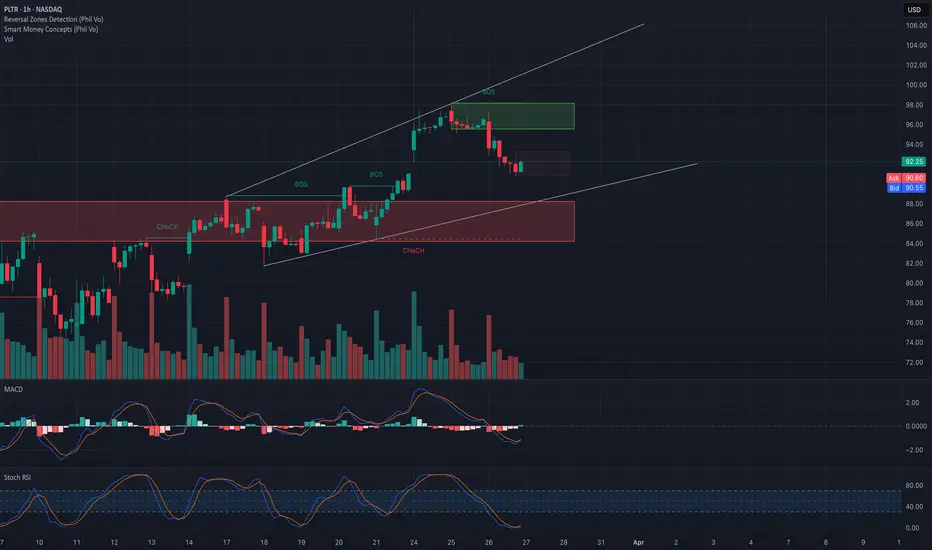
PLTR Building Momentum Inside a Wedge — Breakout Imminent? 🔥
1. Market Structure & Price Action
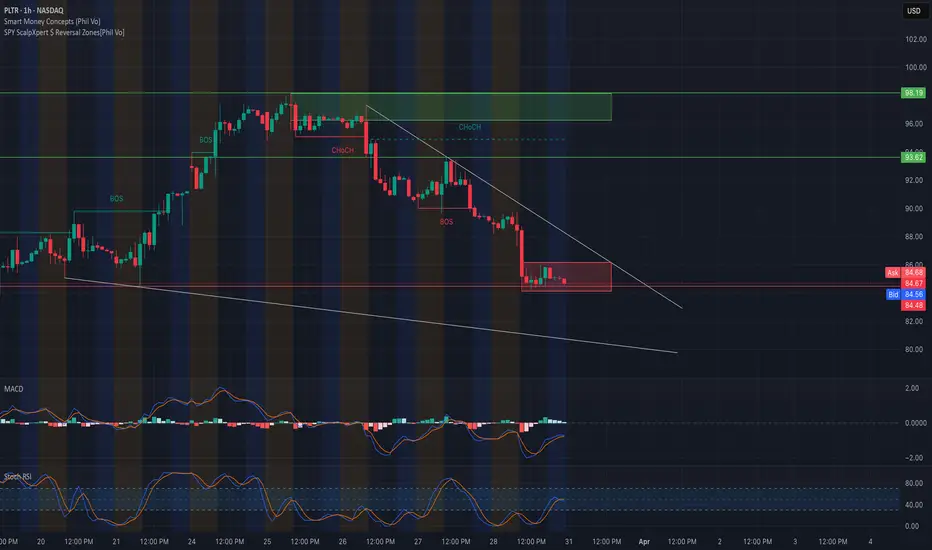
PLTR is compressing inside a descending wedge while forming a small CHoCH near $85, attempting to flip structure.
We saw a BOS from the $80 region, pushing toward the $85 liquidity zone. Price is consolidating under a key resistance band around $86, just below the GEX HVL level.
2. SMC & Supply/Demand Zones
* Demand Zone: $78–$80 range acted as a BOS origin with high buyer reaction.
* Supply Zone: $85–$86 now tested multiple times.
* Downward trendline resistance is holding; a break above could invite a run toward the $90 zone.
3. Indicators Analysis
* MACD: Slightly bullish crossover, histogram fading — suggesting early momentum but caution.
* Stoch RSI: Rebounding from oversold, trending upward toward 80 — suggests bullish follow-through if resistance breaks.
4. Options Sentiment & GEX
* GEX Chart shows a thick CALL Resistance / Gamma Wall at $90, aligned with the second call wall (29.31%).
* HVL at $86: Major short-term magnet — breakout above could initiate a gamma squeeze.
* Put support: Strongest level sits at $80, where downside is well-hedged.
* Options Oscillator:
* IVR: 72.4
* IVx Avg: 85.2
* Call$: 26.1%
* GEX Sentiment: 🟢🟢🔴 — still slightly conflicted, but flipping green.
5. Bullish Scenario 🟢
* Entry: Break and retest of $86 with volume
* Target 1: $90 (Gamma Wall)
* Target 2: $93.5–$95
* Stop-loss: Below $83
6. Bearish Scenario 🔴
* Entry: Rejection from $86 + drop under $83
* Target 1: $80
* Target 2: $78–$77 PUT wall
* Stop-loss: Above $86.5
Conclusion
PLTR is sitting at a critical inflection point. Compression inside a wedge, early CHoCH + GEX alignment suggests breakout potential, but the $86 HVL must be cleared first. Watch volume and MACD confirmation for the next move.
Disclaimer: This analysis is for educational purposes only and does not constitute financial advice. Always do your own research and manage your risk.
PLTRI believe NASDAQ:PLTR is in a wave C correction and will go down more from here.
Possible fall back to $40 region?

PLTR Showing Weakness Near Key Support: Rebound or Breakdown?🔍 Market Structure & Price Action (1H)
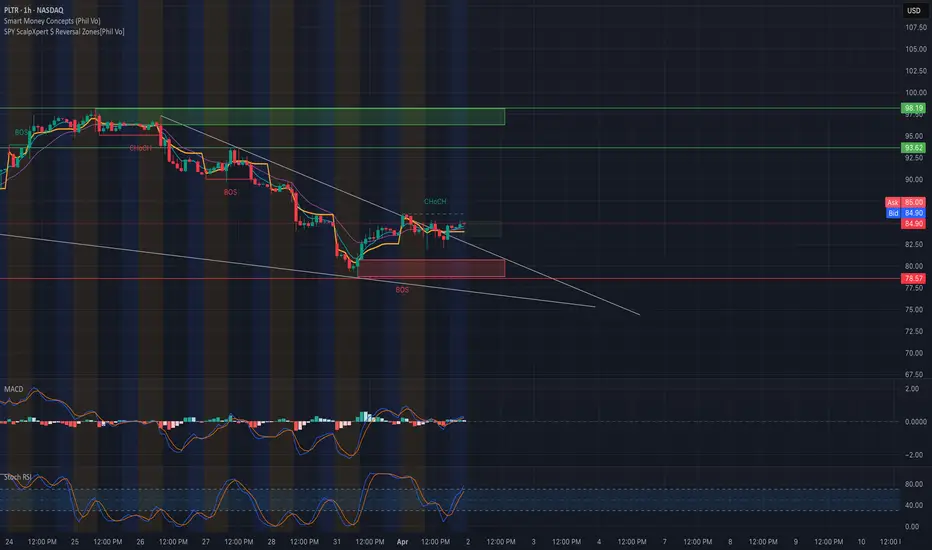
* Trend: Bearish structure confirmed. PLTR has broken previous bullish BOS (Break of Structure) and is forming lower highs and lower lows.
* Current Zone: Price is consolidating in a tight red Reversal Zone near ~$84.50, showing buyer hesitation.
* Descending Channel: PLTR is respecting a well-defined descending wedge. A breakout above the upper trendline (around $86–87) is needed to confirm bullish momentum.
* S/R Levels:
* Immediate Resistance: $86.50–87.00
* Key Support: $84.00, then strong structure at $80.00.
📈 Indicators
* MACD: Momentum is flat, histogram bars weakening—indecision or early sign of reversal.
* Stoch RSI: Curving upward from the oversold region, potential short-term bounce if volume confirms.
🧠 Smart Money Concepts (SMC)
* CHoCH (Change of Character): Bearish CHoCH already occurred, confirming shift in bias.
* BOS (Break of Structure): Multiple BOS reinforce downward trend.
* Liquidity Sweep: Price hovering near potential liquidity zones (below $84), suggesting big players might be hunting stops before reversal or breakdown.
📊 Options GEX + Sentiment (Options GEX )
* IVR: 68.2 (relatively elevated, implies decent premium selling opportunities)
* IVx avg: 90.7, shows heightened volatility priced in.
* Call$/Put$ Flow:
* Calls: 31.6%
* GEX Sentiment: 🔴🔴🔴 (3 Red Dots = Bearish)
* Gamma Exposure (GEX):
* Highest negative GEX zone (PUT wall support): $80.00 → strong magnet if breakdown continues.
* Moderate Put wall: $84.00
* Strongest Call Resistance / Gamma Wall: $92.00–$98.00 (above the descending channel)
* HVL: $85.83 → Heavy volume level, confluence zone for key decisions.
⚔️ Trade Scenarios
🟢 Bullish Reversal Scenario
* Entry: Break above $86 with bullish volume
* Target: $89 → $92 (short-term), then $98 if momentum builds
* Stop-Loss: Below $83.50
* Options Play: Buy Calls 2–3 weeks out ATM ( FWB:85C or $87C) or credit put spreads around $80–$82
🔴 Bearish Breakdown Scenario
* Entry: Break below $84 support with volume
* Target: $82 → $80 (major GEX support)
* Stop-Loss: Above $86
* Options Play: Buy Puts ( GETTEX:82P or $80P), or bear call spreads under $90
📌 Conclusion
PLTR is at a make-or-break zone near strong support. If it holds $84 and breaks the trendline, a short-term relief rally toward $92–$98 is possible. However, if $84 gives way, the GEX-supported magnet at $80 could be the next stop. Watch volume and MACD crossover for early clues.
Disclaimer: This analysis is for educational purposes only and does not constitute financial advice. Always do your own research and manage your risk.
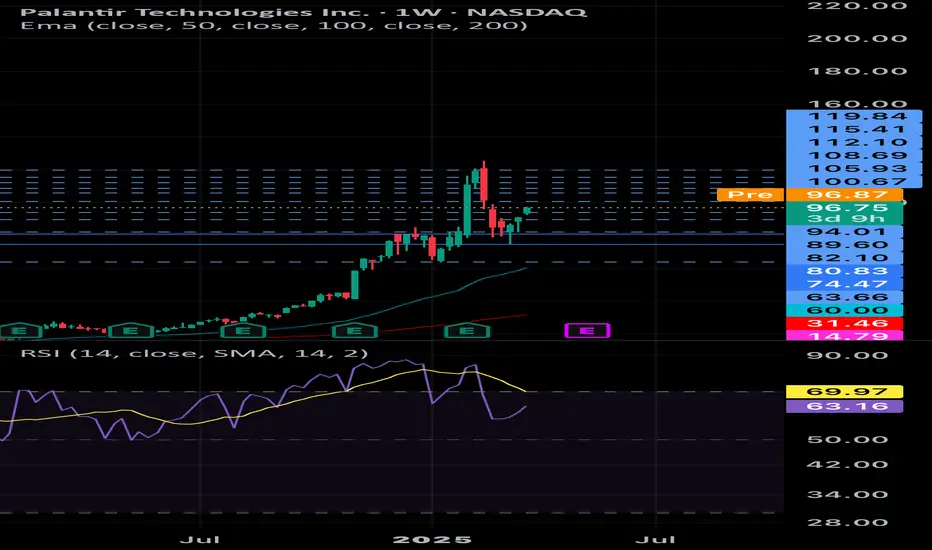
PLTR.. 50.00 inboundLogarithmic chart for the parabolic move
White trendlines - Ascending broadening wedge (Bearish)
Yellow trendline - Primary trend and final target
Looking for a H&S play out here on PLTR for the next 2 quarter.. I don't think this stock ever breaks back over 100.00 this year!
The head is forming now and will be completed at 63.00.. then comes the right shoulder...
The top is in , the rest of these moves are distribution

Entry never triggered todayThe setup never triggered today and also confirmed why I passed on the trade yesterday. the odds of taking positions when the Nasdaq is on a sell signal are not good.

$PLTR First PB Buy SetupIt will trigger just above the Inv Hammer Candle, with the Nasdaq on a buy signal it would be a no brainer. Today I will let it go and pass.
Pullback Continuation PLTR After hit first target 97, now has offereda a pullback to the key 90 level
Indicators showing good potential, momentum, sttregnt, directional.
Part of a market idea

PALANTIR Correction is over. Targeting $200 end of year.Last time we viewed Palantir Technologies (PLTR) was 1.5 month ago (February 04, see chart below), setting a $110 Target and then calling to wait for a correction:
The price action didn't disappoint us and after hitting $110 it gave us the desired pull-back that extended as low as the 1D MA100 (green trend-line). Within the 2-year Channel Up, the 1D MA100 has always been a low risk level to buy.
Until however it breaks above its Triangle, a pattern that has been present as an accumulation phase inside the Channel Up on 4 prior occasions, it is possible to see the stock trading sideways towards the 1D MA200 (orange trend-line), not necessarily making a new Low.
Regardless of some more sideways price action or instant break-out above the Triangle, the current level remains an excellent long-term buy opportunity. We are targeting $200, which would almost be a +183% rise, a usual growth rally for the stock within its Channel Up.
-------------------------------------------------------------------------------
** Please LIKE 👍, FOLLOW ✅, SHARE 🙌 and COMMENT ✍ if you enjoy this idea! Also share your ideas and charts in the comments section below! This is best way to keep it relevant, support us, keep the content here free and allow the idea to reach as many people as possible. **
-------------------------------------------------------------------------------
💸💸💸💸💸💸
👇 👇 👇 👇 👇 👇

SPY, QQQ, BTCUSD, TSLA & PLTR Daily Trade SetupsIn this update we review the recent price action in the SPY, QQQ, BTCUSD, Tesla & Palantir and identify the next high-probability trading opportunities and price objectives to target. To review today's video analysis, click here!

PLTR Retracing into Structure – Gamma & Trend Support in Focus!🔍 Technical Analysis (TA) – Intraday View
Current Price: ~$90.55
* PLTR broke out strongly from the CHoCH zone and achieved a Break of Structure (BOS) at the ~$94–95 level.
* It is now retracing inside the bullish channel, testing support just above the CHoCH region.
* Price is approaching a strong confluence zone of dynamic trendline support and previous resistance flipped support.
Indicators:
* MACD: Bearish but flattening — early sign of stabilization.
* Stoch RSI: Oversold and starting to curve — watch for momentum reversal if it crosses upward.
🔐 Key Levels
Support:
* 89 → GEX HVL pivot zone, potential bounce level.
* 85 → Highest negative NETGEX support zone (PUT defense).
* 80 → Key PUT wall and broader liquidity zone.
Resistance:
* 94–95 → BOS supply zone + minor CALL wall.
* 100 → Major resistance (Gamma Wall + 3rd CALL Wall).
* 107.40 → Extended high – unlikely unless squeeze happens.
🧠 GEX & Options Flow Analysis (TanukiTrade Pro)
* GEX Sentiment: 🟢🟢🟢 – Fully Bullish
* IVR: 53.1
* IVx avg: 72.8
* CALL$%: 36.2% → Bullish positioning, strong call dominance
* Gamma Wall: 100 → Strong resistance magnet
* PUT Walls:
* 85 (Primary GEX support)
* 80 → backup floor
* HVL Cluster: 89 → Gamma pivot level today
📌 This positions PLTR in a bullish gamma structure, and the current pullback could be a buy-the-dip setup.
🛠️ Trade Scenarios
📈 Bullish Setup – Bounce off 89–90
* Price holds HVL/GEX pivot zone and shows signs of buyer absorption
* Entry: Above 91.5 with confirmation
* Target 1: 94
* Target 2: 95.5
* Target 3: 100 (Gamma squeeze)
* Stop-Loss: Below 88.5
* Options Play:
* Buy Apr 12 $95 Calls
* OR Bull Call Spread: Buy $90 / Sell $100 Calls
📉 Bearish Setup – Breakdown Below 88.5
* Clean rejection from supply zone + break of rising channel
* Entry: Breakdown below 88
* Target 1: 85
* Target 2: 80
* Stop-Loss: Above 91
* Options Play:
* Buy Apr 12 $85 Puts
* OR Bear Put Spread: Buy $90 / Sell $85
🧭 Final Bias & Strategy
* Bias: Bullish unless price closes below 88.
* Currently consolidating near strong gamma and trendline support.
* As long as it holds above 89, there is potential for continuation toward 95–100.
* Watch for reclaim of BOS zone to trigger option flows toward the next CALL wall.
📛 Disclaimer: This analysis is for educational purposes only and does not constitute financial advice. Always manage risk and do your own research.
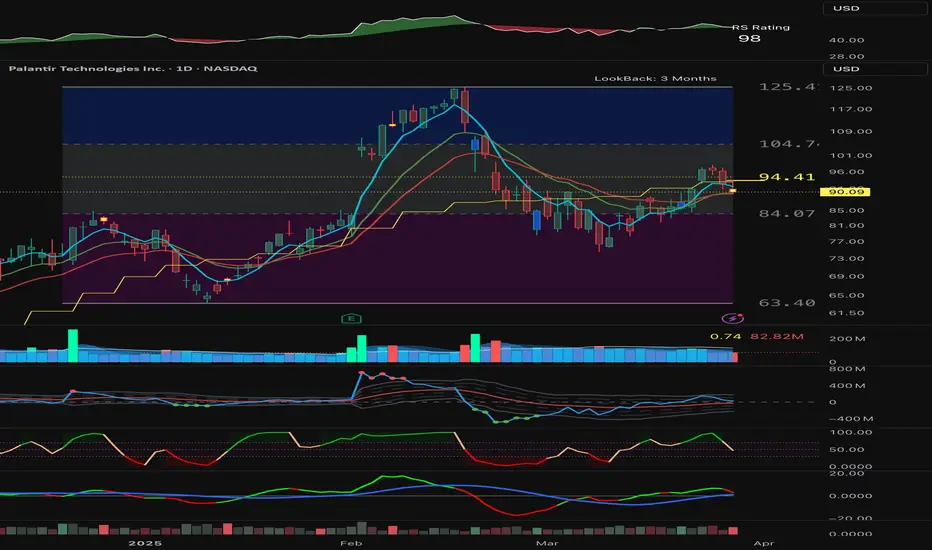
Palantir: Successful!PLTR effectively initiated a directional change within our now-gray Target Zone, and potential long trades opened within this range should already be significantly in the black. We locate the price in the corrective movement of the green wave , which should develop through the magenta waves (A) to (E) within a pink triangle formation. Ideally, the stock should remain above the low of wave (A), which has just been settled in our Target Zone. Only after the corrective movement has concluded do we expect the transition into the green wave , which should lead the stock to new highs. A premature breakout above the $125.40 mark is possible in our alternative scenario, but it is only rated with a 33% probability.

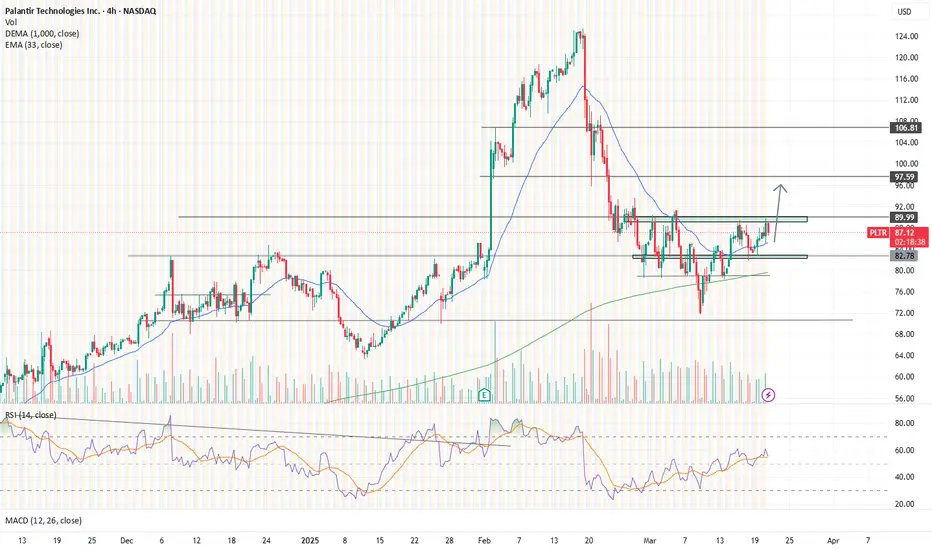
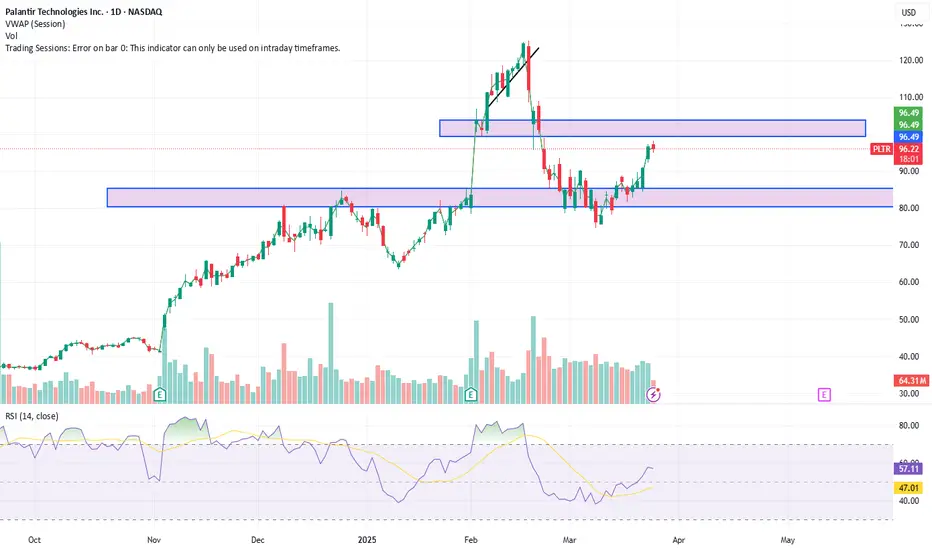
#PLTR preparing a nice launchpad in a FLAG form will it see 106?
Technical's:
As of pre bell PLTR has positioned and holding right above A.VWAP from the last Earnings Report (4 Feb 2025) .
coincidentally the stock teases us with a flag formation drawing buyers attention, will run all the way to 106.00 level from last month ?
For short term traders might be something to look at! remember to keep your risk into account
Not financial advice !

PLTR eyes on $84.69 (again): Golden Genesis fib and a MUST HOLDHere we are again at a Golden Genesis fib, strongest of all fibs.
"Golden" as in an exponent/multiple of .618, the Golden Ratio.
"Genesis'" as in the primary wave of this asset's growth pattern.
A retest was expected but bulls needed it to happen much sooner.
The high altitude drop has pierced the fib instead of a clean bounce.
Bulls need to "orbit" this fib and then attempt to slingshot Northward.
=============================================================================
Previous post calling the last pullback:
============================================================================

PLTR LEVELS ENDING MARCHI like PLTR of course.
Buy every dip??? or hold off to certain price point?
Again
DCA METHOD, aggressive but safe (Making up for lost time since covid when i started and stopped)
Opening (IRA): PLTR May 16th 90 Covered Call... for a 76.56 debit.
Comments: After taking off my iron condor for a loss, structuring a covered call such that the max profit potential is greater than the loss experienced by the nondirectional of 13.11.
Metrics:
Buying Power Effect/Break Even: 76.56
Max Profit: 13.44
ROC at Max: 17.55%
Will generally look to roll out the short call out and/or down and out at intervals to increase profit potential and/or reduce downside break even ... .

PLTR LONGLong calls. New higher low on the weekly after finishing the sell off. Holding for new Highs. i’m expecting all of the volume that was sold during the sale will be put back into the market with the additional gains from the sale.looking for $120 to become the new support. Holding until further notice.
PLTR Approaching Critical Gamma Level! Reversal or Continuation?Here's an in-depth update on PLTR based on the current 1-hour chart and Gamma Exposure insights.
📈 Technical Analysis (TA):
* Current Price Action: PLTR is trading around $96 after a strong bullish move. It is currently consolidating within a green reversal zone, suggesting caution for possible short-term reversals.
* Immediate Resistance: The significant gamma resistance (Gamma Wall) is located at $100, which could act as a strong magnet for price action but also a tough barrier for bulls.
* Support Levels: Strong support and reversal (red) zone detected around $86, marking an important area for potential bullish continuation if tested again.
* Reversal Zones: Price is currently inside the green reversal zone (around $95–$97). Watch closely for signs of weakening momentum or rejection, signaling a possible pullback.
📊 GEX & Options Insights:
* Gamma Resistance: Highest positive NET GEX at $100, creating a strong overhead resistance and potential magnet level for bullish scenarios.
* Gamma Support: Put support relatively low with notable strength at $75, indicating significant downside protection.
* IVR (Implied Volatility Rank): Moderately high at 52%, suggesting elevated premiums—favorable conditions for credit spreads or cautious long options plays.
* CALL Dominance: Calls at 42.6% indicate a relatively balanced yet slightly bullish market sentiment.
💡 Trade Recommendations:
* Bullish Scenario: Watch for a sustained breakout above the $97 resistance area targeting the key $100 Gamma Wall. Place a conservative stop-loss around $94.
* Bearish Scenario: Consider bearish strategies (puts or credit call spreads) if a strong rejection from the current green reversal zone occurs, targeting downside levels near $90–$86.
* Neutral/Range Scenario: Ideal conditions to implement neutral options strategies like iron condors or credit spreads between $85 and $100 given the elevated implied volatility.
🛑 Risk Management:
* Given PLTR's elevated volatility and proximity to reversal zones, tight risk management with clear stops is essential.
Trade wisely and responsibly!
Disclaimer: This analysis is for educational purposes only and does not constitute financial advice. Always perform your own research and manage your risk appropriately.

Pullback in Palantir Palantir Technologies had a dramatic rally in recent months, and now traders may see an opportunity in its latest pullback.
The first pattern on today’s chart is the 50-day simple moving average (SMA). While many other stocks, like Apple and Microsoft, have plunged below their 200-day SMAs, PLTR ended last week above its 50-day SMA. That may reflect relative strength versus the broader market.
Second, prices made a lower low and higher high on Friday. That kind of outside candle is a potentially bullish reversal pattern.
Third, the software company just had its highest weekly close since February 21.
Next, some short-term indicators may be positive: MACD is rising and the 8-day exponential moving average (EMA) is nearing a potential cross above the 21-day EMA.
Finally, PLTR is one of the top underliers in the options market. (Its 800,000 contracts per day in the last month ranks it fourth in the S&P 500, according to TradeStation data.) That could help traders take positions with calls and puts.
TradeStation has, for decades, advanced the trading industry, providing access to stocks, options and futures. If you're born to trade, we could be for you. See our Overview for more.
Past performance, whether actual or indicated by historical tests of strategies, is no guarantee of future performance or success. There is a possibility that you may sustain a loss equal to or greater than your entire investment regardless of which asset class you trade (equities, options or futures); therefore, you should not invest or risk money that you cannot afford to lose. Online trading is not suitable for all investors. View the document titled Characteristics and Risks of Standardized Options at www.TradeStation.com . Before trading any asset class, customers must read the relevant risk disclosure statements on www.TradeStation.com . System access and trade placement and execution may be delayed or fail due to market volatility and volume, quote delays, system and software errors, Internet traffic, outages and other factors.
Securities and futures trading is offered to self-directed customers by TradeStation Securities, Inc., a broker-dealer registered with the Securities and Exchange Commission and a futures commission merchant licensed with the Commodity Futures Trading Commission). TradeStation Securities is a member of the Financial Industry Regulatory Authority, the National Futures Association, and a number of exchanges.
Options trading is not suitable for all investors. Your TradeStation Securities’ account application to trade options will be considered and approved or disapproved based on all relevant factors, including your trading experience. See www.TradeStation.com . Visit www.TradeStation.com for full details on the costs and fees associated with options.
Margin trading involves risks, and it is important that you fully understand those risks before trading on margin. The Margin Disclosure Statement outlines many of those risks, including that you can lose more funds than you deposit in your margin account; your brokerage firm can force the sale of securities in your account; your brokerage firm can sell your securities without contacting you; and you are not entitled to an extension of time on a margin call. Review the Margin Disclosure Statement at www.TradeStation.com .
TradeStation Securities, Inc. and TradeStation Technologies, Inc. are each wholly owned subsidiaries of TradeStation Group, Inc., both operating, and providing products and services, under the TradeStation brand and trademark. When applying for, or purchasing, accounts, subscriptions, products and services, it is important that you know which company you will be dealing with. Visit www.TradeStation.com for further important information explaining what this means.

Go Long on PLTR: Strategic Restructuring Signals Growth Potentia
-Key Insights: Palantir Technologies is undergoing significant strategic
restructuring, particularly within its government business segment. This move
enhances its operational efficacy and positions it for potential market
expansion. The company's proactive approach in adapting to changes indicates
robust regenerative growth capabilities. Investors should remain optimistic
about its long-term value due to these strategic initiatives.
-Price Targets:
-Next Week Targets: T1 = $93.69, T2 = $95.45
-Stop Levels: S1 = $88.67, S2 = $87.20
-Recent Performance: Palantir has witnessed fluctuations but maintains a strong
foothold due to strategic positives. Restructuring has led to an operational
realignment, which although resulted in an 8% segment reduction, conveys greater
profitability potential. Despite recent dips, these strategic decisions have
fortified investor confidence in the company's projected trajectory.
-Expert Analysis: Analysts align Palantir's potential growth with that of tech
giants like Tesla, driven by favorable market and regulatory conditions. The
strategic restructuring is seen as a smart maneuver, enhancing the firm’s
competitive advantage in both public and private sectors, and prepares it for
tapping into emerging opportunities.
-News Impact: Palantir's upcoming Q3 earnings report has attracted significant
attention, especially following announcements of major deals set to boost
revenue streams. These partnerships showcase Palantir's adeptness at recognizing
and leveraging profitable opportunities, reinforcing its market dominance.
Investors should closely monitor these developments, as they will likely
influence PLTR's financial health and investment appeal.

alerted at 83 still going strong based on indicatorsEntering week 2, we are still on course and have a target to hit 100. Oversold areas, oscillators reboot.