Weekly Outlook! 3/1 - 3/5Here we go over last weeks video and we take a look at a few things we are keeping an eye on for the coming week!
QCOMD trade ideas

Qcom Qualcomm Inc have a median target of 175.00, with a high estimate of 200.00 and a low estimate of 122.00. The median estimate represents a +31.18% increase from the last price of 133.40


Qcom channel trade Hit rock bottom after a earnings sell off followed by Nasdaq mini correction. bounce off the bottom of its channel today and I grab some contracts for 2 reasons.
1st - Over sold on all indicators RSI , MFI. and touch bottom of its. channel
2nd - President signed executive order for chip manufacturers (Sympathy play)
Yellow line is a downtrend .
Green lines are fibonacci targets , 100 day MA is also around 147$ area. will need strong volume to push through .
Double bottom at 151 which should help it closed that gap to 160

QCOM - Short Setup Break 142.43. Stop signal 146.53, stop 152.57. Target 1 126.23. Momentum Target from there. Strong insider selling end of last year. Could consider May $140 Puts

QCOM: Worldwide 5G Phones ReplacementSentiment play: Worldwide 5G Phones Replacement
Uptrend following
Based on Fibo retracement currently at strong support.
If break the support, to execute CL immediately, 1% below the support.
TP at fibo extension, 1.618 resistant.
There is no perfect trading. Ready to CL whenever require.

QCOM is still in a strong uptrendNotes from web browsing: "Assessing Qualcomm’s outsized gains, J.P. Morgan analyst believes “Qualcomm shares have reacted positively to the company successfully leveraging the 5G smartphone opportunity.” However, taking this into consideration, Chatterjee wonders how much upside is left from the 5G exposure. Luckily for Qualcomm, the company has other significant “revenue drivers.” Chatterjee estimates that the “combination of smartphone baseband as well as adjacent market opportunities will drive material upside for QCT revenues relative to consensus.” This should also result in roughly $1.4 billion more revenue than the analyst’s previous estimate for FY22. These “adjacent markets” are for RFFE (rf front end) in smartphones, automotive, and IoT (internet of things). While Chatterjee forecasts a 26% CAGR (compound annual growth rate) for 5G based sales between FY2019 and FY2022, RFFE smartphone is anticipated to exhibit a 40% CAGR, with Automotive at 25%, and an additional 8% for IoT. These figures are based on the assumption that Qualcomm takes a big chunk of revenue share from each SAM (service addressable market).


LONG QCOM into marchThese spreads have some good risk / reward with the semi conductor shortage and QCOM still at a decent p/e after the dip.
buying the 19th Mar $145.00 Call
selling the 19th Mar $150.00 Call
breakevens at 147.40
Max Profit is 108%

$QCOM, reversal and potential gap fill-QCOM has dropped near levels that haven't been seen since December and prior to that where the big earnings gap was created.
-As the reversal for a gap fill wanted to happen fast we notice that we are trading near levels prior used as support where we have $146 and $148 as we look to gap fill I will be looking at my first target of $152 to start entering the gap and as we continue the uptrend movement while expecting pullbacks for proper retest of levels as support I will be aiming for target 2 $156 and my last target to $162

QCOM over 151.78Gap above, needs to put in a base after earnings reaction, likely to reject gap before starting to fill.

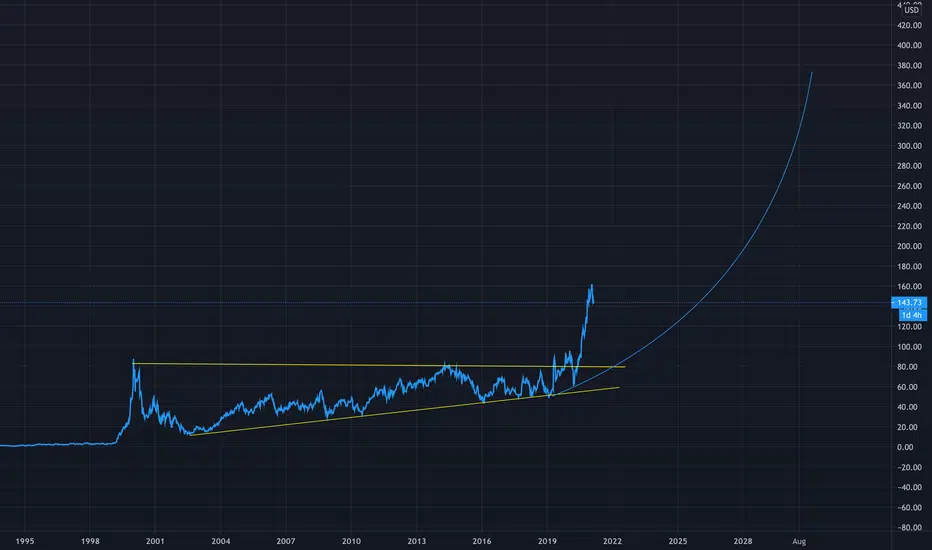
Qualcomm breaking through resistance to higher highsQualcomm has traded in the same channel for a good amount of time now. It hasn’t always bounced side to side but the channel has held. Right now we are in an excellent position for a long. It just bounced off of the channel line I have drawn in, the daily macd is slowing, the 4 hour macd has already crossed over. I’m going long.

QCOM 2/13/2021QCOM still sitting in a HVN within the value area. My initial trade plan is still intact. Breaking out over the anchored VWAP would be an ideal scenario to reduce risk on the position.

$QCOM Long setup opportunity.Bouncing off the .5 Fibonacci retracement level. A good way to play this is to set your stop below that level and to set your profit target to the next resistance level.
Like if you’re bullish!

QCOM GO!Hi,
Seems that Qcom accumulated some power for hitting through the resistance line.
Need to follow it today. If it will hit through, then everything will happen.
AG

Great Qualcomm play on the retest of the long-term uptrendThe uptrend line from March lows will need to be retested at some point in the medium-term future.

QCOM looks alot like AMD a week agoQCOM is a good company with great tailwind for continued success. Their snapdragon processors for android devices continue to improve, and they are attractively priced relative to other semiconductors.
QCOM beat on EPS, but slightly missed on revenue. However, given broader demand shocks for semis, I would not be surprised at beats in the future when supply picks up to meet the demand.
Having beat on EPS and gapping down, this is a blessing. Buy in! A lower priced asset of a quality company will yield greater expected returns than that same asset at a higher price. Having confirmed QCOM's strength and settling price at support, I believe now is the time to pick up some QCOM.
Now, why does QCOM look like AMD? Well, AMD a week ago was settling above a gap after an earnings call. The 100MA quickly moved up and became a support. A few trading days later, there was a bounce from 88 to 92 as of writing. AMD also suffered from multiple compression after an EPS beat.
If you aren't convinced of a long term investment into QCOM, I think a bounce play can be found here.
As a broke college student, I have put my money where my mouth is and purchased an entire (1) share(s). Wish you all the best in making tendies, and thank you for reading my analysis.

Is it right time to buy QCOMQCOM is right at the bottom and enjoying the support levels at around 145ish. The support trend line suggesting mid march highs. For me it looks like best time to buy QCOMM.

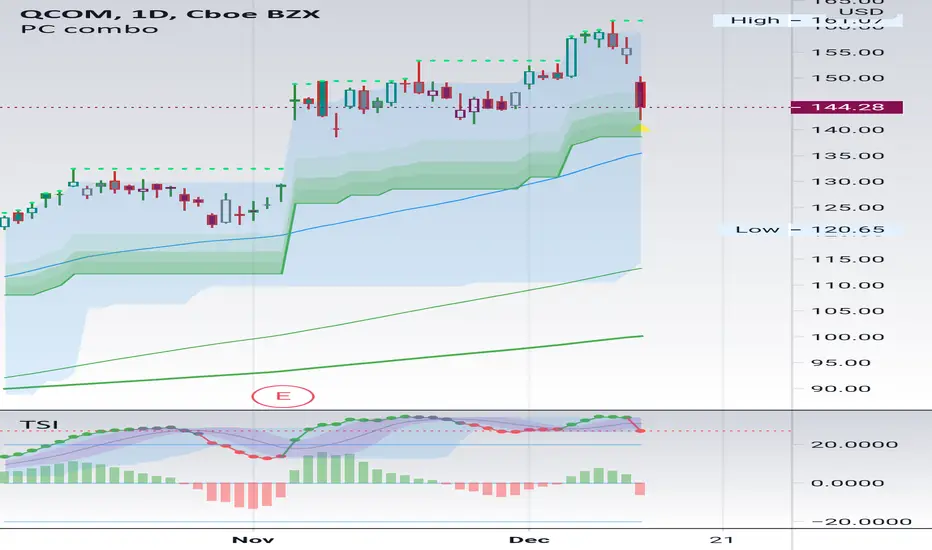
HOW-TO Know This Chart Is EXTENDED? The Stock market overall is VERY extended
You might hear this term being used a lot these days.
For beginners, it could be a confusing thing.
In trading we like to time our entries. We don't want to buy something when its "too expensive"
In Chart terms, an expensive stock is one that has trend strongly for a period of time and showing signs of Exchaustion or Reversal
In this video I try to explain what makes a chart an "extended" or "Over Priced Stock"...
I use my Indicators and Chart pattern to answer this question.
Let's see how!!!

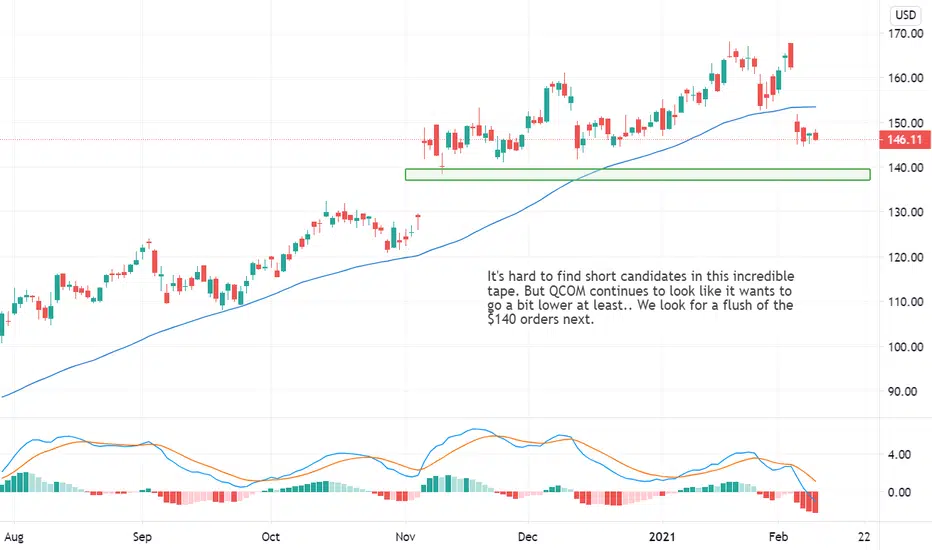
$QCOM Ready to Flush a Bit LowerIt's hard to find short candidates in this incredible tape. But QCOM continues to look like it wants to go a bit lower at least.. We look for a flush of the $140 orders next.
Reversing tomorrow ? I was checking the activity of the stock today, looks like people is loading up. How many days will be in this level ? 145 - 146 already has three
