Riot Triangle and ChannelDowntrend parallel channel for this crypto related stock. Current chart pattern looks like a triangle with what could be a bull flag forming below the upper line. It looks to me like a break upwards could occur soon.
RIOTD trade ideas

$RIOT - Weekly (Upward Channel)If you are looking to enter and play with the crypto world NASDAQ:RIOT is a great option since it's has institutional holders without the steep price tag of $BTC. It moves with CRYPTOCAP:BTC so when CRYPTOCAP:BTC is up, NASDAQ:RIOT is up and vice versa. It's been slowly building support but I see a steady upward channel. R at 13 and S at 8.75. I think it has potential to reach 25+ in 2024 when CRYPTOCAP:BTC halves.

RIOT - Better Days are ahead
Coiling in a textbook fashion. Right side of inverse handle likely to be formed up next. I'd expect a pullback again there for more consolidation.
T1: 14
SL: 11.30

$RIOT Potential SetupNASDAQ:RIOT getting tight with early turn after a 75% decline from 2021 top.
Clear supply line with higher than average selling on Friday right from that level.
$RIOT Awaiting A Major CatalystThe Bitcoin mining leader Riot Platforms, Inc. (NASDAQ: RIOT), is, to no one’s surprise, deeply tied to Bitcoin prices, which have seen a 65% increase YTD. With the government forecast to run out of money as early as June 1, talks about a debt ceiling deal to be finalized by next week started arising. The general sentiment at the moment is that a deal will be made before June after positive talks between President Joe Biden and House Speaker Kevin McCarthy. That would pave the way for Bitcoin’s value to increase as it is a risky asset, and risky assets’ value is deeply tied to macro stability, which in turn will see the RIOT stock price increase.
RIOT Fundamentals
As of right now, the US is navigating the uncertainty of the debt ceiling as the deadline gets closer and closer and the risk of defaulting increases. Defaulting would be catastrophic, not only for Bitcoin and RIOT but for the whole stock market and the US economy. The US government probably will not resort to defaulting because of the risks it poses for its economy.
A deal was put forward to suspend the debt limit by $1.5 trillion or until March 31, 2024, in exchange for other demands like a spending cut for the next 10 years, it is expected that a deal will be reached before June regardless. This sentiment was made stronger after President Joe Biden and House Speaker Kevin McCarthy gathered Monday evening for one-on-one negotiations and offered strikingly optimistic takes on where things stand.
If a debt ceiling deal were to be made, that would mean that the US has reached macro stability. In that case, the stock and cryptocurrency markets would see more of a bull market, which is all good news for RIOT. As a leader in Bitcoin mining, if Bitcoin saw an increase in value it is expected that RIOT stock would also increase alongside it. Bitcoin was already doing well this year in what a lot called a bear market, so it is expected to rise even more in case a deal has been reached.
RIOT stock saw a 10% increase earlier this week and a 249% increase YTD despite RIOT recording disappointing Q1 2023 results. There is also a chance of a short squeeze happening as RIOT stock has a short interest rate of 15.92% and 34.85% of its free float on loan, while also having a 100% utilization rate. This can result in the RIOT stock price soaring as the short sellers are forced to cover their short positions.
In Q1 2023, RIOT Produced 2,115 Bitcoin as compared to 1,405 Bitcoin during the same three-month period in 2022 and currently holds 7,094 Bitcoin which amounts to $202 million at the current Bitcoin trading price. RIOT is currently building a 1-gigawatt developed capacity facility in Texas to expand its Bitcoin mining and data center hosting capabilities. In that case, RIOT would increase its Bitcoin production by a huge margin once the facility becomes online. That would mark RIOT increasing its revenue exponentially especially if Bitcoin rallies after the debt ceiling deal.
RIOT Financials
In its Q1 2023 report, RIOT’s assets decreased 5% YoY from $1.319 billion to $1.250 billion, and its cash and cash equivalents decreased 31% YoY from $230 million to $158 million. RIOT’s total liabilities saw a slight increase of 6% YoY from $168 billion to $158 billion.
Revenue also increased 8% YoY from $79 million to $73 million. Operating costs increased almost 225% from $40 million to $130 million, which contributed to operating loss increasing nearly 240% YoY from $39 million in operating income to $56 million in operating losses, which amounted to a net loss of $55 million – a 250% increase YoY.
Technical Analysis
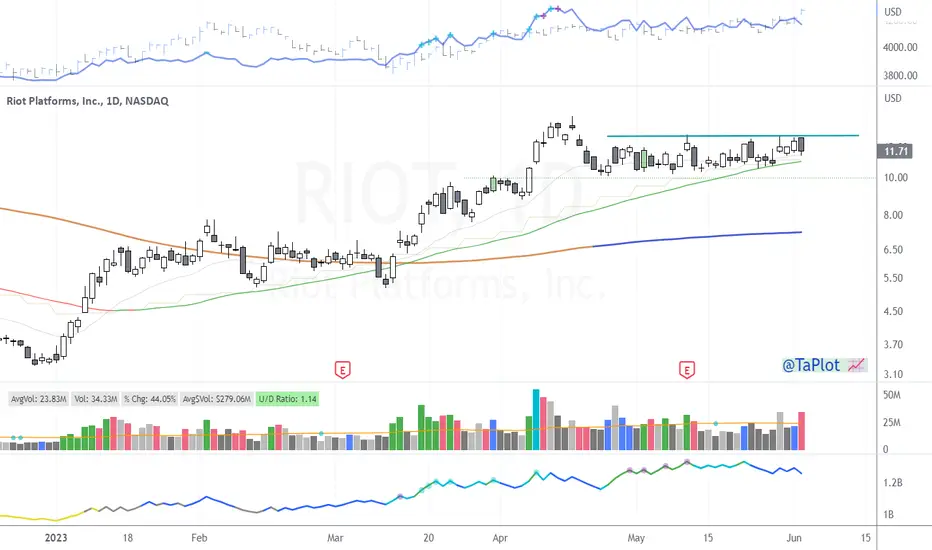
RIOT stock’s trend is neutral with the stock trading in a sideways channel between $10.3 and $12. Looking at the indicators, the stock is trading above the 21, 50, and 200 MAs which are bullish indications. However, the RSI is overbought at 71 and the MACD is bullish.
As for the fundamentals, RIOT’s main catalyst is the expected Bitcoin rally if a debt ceiling deal is reached. Despite the RSI being oversold, RIOT stock could continue performing well due to the positive expectations of reaching a debt ceiling deal.
RIOT Forecast
Bitcoin and in turn RIOT stock have increased 65% and 249% respectively YTD. If a debt ceiling deal were to be made and the U.S. reached macro stability both assets are expected to run. The next few days are important for RIOT stock as the talks continue to reach agreeable terms between both parties.

RIOT Alongside MARA - Possible long setupDips getting bought around 10$. Price range it's getting tight with a nice bullish flag pattern forming. I would like to enter before the breakout happens (if it happens) with a very small risk.

RIOT: long until the channel breaksRIOT has hit a snag and has been consolidating as Bitcoin struggles to breakthrough 30K ceiling. With the current macroeconomic headwinds from debt ceiling clown show to fade rate circus it is not unexpected that BTC may fall back to 20 K support. If that happens, then RIOT will also take a hit and the current bull case might be in jeopardy. But I am still hopeful as the price action looks much more like a wave 4 correction than a big impulse to the downside. Until the channel breaks, I will stay long with $21 target. Will go short if the bull count is completely invalidated below $7.76. I don't short BTC but use RIOT and MSTR as a proxy to short crypto market.

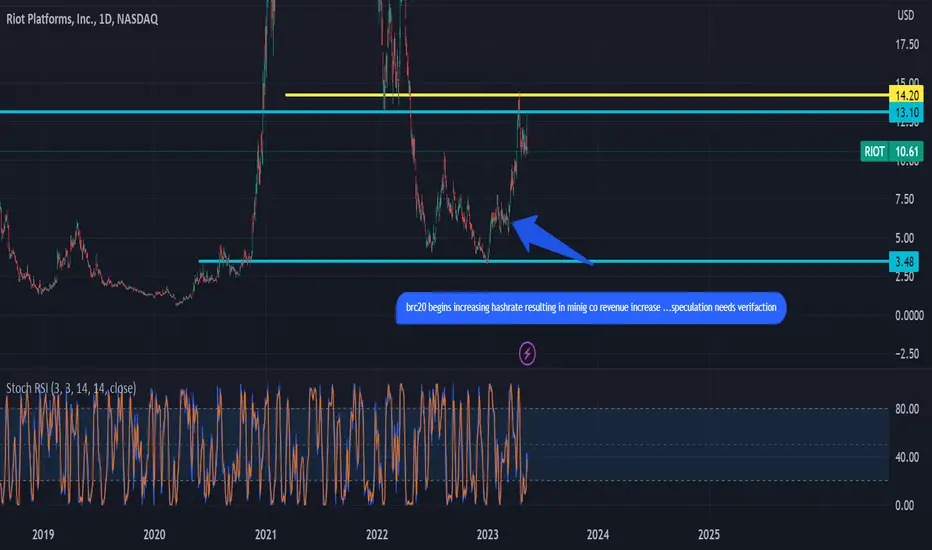
Riot platforms BTC hash rate increaseIs the increase in hash rate increasing share price for mining companies i would like to know if this is indeed a catalyst any input on the subject is appreciated
RIOT $11.75 Price TargetGot in calls a little late but love how we held higher time frame support around 10:30 at $10.33. Expecting this to bounce to $11.75 later this week. Might be able to catch some calls on this one over $10.81 if you keep an eye out.

second bull flag breakout on riot in tandem with rising btc pricRiot is a stock we have traded several times with options contracts. options expiring in May in the 12-15$ region are potentially very lucrative. I personally went with 12$ strike May 26th on the bounce of the red line before flag break.

RIOT LONGRiot broke out of its descending channel with high volume on the daily. We may see a possible retest of $5.50 then continue higher.

RIOT - might be time to take profits?The price is hitting the 1 Week MA 200. Might want to move stop loss right below it (maybe $12.50) in the event that wave (iii) is complete at the 1.618 and ready to move to wave (iv).
Your decision.
Good Luck

RIOT PlatformsAll I know riot will be bullish becaause of Bitcoin. Riot follows the same pattern as BITCOIN. Bitcoin right now is going through corrective phase while

Mean Reversion (Shorter Term)Looks ready to run back to ~14.80, possibly higher depending on the push we see in BTC.
I'd be cautious at 14.80, and extremely cautious at $21.20..
Shorter term..
I don't think this stock rallies to new highs until 2025.

BTC Bull Play RIOT Double H & SRiot just completed a double H & S similar to BTC this week. Break out at $8 - target $12 - risk to $6 would provide 1:2 risk ratio.

RIOT...UT (2D)Resistance (Major) @ 20.31
TP2 @ 20.00 (close trade)
Resistance (Minor) @ 14.23
TP1 @ 14.00 (shave 50%)
BSO @ 15.50
BLO @ 7.27

RIOT short to 6.5It appears RIOT will not hold this line and I believe the C3 incident is enough to make crypto and tech take a big hit right now especially being in an already weak position. My target is around 6, point of control support

Example of a bull flag on Riot that played outI mostly trade bull flags, especially if they are following a previous cup and handle breakout. Here is an example of a bull-flag we traded that played out to a massive upside, we used 30 day expiration calls on a strike of 10$ for this particular setup.

This goes hand in hand with my bitcoin ideaLooking for something similar to the prior channel in the last bear.

Riot UOI TestTest of UOI indicator mixed with simple trendlines and own TA measures. Assuming trendline breaks, looking to see how accurate or long the sell signal reacts. 15 min time frame of course.

Long RIOT #tradingtheapocalypseFundamentals: Riot Platforms, Inc is a Bitcoin mining company that survived the recent downturn in Bitcoin price, unlike some of its competitors. That's as much as I need to know. This trade is a leveraged bet on Bitcoin. Bitcoin recently completed a weekly Wyckoff accumulation pattern, which was confirmed by the break and hold above 26k.
Technicals: Crypto equities seem to respect nothing in particular except the Bitcoin price, and the general stock market conditions. However, moving averages help. RIOT has closed above its 200-day Exponential Moving Average, and tested it as support, along with previous resistance, gapping up afterwards, showing demand.
The trade is a long from here, with a stop below the recent low around $5. Ultimate target is the most recent peak the last time price was above the 200 EMA, but really the trade should be managed according to the state of the crypto market.


RIOT - 126-130$ top target for 2025In this analysis, we will delve into the significance of confluence in technical analysis, the implications of shareholder dilution, the role of Bitcoin mining, and the importance of the technical indicators used in our assessment of Riot Platforms, Inc (RIOT).
Confluence in Technical Analysis
Confluence is a crucial aspect of technical analysis, as it allows traders to identify critical price levels where multiple technical indicators align. This increases the probability of a successful trade, as it provides confirmation and reduces the likelihood of false signals. The confluence between the 1.382 Fibonacci speed resistance fan and the horizontal 1.618 Fibonacci extension level in RIOT's chart offers a compelling indication of a potential turning point.
Shareholder Dilution
Shareholder dilution occurs when a company issues additional shares, which results in a decrease in the ownership percentage of existing shareholders. This can negatively impact the stock's value and investor sentiment. Therefore, avoiding shareholder dilution is essential to maintain shareholder confidence and support the stock's price appreciation.
Bitcoin Mining
As a company primarily engaged in Bitcoin mining, RIOT's performance is closely linked to the cryptocurrency market. Continued growth in Bitcoin mining will likely support RIOT's revenue and contribute to its stock performance, especially during periods of heightened crypto market activity. Conversely, regulatory setbacks or a decline in mining activity could negatively impact RIOT's stock price.
Technical Indicators
Our analysis employs the convergence of the 1.382 Fibonacci speed resistance fan and the horizontal 1.618 Fibonacci extension level to determine potential price targets. These indicators have proven to be reliable in identifying key support and resistance levels in the past. By extrapolating the data from these indicators, we can project a potential price target of $126-$130 for RIOT.
Conclusion
In light of the confluence observed in RIOT's chart and the importance of avoiding shareholder dilution and sustaining Bitcoin mining operations, we recommend considering a long position in RIOT around November/December of this year. This strategy aims to capitalize on the anticipated cryptocurrency market euphoria and achieve a price target of $126-$130. However, it is crucial to monitor the company's performance and the regulatory landscape, as these factors may impact the stock's trajectory.
