RIOTD trade ideas

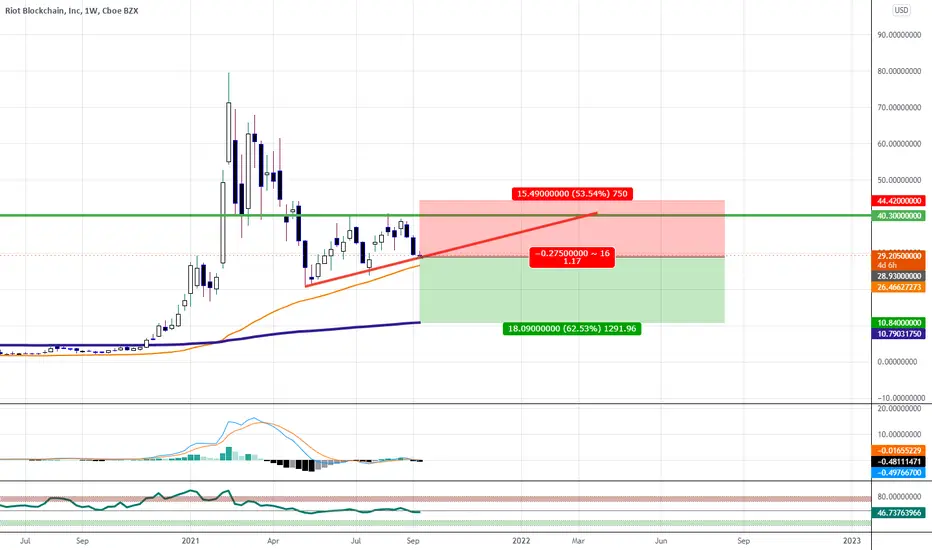
Riot Tripple bottomover the last 5-6 months, riot has been forming a big tripple bottom pattern, both on the daily charts as well as the weekly. On the weekly it is in a massive wedge as well.
If Bitcoins pushes over 50,000 dollars Riot is definitely a stock to watch

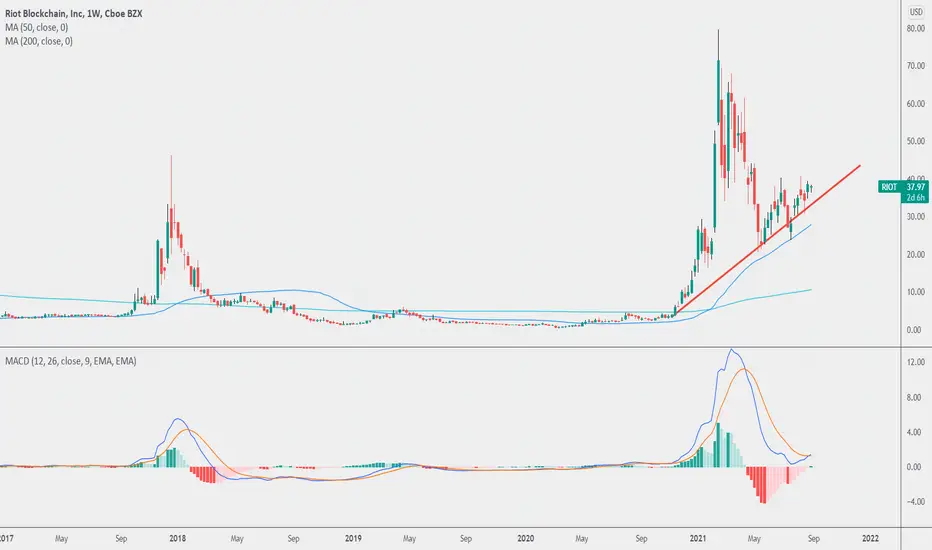
RIOT - YTD trendline broken todayThe simplest of trendlines and a classic example of breaking support.

RIOT broke its trendline from the beginning of the yearQuite simple. Make your own trendline from the lows of this year and see if the recent action violated it?

nice channel nice patterni just saw this. depending of tomorrows candle it is worth giving it a shot. 50% gain in 4 weeks. even it broke the MA 200 it still could be very bullish the next weeks. the fundamentals for this stock are exellent, idk why this shouldnt go back to 35.
Throw a like and leave a comment.
no financial advice, just for the lol

Perfect Bounce on Trendline for RIOTTrend line bounces don't get any cleaner than that. I believe RIOT is in a great place to make a breakout run if the market can hold itself together.
With the R:R being what it is, it's worth the risk to me.

RIOT :)has riot finally found its uptrend channel ??
its been in a deadly downtrend for the past little bit and after break out and consolidating has it found a channel. im thinking yes.

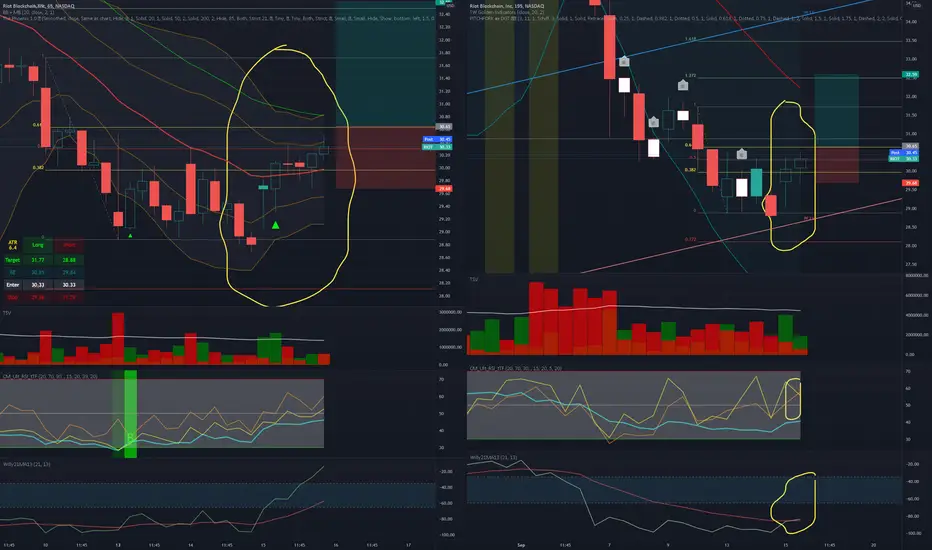
strategy for RIOT friday 09/17/2021strategy: today presents inside bar. If the opening is bullish, we would have a gap and go, we must wait for a good buy signal as follows, crossing both mv 200 5mn and 15mn, double top 30.40 plus the buy price 30.60. if we do well, we will take profits in the 31.80 area.
Our bearish entry: the action closed today near the minimum, this means intention of bearish continuity, if so, we will have a bearish gap and go. The opening must be with the break of the double bottom sell price 28.60. remember you must wait for the retest in 9mv or 10mv period

RIOT and Bitcorn.Riot in the Big Squeezy on the Hourly.
It may pop after a pull back and a HL accelerating into a HH.
Im looking for a pop above 33.65 for a run up to about.
Bitcorn on the move will pull this company up.
Namaste Traders.
RiotAs Btc is breaking the first key resiatnce of 48k. As long as it holds it as support, riot on the other hand has broken down from a potential bullish pattern we were tracking…. However. The support we have landed on has perfect confluence as a potential 3rd touch of uptrend support. This would show us 3 touches below on this uptrending support. Let’s gooo!


October and November OTM Put Options Looking Pretty Good HereI will be getting the monthly put options at strike 24 dollars from here in anticipation of a bearflag breakout as i think btc and riot will see the 200 week moving average again.
Botched trade.Well, I F'd up on this one and just gave away money. I am still convicted that the price of Riot blockchain will get to $40, but right now I am going to look at other stuff as I am just human .

Riot BLockchainThe explanation is in the chart. But I am very bullish on all bitcoin mining companies and this recent dump has provided a great buying opportunity as we have immediately have bounced back finding a great entry for not only crypto but bitcoin mining stocks.

RIOT make or break week Calls or puts depending on direction it takes this week
---> PT's both directions on chart
---> $40 key breakout level NASDAQ:RIOT

$RIOT Weekly Wyckoff Phase E IncomingRiot looks ready to enter Phase E of the wyckoff accumulation pattern on the weekly. Watching for a break over $39 and a move up to $48 in the next few weeks.
Strong rejection at $39 but holding the EMA cloud nicely.
With BTC above $52K my bias is to the upside this week.

Riot Seems to be making a double bottom here. Getting a bounce off 36$. Needs to break above 39.40 for a big move. Could be a bull flag inside this clear ascending wedge. Might be worth it to nibble here with a stop below 35.50. Just keep in mine 39.40 is huge resiatnce
Lower ascending triangle support is 33.75


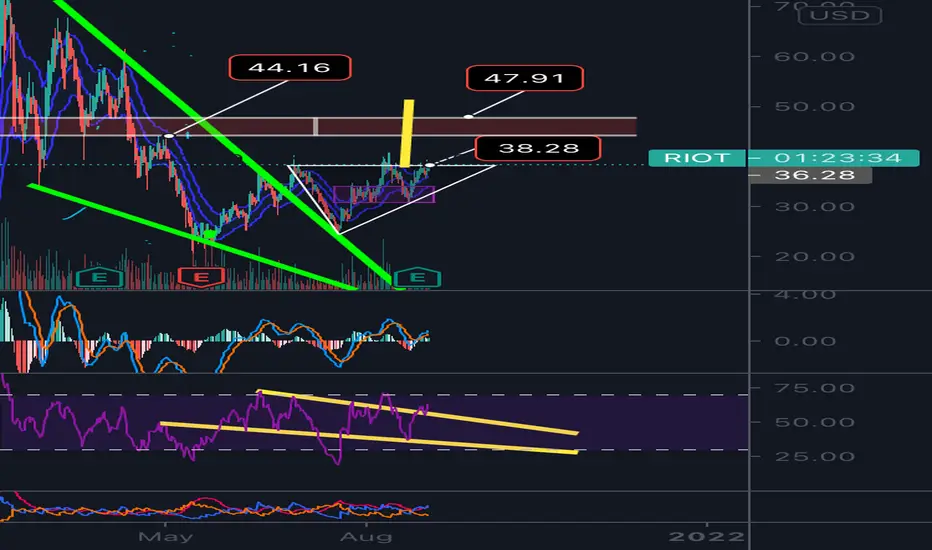
Riot This could
Be attempting to breakout here. Needs to hold support above 38.28. Very volatile, but a big move could be on the horizon… keep a close eye on RIOt as we breach the resistance of 38$ again, potentially holding support above and back testing for the first time. If we do lose support for this 38$ region, it could be another fakeout so tread cautiously however it is looking like a strong set up
Resiatnce above is marked. Target is 51$ however we Wil run until a few key areas if we do get this breakout along the way
RIOT - Looks like to broke outFollowing Bitcoin pattern.. Looking bullish.. Bitcoin poised to hit $100K+ by EOY and these miners will reap the benefit

RIOT. blockchain stock. looks ready to run.RIOT just has to clear a little bit higher then it will likely be a runaway train.
Take a look at MARA. You can see it has a really similar price story, and it is tilted slightly more upward. MARA was the definite winner between the two stocks at this stage, however, it looks like both have support from the bull community.

RIOT quick short, long term playRiot looking to swing down on the bottom of the wedge and the volume shelf. Looking to short to 32. Although, I am bullish longterm as crypto becomes the standard.
