RTX ShortShorting RTX as it has a major false breakout with a huge wick.
Price is 72.64, target is $66. Swing trade.
Looking good. May cut in half at target and let it run.
RTXD trade ideas


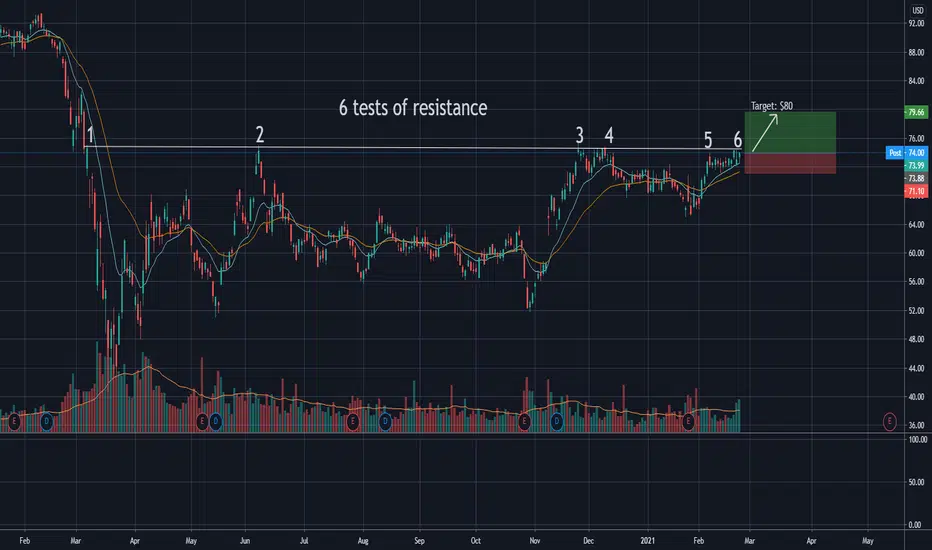
RTX 6th TEST BreakoutRTX and the aerospace industry looks bullish. The Aerospace sector wasn't hit nearly as hard today as the rest of the market and is showing upward strength. RTX has now tested resistance of the 74 level 6 times. With each test supply is getting less, and demand is growing, i believe this will breakout to the 80 area.
RAYTHEON TECHNOLOGIES CORPORATION Chart DailyHey guys, RAYTHEON TECHNOLOGIES CORPORATION is in a bullish momentum with a sort of hammer candle and a continuation of negotiated buy volume. On the TIMEFRAME M1 we notice the shape of a hammer candle with a large volume of purchase made. It goes on the base of the bollinger to go to the top of the stabilization zone in order to check it. Great potential to breakout the price with the momentum both for the zone to arrive in the second and to land on the next high.
Before the high of the bollinger will be tested then a next high to be accessed before the breakout of a stabilization zone. And an adjustment (on TIMEFRAME H4) ending in resistance (on TIMEFRAME H1) on this point for an excess in this one. With the required buying force, half of the intermediate median will be tested
Please LIKE & FOLLOW, thank you!

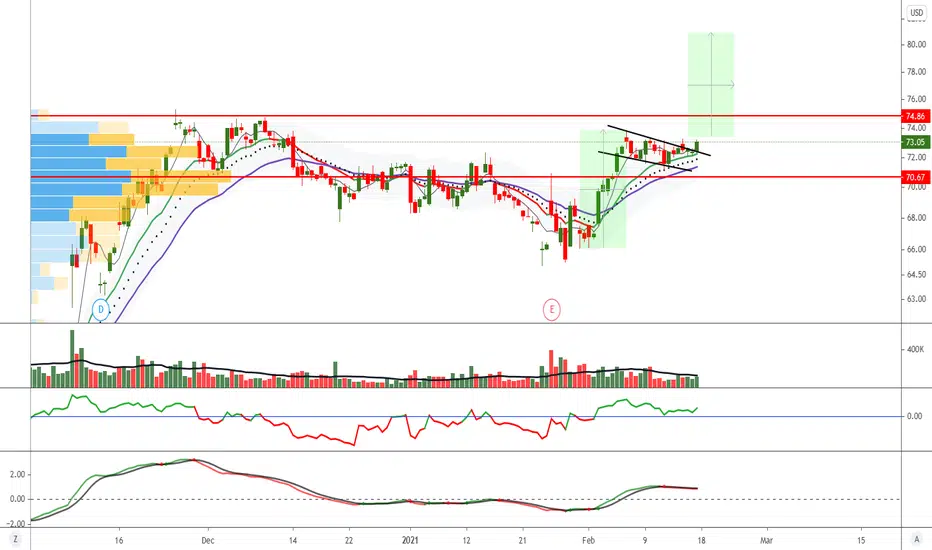

About to take flight?I have been waiting for some of the most unloved parts of the market to pick up and that includes RTX and Aerospace. A decent reversal might be setting up if todays price action is any indication of what could come in the future. Stock is still well below highs in June and I think the outlook is better now then it was then. If we can hold this support zone and break above the trendlines the stock could be heading higher toward 76. Below 64 means the play is invalid.
Not investment advice

$RTX with a slight bullish outlook following earnings releaseThe PEAD projected a slight bullish outlook for RTX after a positive over reaction following its earnings release placing the stock in drift B
If you would like to see the Drift for another stock please message us. Also click on the Like Button if this was useful and follow us or join us.


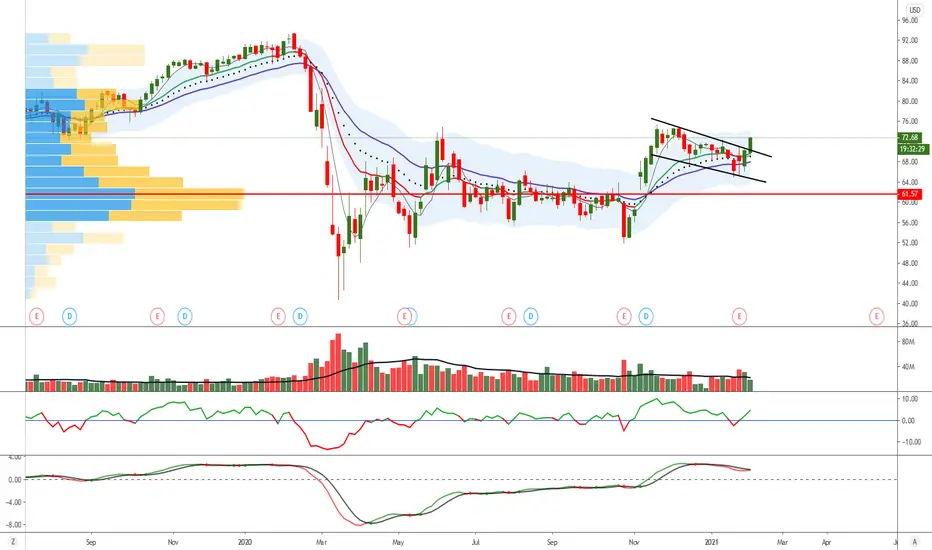
RTX Long Raytheon Tech Corp Com ( RTX ) looks to break out of a bull flag after a ABC correction. On the daily timeframe , we have a pin bar on the 50 EMA signifying a support zone . February option contracts have good Open Interest (OI) and volume . Daily squeeze with momentum curling on the daily and hourly timeframe. Look for a break of top trendline

RTX LongEMA50 cross EMA200 as Golden cross in uptrend
EMA50 as support
Resistance/support Line as support
Entry 70
stop 66
Target 80
I am not a PRO trader. I trade option to test my trading plan with small cost.
The max Risk of each plan is less than 1% of my account.
If you like this idea, please use SIM/Demo account to try it.

$RTX - Bull Flag into earnings. $90 is very close tbh...Long RTX and other industrials into earnings season.

Long | RTXNYSE:RTX
Possible Scenario: LONG
Evidence: Price action
TP1~ 75
This is my idea and could be wrong 100%.


My overview of RTX in a short-mid term viewI'm new to options and just wanted to put this out there to see if I was thinking the right way, and maybe even helping some of y'all out. Let me know what you think!!!!
(This is not any kind of financial advice.)

How To Analyze an Indicator.Several FinTwit in my network asked me how to use the Relative Strength indicator which I called PriceRatio in TradingView.
My best explanations are noted in the text box of this chart. I use this approach to analyze most indicators and stock price actions.

RTX Raytheon if Trump wins on Nov 3rdFirst idea post on here.
Lurking in the shadows for years. Stealing all of your wonderful trades.
Been accumulating Raytheon RTX Since Aug between $58 -$60
I believe a Trump win will set off a massive Rally in Defense/Military contractors
RTX has a Really nice 10+ year Channel Never Broken
Been at the Bottom of the channel since Covid
Raytheon has a massive backlog of product to ship out( including Patriot shelters, Mobilizers, EEU ect).
Defense contractors kicking production into overdrive last month to deliver backlogs
Product will start shipping over the next month leading up to the election.
Wedge is closing in leading right to the election day.
Look for entry/accumulation between $59-$62
Set tight Stop at $57.99
After take off set a trailing stop or set Fib Targets

RTX longRaytheon has bounced off of this green resistance twice and based on where the stock is relative to its RSI, it looks like there is room for more buyers to come in to push past the resistance and hopefully towards old highs. RSI is only at about 54 on the YTD chart. If it closes past this level of $74.76 at least 3 trading days in a row, the trend should hold.
The fair-value estimate for RTX is $77 so it has room to go and has not fully recovered yet on the year. Defense spending and air travel should return to normal as vaccinations become more widespread. It has underperformed the S&P 500 all year but that trend is getting tired; go long. It still has a whole lot of catching up to do.

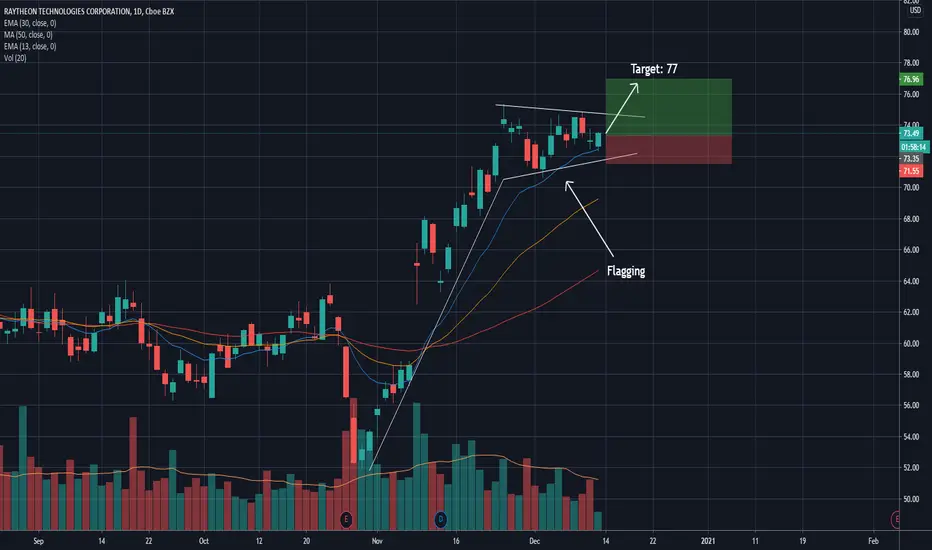
RTX FlagRTX has had a run up and then been in a consolidation pattern forming a flagging formation. Buying at the bottom of the flag pattern and looking for a breakout.
RTX breakout RTX is primed for a breakout, it has the same pattern that BA has had, this would be a good long.

2020 Actual Trade: RTX +17% Profits
RTX went up and down in sudden turns from March to July
Only stabilized period is between August and mid- September
Looking like a breakout on 09/16 where we got into RTX
But, it turned out to be wrong entry point so it suffered under-water period for about 1.5 months
Holding through this tough time knowing its volatile nature paid off a reward +17% profits in November
