Satellogic (SATL): Earth Observation Demand Drives SupportSatellogic Inc. (SATL) is a space tech company focused on Earth observation, building and operating a growing constellation of high-resolution satellites. These satellites capture detailed imagery and data, serving industries like agriculture, energy, defense, and environmental monitoring. By offeri
−1.160 USD
−103.27 M USD
11.43 M USD
About Satellogic Inc.
Sector
Industry
CEO
Emiliano Kargieman
Website
Headquarters
Davidson
Founded
2010
ISIN
ARCAVA460172
Satellogic, Inc. operates as a vertically integrated geospatial company. It is creating and continuously enhancing the first scalable, fully automated EO platform with the ability to remap the entire planet at both high-frequency and high-resolution, providing accessible and affordable solutions for customers. The company was founded by Emiliano Kargieman and Gerardo Richarte in July 2010 and is headquartered in Davidson, NC.
Related stocks

Long Trade Setup Breakdown for Satellogic Inc. (SATL) - 30-Min 📊
🔹 Asset: Satellogic Inc. (SATL)
🔹 Timeframe: 30-Min Chart
🔹 Setup Type: Symmetrical Triangle Breakout
🚀 Trade Plan (Long Position):
✅ Entry Zone: $4.54 (Breakout Confirmation)
✅ Stop-Loss (SL): $4.24 (Below Support)
🎯 Take Profit Targets (Long Trade):
📌 TP1: $4.94 (First Resistance)
📌 TP2: $5.34

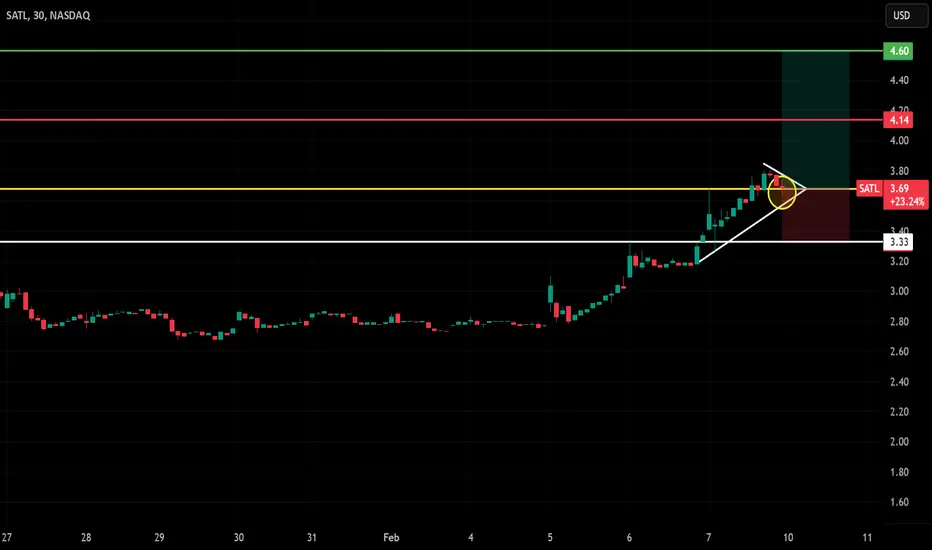
SATL (NASDAQ) - 30-Min Chart Long Trade Setup for Monday !🔥 🚀
🔍 Stock: SATL (NASDAQ)
⏳ Timeframe: 30-Min Chart
📈 Setup Type: Bullish Breakout
📍 Trade Plan:
✅ Entry Zone: Above $3.69 - $4.14 (Breakout Confirmation)
🟢 Take Profit 1 (TP1): $4.14 (First Resistance Target)
🟢 Take Profit 2 (TP2): $4.60 (Extended Bullish Target)
🚀 Stop-Loss (SL): Below $3.33 (Ke
Satellogic (SATL): Earth Imaging Demand Continues to GrowSatellogic Inc. (SATL) is a leader in Earth imaging, using a fleet of high-resolution satellites to provide real-time data for governments, businesses, and researchers. Their technology delivers detailed images that help with agriculture, environmental monitoring, and infrastructure planning. The co

SATL: Triangle Pattern - Monday’s Key Levels!📊 Description:
SATL is consolidating within a symmetrical triangle pattern, signaling a potential breakout or breakdown. Key levels to watch:
Breakout Above: $4.05 (upside potential to $5.48)
Breakdown Below: $2.50 (downside risk to $2.30)
Volume and momentum will be critical to confirm the move. M

Swing trade thisOnly if this enters into 4 would I open a long trade. I'd exit at 5.2. I estimate the trade will be about a month. Stop-loss at 3.35 though I doubt that'll be hit.

See all ideas
Summarizing what the indicators are suggesting.
Oscillators
Neutral
SellBuy
Strong sellStrong buy
Strong sellSellNeutralBuyStrong buy
Oscillators
Neutral
SellBuy
Strong sellStrong buy
Strong sellSellNeutralBuyStrong buy
Summary
Neutral
SellBuy
Strong sellStrong buy
Strong sellSellNeutralBuyStrong buy
Summary
Neutral
SellBuy
Strong sellStrong buy
Strong sellSellNeutralBuyStrong buy
Summary
Neutral
SellBuy
Strong sellStrong buy
Strong sellSellNeutralBuyStrong buy
Moving Averages
Neutral
SellBuy
Strong sellStrong buy
Strong sellSellNeutralBuyStrong buy
Moving Averages
Neutral
SellBuy
Strong sellStrong buy
Strong sellSellNeutralBuyStrong buy
Displays a symbol's price movements over previous years to identify recurring trends.
Curated watchlists where SATLD is featured.
