Satellogic (SATL): Earth Observation Demand Drives SupportSatellogic Inc. (SATL) is a space tech company focused on Earth observation, building and operating a growing constellation of high-resolution satellites. These satellites capture detailed imagery and data, serving industries like agriculture, energy, defense, and environmental monitoring. By offering cost-effective access to geospatial intelligence, Satellogic aims to make satellite data more widely available and usable for real-time global decision-making. As demand for Earth observation and analytics rises, SATL is positioned to benefit from recurring contracts and new partnerships.
The stock recently found support at the 0.50 Fibonacci retracement level and closed above the 0.236 level—placing it firmly in the momentum zone. This move, confirmed by high volume, suggests increasing buyer interest and the potential for a shift back into an uptrend as bullish momentum starts to build.
SATLD trade ideas

Long Trade Setup Breakdown for Satellogic Inc. (SATL) - 30-Min 📊
🔹 Asset: Satellogic Inc. (SATL)
🔹 Timeframe: 30-Min Chart
🔹 Setup Type: Symmetrical Triangle Breakout
🚀 Trade Plan (Long Position):
✅ Entry Zone: $4.54 (Breakout Confirmation)
✅ Stop-Loss (SL): $4.24 (Below Support)
🎯 Take Profit Targets (Long Trade):
📌 TP1: $4.94 (First Resistance)
📌 TP2: $5.34 (Extended Bullish Target)
📊 Risk-Reward Ratio Calculation:
📈 Risk (Stop-Loss Distance):
$4.54 - $4.24 = $0.30
📈 Reward to TP1:
$4.94 - $4.54 = $0.40
💰 Risk-Reward Ratio to TP1: 1:1.33
📈 Reward to TP2:
$5.34 - $4.54 = $0.80
💰 Risk-Reward Ratio to TP2: 1:2.67
🔍 Technical Analysis & Strategy:
📌 Breakout Confirmation: Strong buying momentum above $4.54 signals continuation.
📌 Pattern Formation: Symmetrical Triangle Breakout, indicating bullish movement.
📊 Key Support & Resistance Levels:
🟢 $4.24 (Strong Support / SL Level)
🟡 $4.54 (Breakout Zone / Entry)
🔴 $4.94 (First Profit Target / Resistance)
🟢 $5.34 (Final Target for Momentum Extension)
🚀 Momentum Shift Expected:
If price sustains above $4.54, it could push towards $4.94 and $5.34.
A high-volume breakout would confirm trend continuation.
🔥 Trade Execution & Risk Management:
📊 Volume Confirmation: Ensure buying volume remains strong after breakout.
📈 Trailing Stop Strategy: If price reaches TP1 ($4.94), move SL to entry ($4.54) to lock in profits.
💰 Partial Profit Booking Strategy:
✔ Take 50% profits at $4.94, let the rest run to $5.34.
✔ Adjust Stop-Loss to Break-even ($4.54) after TP1 is hit.
⚠️ Fake Breakout Risk:
If price drops below $4.54, be cautious and watch for a retest before re-entering.
🚀 Final Thoughts:
✔ Bullish Setup – If price holds above $4.54, higher targets are expected.
✔ Momentum Shift Possible – Watch for volume confirmation.
✔ Favorable Risk-Reward Ratio – 1:1.33 to TP1, 1:2.67 to TP2.
💡 Stick to the plan, manage risk, and trade smart! 🚀🏆
🔗 #StockTrading #SATL #BreakoutTrade #TechnicalAnalysis #MarketTrends #ProfittoPath

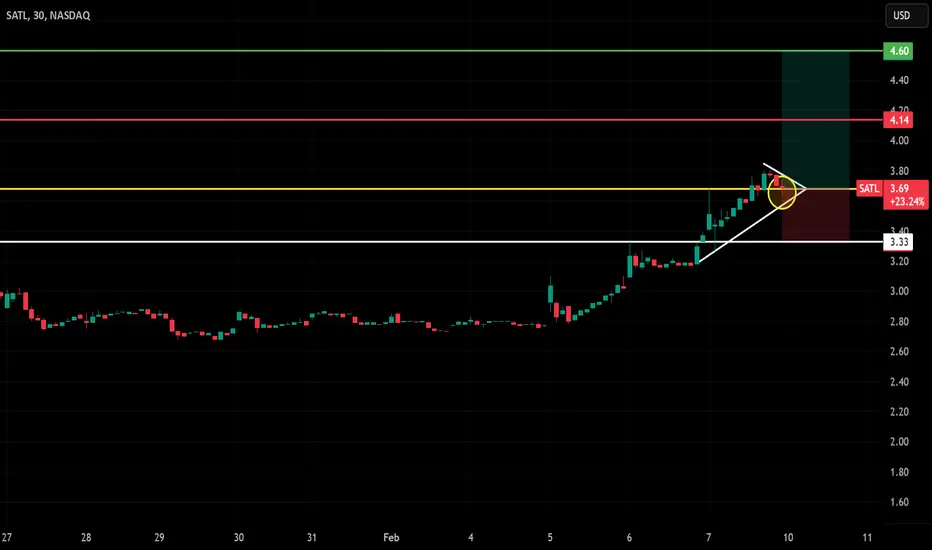
SATL (NASDAQ) - 30-Min Chart Long Trade Setup for Monday !🔥 🚀
🔍 Stock: SATL (NASDAQ)
⏳ Timeframe: 30-Min Chart
📈 Setup Type: Bullish Breakout
📍 Trade Plan:
✅ Entry Zone: Above $3.69 - $4.14 (Breakout Confirmation)
🟢 Take Profit 1 (TP1): $4.14 (First Resistance Target)
🟢 Take Profit 2 (TP2): $4.60 (Extended Bullish Target)
🚀 Stop-Loss (SL): Below $3.33 (Key Support)
📊 Risk-Reward Ratio: Favorable for a bullish continuation 🚀
🔹 Technical Analysis & Setup:
✅ Pattern: Bullish Trendline Breakout 📈
✅ Breakout Confirmation Needed: Sustained price above $3.69 with volume increase
✅ Support & Resistance Levels:
🔸 $3.69 (Breakout Zone)
🔸 $4.14 (First Major Resistance)
🔸 $4.60 (Extended Target for strong momentum)
✅ Momentum Shift Expected: A breakout above $3.69 could trigger an upside rally 🚀
🔥 Trade Strategy & Refinements:
📊 Volume Confirmation: Look for increasing buying volume above $3.69 📈
📈 Trailing Stop Strategy: Once price reaches TP1 ($4.14), adjust SL higher to secure profits 🛑
💰 Partial Profit Booking: Take partial profits at $4.14 and let the rest ride toward $4.60+ 💵
⚠️ Fake Breakout Risk: If the price fails to hold above $3.69, reconsider entry ❌
🚀 Final Thoughts:
✅ Bullish Breakout Potential – High probability of continuation higher 📈
✅ Momentum Shift Possible – A move above $4.14 could accelerate upside 🚀
✅ Strong Risk-Reward Setup – SL at $3.33, TP at $4.14 - $4.60+ for optimal gains
📊 Trade Smart & Stick to the Plan! 🏆🔥
🔗 #StockMarket #SATL #TradingSetup #TechnicalAnalysis #BreakoutTrade #DayTrading #MarketTrends #BullishSetup #ProfittoPath 🚀📈
Satellogic (SATL): Earth Imaging Demand Continues to GrowSatellogic Inc. (SATL) is a leader in Earth imaging, using a fleet of high-resolution satellites to provide real-time data for governments, businesses, and researchers. Their technology delivers detailed images that help with agriculture, environmental monitoring, and infrastructure planning. The company’s growth is fueled by increasing demand for geospatial intelligence and its ability to provide cost-effective satellite imagery.
SATL recently showed a confirmation bar with increasing volume and is finding demand at the Fibonacci 0.618 level inside the corrective zone (0.382-0.618), a key support area in uptrends. This signals strong buying interest, which could lead to further gains. A trailing stop can be set using Fibonacci levels with the Fibonacci snap tool, allowing traders to manage risk while staying in the trend. Short term targets at $3.75 and $4.41.

SATL: Triangle Pattern - Monday’s Key Levels!📊 Description:
SATL is consolidating within a symmetrical triangle pattern, signaling a potential breakout or breakdown. Key levels to watch:
Breakout Above: $4.05 (upside potential to $5.48)
Breakdown Below: $2.50 (downside risk to $2.30)
Volume and momentum will be critical to confirm the move. Monday could set the tone for the next major trend. Keep an eye on price action at the yellow support/resistance zone!
Chart Importance:** Symmetrical triangles highlight periods of consolidation, offering clear breakout or breakdown opportunities.
Conclusion:** Monday’s price action will likely determine SATL's next major trend—stay prepared for volatility! 🚀
📈 What’s your strategy for SATL? Let’s discuss below! 💬

Swing trade thisOnly if this enters into 4 would I open a long trade. I'd exit at 5.2. I estimate the trade will be about a month. Stop-loss at 3.35 though I doubt that'll be hit.
