Cup (s) and Handle Earnings 12-1/AMCThe smaller cup has formed a handle that is well defined. I do not deem to place a handle on on the larger cup as earnings are very soon and it does not appear to be well formed at this point. If you see one, label it and go for it (o: I do not like to place a handle low and then watch price go past it. Earnings a bit too close for me right now )o:
Price is over long entry level for smaller cup (purple) but not for larger cup (white). I calculated targets for smaller cup. If you are interested in the larger cup, then long entry is 429.10, or whatever you think may clear the high of 429 at the left side of the cup. You can use the depth of the cup to calculate targets and project those targets from long entry level.
Both cup lows are 184.71.
Good luck.
No recommendation
SNOW trade ideas

SNOWFLAKE ( SHORT to 300) The cup and handle is considered a bullish signal, with the right-hand side of the pattern typically experiencing lower trading volume. The pattern's formation may be as short as seven weeks or as long as 65 weeks. Right now we have the cup and the handle is yet to be formed
Conviction: break of current trend followed by a bearish engulfing weekly chart

SNOW ChartUsing Feb retracement, plotted the lines for SNOW. If the market supports, it can try low 401's post ER (within a week to 2 weeks time period).


LET IT SNOW PUTSThere is a Bearish wolfe wave setup on the Daily time frame in SNOW that provided entry opportunity on Friday Nov 19. The projected target is calculated by extending a linear line between pivot 1 and 4 and projecting the line. This is represented as the red perforated line, as shown in the chart. The projected target is 300 and then 295. The price is expected to reach these targets within 7 days. The orange wolfe wave pattern uses a different length input value and identifies price tgt up to below 300. The risk and reward for both wolfe waves are excellent.


Multi time frame analysis If snow can get through $350-360.00 Resistance it can run. Forming a nice base here on weekly

Double top on SNOW, selling time?I'd expect to see a retracement on SNOW here at this level.
Double top.
1.2 fib extension of previous wave.
hitting trend line from previous.
This is technical inspiration, always do your own due diligence, act on your own risk.
Best of luck to all.

Melting SNOWSNOW has been on a constant uptrend with average volume but momentum indicators are been moving in above average range. SNOW had a rejection at the 3.618 resistance. With the stock being overbought it looks to be due for a drop soon.
SNOW will likely fall this week, sooner rather than later; SNOW could likely retest the top of the trend line early in the session. Prices looks to test the bottom of the trend line . With a break of the trend line , will be looking for a retest of trend line and large selling volume .
A rejection at the top of channel would act as a entry point. The bottom of the channel would act as a potential exit point. If there is a breakout then will hold position until blue trend line using the top bottom of channel as stop loss


Snowflake (1D) - Time to sell the Divergence ? Hi Traders,
CHart says it all, Falling wedge pattern was followed by growth. RSI konvergence was very Reliable indicator. Now it shows we are near potential top or local top.
Enjoy the ride both ways. Always use stop-loss.

$SNOW Constructive Candle on FridayI have to saw $SNOW putting in an inside tight day right there at that level is extremely constructive.
Look at Friday's volume -75% from its 50 day MA.
That's extreme volume dry up

SNOW- Breakout - CUP with Handle- Follow through DaySNOW - Broke out the CUP with Handle pattern.
-- RH&S
-- MACD - Bullish

$SNOW Possible Head and Shoulders Continuation Base If the market doesn't go down the toilet from here, $SNOW is acting like a future leader in the next leg up.
Best case scenario it puts in the right shoulder of a small head and shoulders continuation base.
Keeping a close eye on it.


Snow breakoutSnow is making a cup and handle pattern, with the handle a nice strong bounce off of the 50 day moving average and completing a 3 white soldiers pattern to boot. It is starting to outperform the growth ETF that it is a part of and a break above 320-330 could signal a big breakout.

$SNOW - digesting levelI continue to love this stock. It is really digesting this level. Anything under $309, I will add.
Today looks like I will have the opportunity to add.
$SNOW - 330 calls > 325 | 320puts < 322$SNOW - consolidating and for lotto friday can try 330 calls > 325 | 320puts < 322 , also rememder today quad witching

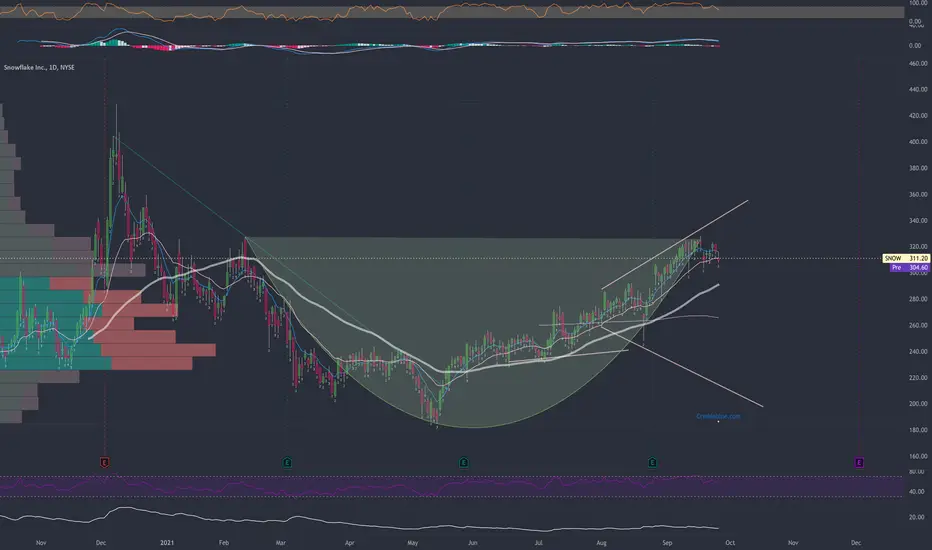
Snowflake, Inc. $SNOW reaches pattern target, partial exitSnowflake is a cloud computing-based data warehousing company based in Montana, named after the founders' love for winter sports. I like winter sports, and the ticker SNOW is aesthetically appealing in my portfolio.
The trade setup was straightforward. The company IPO'd in 2020 at $220, and after one quarter that saw investors take price up above $400 per share, all post-IPO gains were given back by mid-2021, and price got down to as low as $180.
Between March - July 2021, $SNOW formed an inverted Head and Shoulders bottom, reflected by the blue curved drawings - a left shoulder, a "head", and a right shoulder. Once price broke above the pattern boundary, I reached a measured target of $320 by applying the width of the pattern (from $180 to $250, or $70) to the breakout level of $250.
$70 + $250 = $320
This measurement criteria is based on the works of John Magee and Robert D. Edwards in Technical Analysis of Stock Trends (5th edition, 1948).
My stop-loss, the "Last Day Rule", and my limit order placement is based on teachings from my friend and active trading legend Peter L. Brandt (Diary of A Professional Commodity Trader, @PeterLBrandt).
I've now covered 3/4 of this position for a gain of 28% (70/250).
My maximum risk, assuming my stop loss order filled peacefully at its activation price was only 4% (10/250).
The risk to reward setup at the time of entry was then (4%) to 28%, or 1 to 7.
Snowflake is probably in line for further price gains, but I have no reason to believe I have an edge at these levels.


$Snow$SNOW is in the sweet spot here in my opinion. Mid-cap growth and best of breed along with recent ipo. Big volume uptick heading into a summer weekend caught my attention. This one is a favorite of both wall-street and retail. CEO is mega brilliant.

Snow updateImo this is still an (ABC) wave structure just has a minor correction instead of a deeper retrace for live earnings conference and we ended probability for an impulsive 5 wave structure by a minor wave structure interesecting 4th wave correction with wave 1 impulsive in the the probability of a 5th wave , this is my probability of how things will play out further with an ending diagonal and then a push down. But in other news we did hit the green box from my other post so if you were the swing holder you are in profit congrats : ).
As always happy trading : )

Snow wave analysisSnow has taken a fall from a ending diagonal pattern and has fallen off into a Double three as you can see I have put the retracements and extension zones and included with arrows where I think it will be further into time I hope this helps with my analysis : )
As always happy trading : )
