SPOT EARNINGS CHART - SPOTIFY TRENDS SPOT chart for earnings. IMO, it probably see a rejection around 152ish and then drops down to buy zone 1. After buy zone 1, the return takes it back around 142-147.
Due to the nature of earnings, we could potentially see the drop to 126 all within the AH
Earnings potentially takes it down all the way to 102.
It's hard to say that earnings pumps, and the reason for that is due to the tech sector. Most tech stocks heading into earnings look like a small pump, followed by a decent sized retracement.
Potentially this, it would allow for some great movements, and trade setups.
SPOT trade ideas

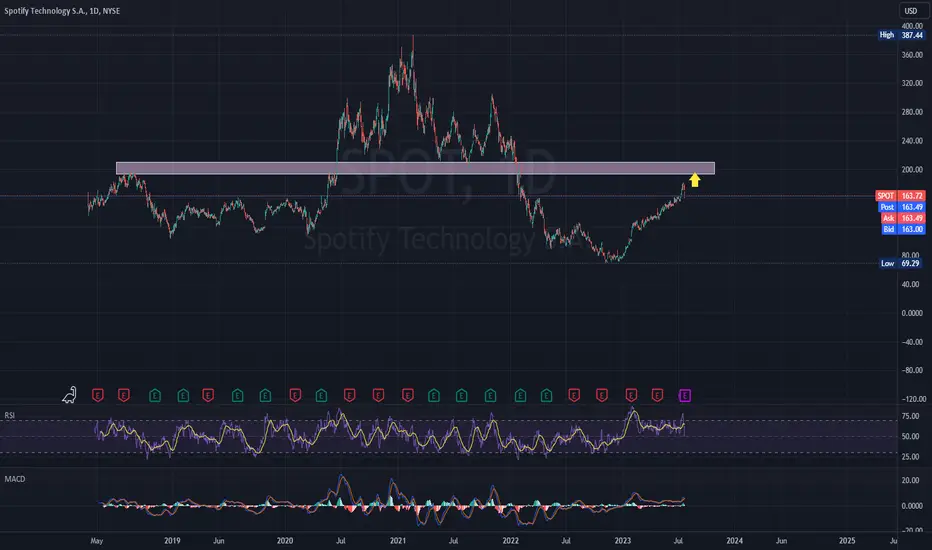
SPOTIFY: Enormous upside potential.Spotify opened on a huge price jump following the much better than expected EPS and is approaching the July 19th High (182.65). Technically it turned bullish on its 1D outlook (RSI = 65.875, MACD = 1.600, ADX = 16.057) and a new long term uptrend seems secured as yesterday's rebound started after a clear hit and bounce on the HL trendline.
Price wise it looks like the arc pattern of November 2022-January 2023, which after the Resistance break, reached as high as the 2.0 Fibonacci extension. We have every reason to expect a similar long term rise to Fib 2.0 (TP = 235.00).
## If you like our free content follow our profile to get more daily ideas. ##
## Comments and likes are greatly appreciated. ##

SPOT Spotify Technology Options Ahead of EarningsIf you haven`t sold SPOT here:
Then analyzing the options chain and the chart patterns of SPOT Spotify Technology prior to the earnings report this week,
I would consider purchasing the 155usd strike price in the money Puts with
an expiration date of 2023-11-17,
for a premium of approximately $12.70.
If these options prove to be profitable prior to the earnings release, I would sell at least half of them.
Looking forward to read your opinion about it.

Spotify looking extremely bearish and ready for a shortSpotify has put in a confirmation of an existing level as resistance once again. Along with this it is showing clear bearish divergence and and two clear bearish candlestick patterns. This is exactly what we look for when we try and take a trade.
So the trade is easy, we enter at the price today after a small retrace up, then our stop is above the level and the recent high. Why would we want to be shorting Spotify if it broke through that level anyways??

$SPOT: Deafening 160Looking at Spotify here for a potential head and shoulders-like reversal. I still think the communications sector needs to correct a bit before advancing so I think that could translate to NYSE:SPOT here.

Spotify's New AI Bet Could Be a Game Changer for PodcastingSince 2019, the world's largest audio streaming company, Spotify (SPOT 0.73%), has been pouring money into the podcasting space with hopes of diversifying its business away from purely music streaming. These investments have included acquiring podcast studios, paying for exclusive shows, and even buying entire podcast distribution platforms like Megaphone and Anchor in an effort to bolster its advertising revenue.
However, Spotify's podcast initiatives have drawn plenty of criticism from investors because the company's strategy has continuously shifted and the gross margin has remained negative across its advertising division.
But despite these lackluster results, the company continues to believe there is a large opportunity in the podcasting industry. And last week, Spotify introduced a new program that could have big implications in the long run.

Spotify Going Down in Short TermWeekly Chart of Spotify
In the past 150-55 level has acted as a strong resistance level for Spotify (March, July, December 2019 and in April 2022). Spotify has unsuccessfully tried to cross this level in September this year.
Spotify likely to go down to 140, if not more.

SPOT to dip around $135 to re-test supportSPOT has historically traded very technically. It'll break support/resistance, re-test, then continue on it's way for a while.
After our latest straight-line bull run we've effectively re-tested support, and are now hitting a new long-term resistance line. If this trend continues, we'll dip down to around $135 to the next support level.

SPOT TECH pivoting up LONGTrade idea on the the 2H chart. This is a confirmed reversal with a5 POC line
and 50% retracement in confluence for one target and the pivot high for
the second. I will play this with stock and also a put option for insurance.
90% of the money position in the stock and 10% in the put contract 10DTE.

July Trades (SPOT, account up 5.25%)11th day trade in July is NYSE:SPOT on 7/26/2023.
Account is up 5.25%.
Total return in July is 14.58%.

SPOTiFY: $110 | Bench for Blockchain Limits Bid at sub $30 at par with Audius Theta and STEPN apps or projects
note: when an item utiizes a Celebrity to push evangalize a product
you have 100 days to get out on the way up at euporia levels
easier said than done..
RESET for buy back and next Campaign


SPOT-BULLISH SCENARIOSpotify (SPOT) will announce Q2 earnings, with confirmed price hikes hitting subscription plans in various countries, including the US, UK, Spain, France, New Zealand, Hong Kong, and Peru. The ad-free premium plan will rise by $1 to $10.99, Duo plan by $2 to $14.99, family plan by $1 to $16.99, and the student plan by $1 to $5.99 per month.
Existing subscribers will have a one-month grace period before the new prices take effect. Competitors Apple Music, Amazon Music, and YouTube Music have also raised their prices. Analysts expect the price hikes to contribute to a 5% revenue bump for 2024.
Despite concerns about subscriber numbers, analysts anticipate solid Q2 earnings for Spotify, with improved profitability and a 20% increase in monthly active users year-over-year. Wall Street expects Q2 revenue of 3.21 billion euros, a loss per share of -0.66 euros, and a total of 530 million monthly active users.
Analysts have been positive about Spotify's profitability efforts, and the company's beat on gross margin expectations in the first quarter has boosted sentiment. Spotify aims for a gross margin between 30% and 35% in the long term as it scales its podcasting and ads business.
Risk Disclosure: Trading Foreign Exchange (Forex) and Contracts of Difference (CFD's) carries a high level of risk. By registering and signing up, any client affirms their understanding of their own personal accountability for all transactions performed within their account and recognizes the risks associated with trading on such markets and on such sites. Furthermore, one understands that the company carries zero influence over transactions, markets, and trading signals, therefore, cannot be held liable nor guarantee any profits or losses.
SPOT for higher targets?NYSE:SPOT seems poised for higher prices. I'm looking for an initial push towards 165 (where it may pause), then continue towards 175- 180. I may start position with at least 1 month until expiration. Have fun!!!

Sample Trades Where IPM is AppliedInverse pyramid method - a way of tranching wherein “test buy” comes first before entering a significant allocation. Then when the price comes in favor of the trader’s bias, adding positions may apply which value is bigger than the “test buy”.

Risk cancellation 1 Risk cancellation happens when you have an unrealized gain that can cover the risk you set for that particular trade.
It can also be a situation where an open position is on the winning side and just waiting for a trail stop/target profit to be executed.
In those situations, set your stops at breakeven.
Risk cancellation may give you more room to add trades/positions without adding the value at risk of your portfolio.

SPOT short position the RSI indicator is at the overbought conditions which could result in a price drop.
MACD is also showing a decreasing positive momentum and we may get a bearish cross soon.
The move seems to be a little bit overextended therefore the correction may be expected.
entry, stop loss and 2 targets are shown on the chart.

SPOTIFY still bullish for expect
Hi viewers, SPOT bullish in last periods, here technicalls are still bullish to expect
TP1:145
TP2:152

SPOTIFY ($SPOT) at MAJOR resistanceSpotify price just reached 160 usd per share, hitting 4 resistance trend lines, two major, two minor. Expecting some kind of pullback now.


Introducing The TradingView Show!Ladies and gentlemen, traders, investors, and market enthusiasts from around the world, the wait is over! We're thrilled to announce the launch of our new live show (and soon podcast) The TradingView Show! 🎙️🔴🎬
Guests of the show are experienced TradingView members and they use TradingView just like you. Our show strives to accomplish 3 important things:
1. Discuss the fascinating world of financial markets in an open format, always free, so anyone, anywhere, can become more informed.
2. Shine light on the fascinating stories, experiences, and wisdoms from fellow TradingView members including the time, patience, and hard work it takes to survive in markets.
3. Encourage new traders and investors to study, research, and learn the underlying principles of markets before risking hard earned money.
We recently finished filming our seventh episode and linked the every episode below. Each episode is filled with insights that'll help you think more deeply about markets including what it takes to be a trader or investor. Before you begin watching, please always remember our show is not advice or endorsement. Our show is focused on education, preparation, and community - be sure to follow your favorite guests!
Episode 1 - Live with @norok on trading windows, the importance of automation, and his journey in markets. Watch it here .
Episode 2 - Live with @WillSebastian on candle counting and wicks. Watch it here.
Episode 3 - Live with @EvanMedeiros on quant trading, rigorous backtesting, and finding an edge. Watch it here.
Episode 4 - Live with @TheChartGuys on new trader mistakes, lessons learned, and why you need a notepad. Watch it here.
Episode 5 - Live with @TASMarketProfile on trading in the pit, building indicators, and wisdom of the market. Watch it here.
Episode 6 - Live with @MarcPMarkets on why you should always know who you're trading against, the realities of markets, and the time it takes to master trading. Watch it here.
Episode 7 - Live with @JimHuangChicago on the crash of Silicon Valley Bank, the complexity of banking, and event driven trading strategies. Watch it here.
If you have any questions or comments, please let us know below. You can also request a guest by writing their name in the comments. We look forward to hearing your feedback!
- TradingView ❤️

A look into Spotify TechnologyHello, here is a brief personal analysis of Spotify Technology on the NYSE for the medium-long term.
With price information from April 2018, it is a fairly simplified graph, let's remember that entertainment and technology companies were one of the few areas, along with pharmaceuticals, that saw maximum peaks during the COVID pandemic, compression and distribution time has passed and we can see a bearish elliot waves completed with final impulse 5 early this 2023 so we seem to be riding at the beginning of a bullish elliot waves standing at 1 or 1/2 spotify balances this afternoon and can define quite a bit the path to follow, we find value in the medium-long term, let's hope that the days go by.
A cordial greeting to all!

Spotify - Short positionSpotify missed out on their earnings by 1.75%, this is why we are bearish. Furthermore, technical analysis also indicates a bearish sentiment as the chart forms a rising wedge.
Entry price at 140.42
Exit price at 116.56
Stop loss at 145.66
