STLA trade ideas

Stellantis N.V., week#26As long as its price close above $16.56,
it's ok to have some of its shares
But, if its price breaks $15.99, wait and see


Stellaris wait and seeBe patient
If stellantis' price reaches $15.99
We'll add some Stellantis's shares
We know stellantis is worth far more than that

BUY STLAhere is an example when both technical and fundamental analysis are really interesting.
i'm buying
:)
tell me your idea below, thanks

STELLANTIS// Cup handle formation. Resistance breakdown requiredAlthough there is a cup-handle formation on the chart, the targets are determined according to Fibonacci. Let's look for closures where I indicated with X for the formation.

STLA - Ascending triangle - Long termOn the weekly timeframe of the STLA chart, we can see an ascending triangle forming. An ascending triangle is a bullish formation.
It's interesting to watch this asset during 2023 for the price to break out of the triangle to the upside. The breakout-line is shown on the chart. When this happens the pattern gets confirmed and trade can be entered by taking a long position. This is a long-term trade.
See all further details on the chart.
Good luck!

Stellantis: combine the short and the long-term strategy!STLA:
The company is huge!
It's french-american and combines PSA (Peugeot, Citroen), Fiat, DS Automobiles, Chrysler with Jeep, Dodge, and many many others.
This company has a great future if the next generation products will arrive. Electrification will boost revenue and margins.
Short it the next weeks, you will see a correction based on no current model issues and probably less demand in China as well as supply chain issues.
But don't miss the right moment to invest after this correction ended.
- Owner earnings are >20% of current price => the company is cheap.
- Quick ratio = 0.98
- Current ratio = 1.15
- Cash change +8.5
- ROE = 0.254
- EPS 4,71
- No stock compensation -> very good value sign
- P/E = 2.8
The stock is cheap and undervalued.

Trading Idea - #StellantisMy trading idea for Stellantis : Buy / LONG
Target: USD 15.00 (+16% gain)
The carmaker formed by the merger of FCA and PSA will report its financial results on 28 July. Positive results are expected as margins have increased.
There is also a robust support line in the USD 11.00 to USD 12.00 range. This was successfully tested in July.

STLA looking weak! if it cannot break back above short trigger at 13.78 we will most likely see a test of 12.61-10.27-7.94, but a break past trend resistance/15.28 will give us a nice bull rally here.

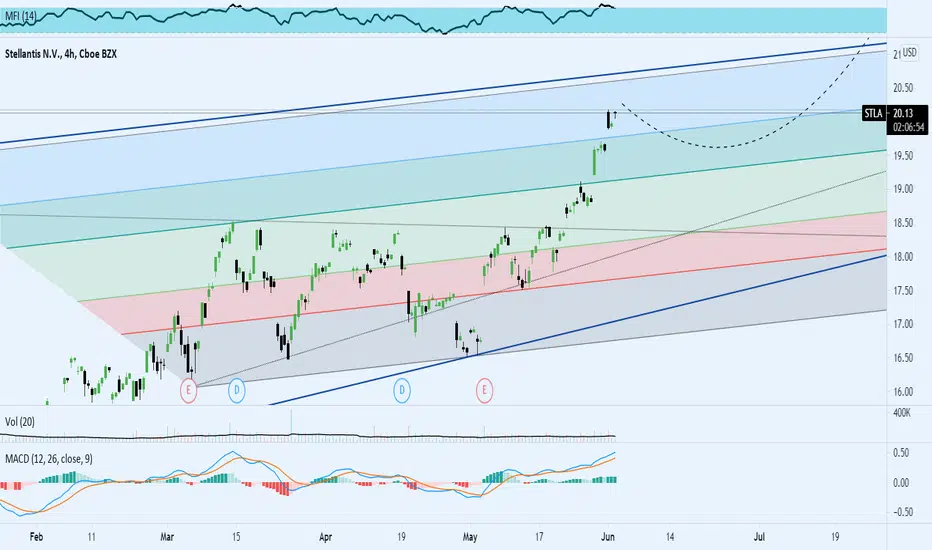
STLA about to get some love? Breakout on the HorizonMIL:STLA
A basic look at STLA is showing the MACD green and strengthening
The 12 EMA just crossed over the 26 EMA
Resistance:
20.53
20.80
21.29
21.99
Support:
18.81
18.83
17.59
17.13
Breakup Zone: 20.80-21
Breakdown Zone: 18.83-18.50
Currently at 20.29