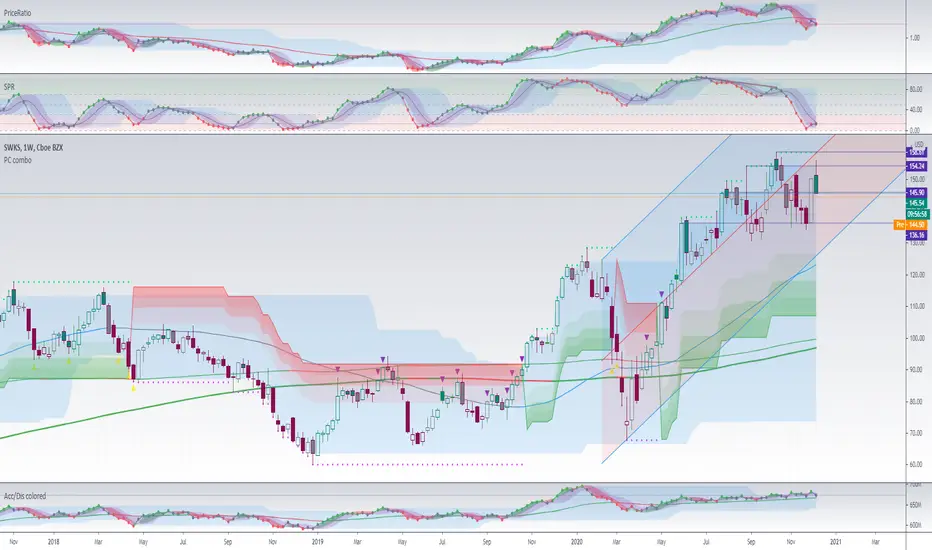
Skyworks Solutions (SWKS) | Stormy Times-Technically In The ZoneHi,
Criteria:
1. The trendline
2. Strong multi-yearly resistance becomes support
3. Fibonaccy retracement 62%
4. Round number $100
5. 50% drop from ATH
6. Some EMA's from different TFs are in the zone
Do your own research and if it matches with my TA then you are ready to go.
Regards,
Vaido
SWKS trade ideas

Skyworks Solutions approaching a key level of supportNo doubt the semiconductor sector has taken a hammering recently. Chip company Skyworks is rapidly approaching a long term support level and is this is very close to the fib golden pocket zone. Maybe a great time to buy the dip?
7/4/2022 NASDAQ (SWKS)Short (Entry Price) below the black line and exit (Stop Loss) above the red line. Can take profit at the suggested Target Price.
Entry Price: $124.20
Target Price: $122.20
Stop Loss: $127.69

Skyworks USA Sun Storm Investment Trading Desk & NexGen Wealth Management Service Present's: SSITD & NexGen Portfolio of the Week Series
Focus: Worldwide
By Sun Storm Investment Research & NexGen Wealth Management Service
A Profit & Solutions Strategy & Research
Trading | Investment | Stocks | ETF | Mutual Funds | Crypto | Bonds | Options | Dividend | Futures |
USA | Canada | UK | Germany | France | Italy | Rest of Europe | Mexico | India
Disclaimer: Sun Storm Investment and NexGen are not registered financial advisors, so please do your own research before trading & investing anything. This is information is for only research purposes not for actual trading & investing decision.
#debadipb #profitsolutions

Technical analysis (SWKS)Limit buy - 165,0$
Target - 189,60$
Risk/Reward Ratio - 3,51
Stop-loss - 158,0
Since the company was very well bought off from the support line, we expect a rise to $189.60
We enter a position at 165.0$

SWKS - Target 155 (Short)SWKS looks like it will move to 155. This is an hourly chart.
Bot Dec17 155p / Sold Nov19 152.5p for a net cost of 3.25

SWKS - massive Head & Shoulders1.5 years long Head & Shoulders pattern for Skyworks. It already made an initial breakdown from the neckline. Ideally we want to see a decline into the support area (2 RED LINES) followed by a retracement to the resistance at the neckline all within a 2-3 week timeframe before making a short entry position on the 178-185 range. Target is 116-128 area. Good Luck!

$SKWS Bull runSee the following;
2D chart for longer view.
1. doji before
2. BUY signal
3. confirmation as it climbed through EMA
4. play options towards ER or load up on stocks.

$SWKS - Skyworks Breaking out Pre-Earnings Results
Perfect breakout underway in SWKS ,
Multiple catalysts but AAPL and QCOM earnings yesterday have added furl to the move.
Support is now $195
PT's $210 & $218

$188 By Friday Based on multiple indicators it is clear that SWKS is about to fall and here they are
Guth 3x confirm: Triple sell signal
D+ Large cloud of bearish divergence indicating strong bearish strength as well as 3 sell signals
Kurotoga Cloud: Shows support at $188.75 but second level support at $184.48
My plan? SWKS is up post market according to Trading View but not my brokerage. Was hoping I could say the 1 hour or 2 hour chart show signs of a start of market pop tomorrow but both time frames show strong sell signals.
187.50 put is under my radar and I plan on purchasing at market open.
Will keep everyone posted with trade activity.
MACD also critical but I did not put that in, worth looking at.

$SWKS - broke DTbarely broke the beak. The ATR is nice and we are after earnings.
I will set alerts and update if i get in

Skyworks killed it on earning skyworks killed the earning!!
played an option call that expired after earning and sold at the highs of 20+ dollars the day after earnings
the made 20-30 dollars per iphone 12 sold so when apple said they killed the iphone 12 sales i figured skyworks would make a killing from the apple revenu alone anddddd
they printed money baby :)
sold at 4X return :))))

skyworks option call for march 26th @185 strike why i just placed these calls??
first look at my other ost i posted about them and killed the game <3 now come back to this and see what im saying :)
chip shortage being a big thing now. it wont affect this company because..... they make these chips.
i see some gainz being had in my view. they could be underpriced but i dont really care about value NOW.
what i care about is what the future value will be so like my guy says buy something worth a dollar for .66cents babyyyyy

$SWKS with a slight bearish outlook following Earnings #BeststocThe PEAD projected a slight bearish outlook for $SWKS after a positive over reaction following its earnings release placing it in drift B
If you would like to see the Drift for another stock please message us. Also click on the Like Button if this was useful and follow us or join us.
Skyworks Strong Upside MomentumSWKS Strong Upside Momentum
Technology sector and the Semiconductor industry are on a strong upwards momentum
Expecting the price to continue upwards with the current price action.
Technical Analysis:
- Price rejected by 50EMA
- Followed by a very bullish confirmation candle
- Stochastic entered the oversold zone have reversed
- Strong sign of momentum via relative strength
This is a typical textbook setup with clear higher highs and higher lows.


Cup and Handle Earnings 1-28 AMCEarnings 1-28
Divergence with RSI noted. It was a bearish divergence as price sloped up and RSI sloped down. Divergences do not always mean anything, but SWKS proceeded to pull back. Opening higher in am but chart looks as if it may have a little bit more pulling back to do.
There is also a previous ABC bullish pattern..
Doji on weekly and a green candle with a top wick but no bottom wick..as a rule a candle eventually forms a wick on top and bottom. Even a shooting star eventually forms a bottom wick after a pull back has occurred. The monthly candle is not a hammer, I do not think, because it is not near a low and SWKS is by no means at the bottom..SWKS made it's recent high via a shooting star candle and did not hold on for long.
I am sure lots sell this close to earnings perhaps and volatility often increases close to earnings. A company can beat (SWKS almost always does) and still go down...so a lot of folks do not want to be in a stock close to earnings.
Was in a rising wedge but has broken bottom trendline (148ish) and appears to have recovered..
I think this is a good company and they have little or no debt to speak of as far as I know. One of my fave stocks, but plan to see what unfolds this week..
Not a recommendation..
Mr Market plans and executes well in advance and does not behave in the same exact way twice. He (she) will try to maximize his profit at your expense. We can not really always know what is up, but he does leave subtle clues (o:

Retesting Resistance SWKS looks to retest resistance at $155 a share. Based on candlestick analysis and divergence indicated by D+ and MACD, we can expect to see SWKS hit $155 a share by Friday.

Long $SWKS (Skyworks Solutions)Beautiful channel here. Multiple tests of the upper trend line which is strong. Tailwinds of upcoming Apple iPhone sales reports. 5g is doing very well for them, who knows, maybe we get a potential buyout in future!
LONG!

Bullish TK CrossI just opened a position as there is a nice TK cross which is bullish Clous is green Welcome aboard SKYWORKS Next Stop is the SKY


Skyworks makes higher lows during its consolidation.higher lows during a consolidation after a big rally is a sign of a healthy bull!
I am buying the dip!