SWKS trade ideas


This is a follow-up to another user @vince;
His stop is very very tight and that is alright but what I see? Here is my triangle inside month “If you want to look at that you are welcome to open the chart and go to the month. Let’s talk about stop and entry points If you’re looking at Vince’s chart yeah It’s very tight to give it some room to do something. Will SWKS drop a 1.46% on Tuesday? Probably or probably not. I took that drop on 7/21 where you see that red dot line that is where I’m going to stop out to be risky choice to take but, I don’t think that Traders will go back to Friday notes and analyze the data from Fridays report.

Buy SWKS breakoutSWKS has created a double bottom and potential rev head and shoulders, it is now above the down trend line and is in a pause with a potential breakout here would offer a good buy with a low risk having stop below the consolidation pattern. Market is still over bough in my opinion as manipulation continues behind the curtain so caution on all is always critical and never risk more than 3% portfolio risk per trade in this type market


Broke outBroke out of wedge. Now forming bullish ascending triangle w/ BO at 65.19, will then go to 70

ConfirmedBroke out of falling wedge. Indicates reversal to the upside. MACD curled up. Next R1D65.17 R2W70.95 R3D72.06 R4D75.66 R5D83.56

SWKS - future is unclearTechnically this doesn't look ready to buy, below the 50-day average and it's not out of the trend line yet, but it has shown some good relative strength the last 3 days on this attempted market rally. If it is to hold the current levels, it would need to consolidate sideways for about 6 more months and if it rallies out of it vertically, it will sell off and probably turn previous resistance into support, so there will be many more opportunities to buy it low. It might turn this into a double bottom, or it might form a reverse head and shoulders pattern, or it might just continue to slide.
I believe this stock is sufficiently undervalued, but until it breaks the trend, it's bearish.

Launching from Earth back to SkyWedging down Triangle. Bullish Divergence in MFI, RSI & MACD. Bullish Crossover on MACD


BUY $SWKS at $62.12 TARGET 1 Price: 69.63 Profit: 12.1% StoBUY $SWKS at $62.12
TARGET 1 Price: 69.63 Profit: 12.1%
Stop/Trailing Stop: 59.34 Loss: 2.9%

Regular Bullish DivergenceLower Low, but Higher MFI, indicates Bears are exhausting. High possibility of trend change imo


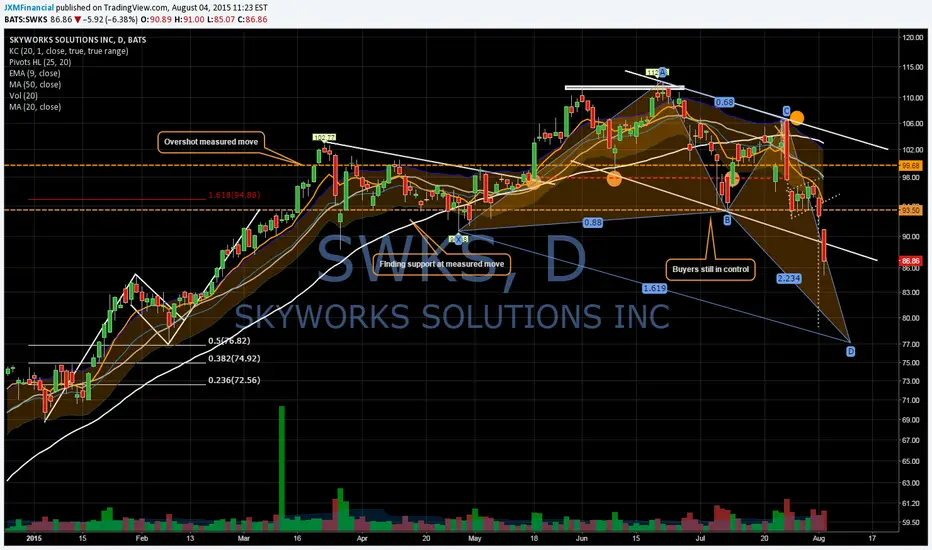
Feels like a bullish deep crabBear flag and 1.618 puts price at $77-$79. Break of 93.50 was solid r/r on short side
Re-adjusting & Adding to SWKSWell I took the majority off of GMCR looking to put that capital to work in SWKS. I like the company fundamentally, and look to add more to the position. Due to the real chance of a pullback / correction in the general market I like entering through the options market limiting my risk to the premiums. Also we have a potential bullish pinbar forming at support, and above average "buy" volume supporting the move. Along with very large Q1 Institutional accumulation of shares, I feel comfortable adding at this area.
I will keep any followers posted on progress for the remainder of the trading day today. As I will be looking at the final hour of trading to enter into the position.
Do note that this is more of an investment for me so any short term volatility will not shake me out of the position, and as long as the stock stays above the D1 200 Moving Average then I'm holding, and hedging the positions accordingly.

Strong breakout on heavy volumeSWKS is working its way above advanced pivots at 100.43, 97.41 and 96.99 within a 2nd stage flat base. It is presently making a run at the classic pivot of 102.77. Support may come in off the 50dma, the recent low of 95.91 (both the 10 and 21emas are currently at this level) or 92.33 as a stronger zone of support.
The RS line is breaking out to new highs as ahead of price. This indicates that SWKS is currently a leading stock.
Learn more at chartyourtrade.com

SWKS strong move BreakoutLong calls on this stock part of the tech play with APPLE, nice move and could start moving the equal drive it had prior to this long flag pattern so ride this until it stops

Skywalking to new highs w a close above 102.77Ignore the badly drawn cloud. I was bored :)
Premise:
I wanted to get into $GILD last week and it looks too exteneded today. So I found this $SWKS chart and it could make a similar move.
Breaking the trendline on a close above 99, making higher lows on the daily chart. Front running a breakout above of the March 23rd high at 102.77 MACD is trying to go higher. RSI trending higher. You don't need anything else to convince you a low risk long.
I bought a JULY 105 Call for $4.07 w 60 days til expiration (market maker was nice I put in a 4.20 limit offer)
Stop loss to get out with a close below 96.00 on the underlying price or a 30 day time stop which ever happens first.
Target is $106.72 on the underlying. It is the 1272 fib extension of the 3/23 swing high to 3/26 swing low.
Happy Monday.

Skyworks Nears Flat Base entry at 102.87SWKS has been one of the strongest stocks in the market over the last year.
It has also been so consistent and not choppy.
I like the company and its in a valid base, which I believe is a stage 2 flat base since the Oct low.
Industry group rank =10
On the other side of the coin, it has 0 Qtrs of EPS acceleration...
Still almost every other light is green, except 3yr sales growth =22% which is red.
Skyworks Solutions Inc (SWKS)NASDAQ
05/04/2015 (Market Close)
Print
IBD Stock Checkup for SWKS:
99
Copyright 2015 Investor's Business Daily, Inc
About SWKS: MANUFACTURES ANALOG/MIXED-SIGNAL ICS, AMPLIFIERS, ATTENUATORS, DETECTORS, DIODES, COUPLERS, MIXERS AND DEMODULATORS
General Market Fundamental Checklist Technical Checklist View Chart
Rate A Stock:
PERFORMANCE WITHIN GROUP (SWKS)
SKYWORKS SOLUTIONS INC RANK WITHIN THE ELEC-SEMICONDUCTOR MFG GROUP (42 STOCKS)
Composite Rating 99 Rank within Group: 1st
100%
Best in Group
EPS Rating 98 Rank within Group: 1st
100%
Best in Group
Relative Strength Rating 98 Rank within Group: 1st
100%
Best in Group
SMR Rating A Rank within Group: 1st
100%
Best in Group
Acc/Dist. Rating B- Rank within Group: 13th
71%
SMR - Group Leaders
SWKS
Skyworks Solutions Inc (Added to My Stock Lists 04/15/15)
TSM
Taiwan Semiconductor Adr
MU
Micron Technology Inc
TSEM
Tower Semiconductor Ltd
LLTC
Linear Technology Corp
Composite Rating 99
GENERAL MARKET AND INDUSTRY GROUP (SWKS)
General Market
Uptrend under pressure
Industry Group
Industry Group Rank (1 to 197) 10
FUNDAMENTAL PERFORMANCE (SWKS)
Current Earnings
EPS Due Date 07/15/2015
EPS Rating 98
EPS % Chg (Last Qtr) 85%
Last 3 Qtrs Avg EPS Growth 82%
# Qtrs of EPS Acceleration 0
EPS Est % Chg (Current Qtr) 50%
Estimate Revisions
Last Quarter % Earnings Surprise 1.8%
Annual Earnings
3 Yr EPS Growth Rate 30%
Consecutive Yrs of Annual EPS Growth 4
EPS Est % Chg for Current Year 55%
Sales, Margin, ROE
SMR Rating A
Sales % Chg (Last Qtr) 58%
3 Yr Sales Growth Rate 22%
Annual Pre-Tax Margin 30.0%
Annual ROE 26.9%
Debt/Equity Ratio 0%
TECHNICAL PERFORMANCE (SWKS)
Price And Volume
Price $99.11
RS Rating 98
% Off 52 Week High -4%
Price vs. 50-Day Moving Average 4%
50-Day Average Volume 4,824,300
Supply And Demand
Market Capitalization $18.9 B
Accumulation/Distribution Rating B-
Up/Down Volume 1.3
% Change In Funds Owning Stock 7%
Qtrs Of Increasing Fund Ownership 5

SKWS Harsh Decline may lead to possible quick correctionRemember it is important to wait for the next candle to confirm. This is a bullish Hammer after a downtrend from a harsh pullback in asian chip stocks this week. Although Vortex indicator has confirmed a larger bearish move is still likely, as there is no confirmation that this decline is over, it is very possible that speculators will continue to aggressively buy this dip pushing the price back towards $100.
Tomorrow Bullish scenario: (move towards $96.71), if SKWS opens above this may act as support
Tomorrow Bearish scenario: (move towards $89.92) 50 Day EMA may provide signifcant support if further declines
With a PE of about $33, skyworks is currently overvalued, HOWEVER, SWKS is projected to have a YoY growth rate of 50% in the period ending 12/31/2015. That would merit, if PEG = 1 at that future date, a possible stock value of $164. DISCLOSURE: i OWN SHARES OF SWKS
