Potential Long Breakout for $T using our B.I.T.S Indicator We have found a great looking potential Long Breakout for $T (At&T) using our B.I.T.S Indicator for TradingView.
The signal is above long term resistance with fresh air until $43.
Long Entry at $39.74 with tight Stop of $39.09 with intial targt of $41. all these are printed on the chart automatically by our B.I.T.S indicator suite when a signal is formed. This will be a stocks swing trading opportunity for the week or so if we get the trigger.
T trade ideas


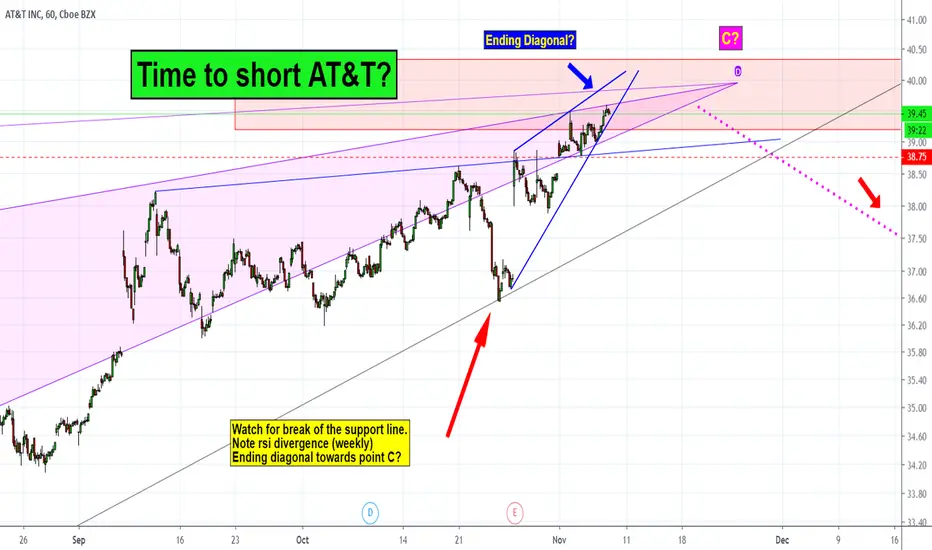
T- getting close to our short sell?AT&T (T) looks to be forming an ending diagonal as shown with the blue lines. this hourly chart is very zoomed in from previously posted weekly charts.
However this could be a nice setup to go short or buy puts on T. Remember from previous posts about our harmonics and channel lines giving us a high probability trade set up. If this works out as the top, then target lows should be hit 1 st quarter 2020.
Please enjoy
T - SHORT SETUPAT HISTORICAL RESISTANCE. SHOWING BEARISH DIVERGENCE ON BOTH OSCILLATORS ON DAILY TF. PRETTY LOW RISK SET UP FOR A SHORT HERE.

T - DAILY CHARTHi, today we are going to talk about GOOGLE
We observe a D1, some important points. The details are highlighted above.
Thank you for reading and leave your comments if you like.
Join the Traders Heaven today, for more exclusive contents!
Link bellow!
Disclaimer: All content of Golden Dragon has only educational and informational purposes, and never should use it as financial advice

T - Getting close to a short target? Possible 5-0 Harmonic?We've had a very nice run up from the buy signal at the Dec 2018 lows! Look at buy signal on the long term 35 year buy line (green).
Wait- a huge 56% profit (+ dividends) in 11 months on a boring dividend paying stock?
You bet! The mood has changed from a pessimistic panic sell last year to a bullish outlook with most traders now. Sentiment has now swung to the very bullish side... maybe it's time to look at locking in our profits soon...
A quick look at the weekly chart shows that we are now getting near $40 ... the completion of a 161.8% extension from the low last December 2018. The Harmonic 5-0 pattern may be at play here. As we chart this recent candle, it is only 2 trading days old this week, but... we may have the doji pattern form by Friday close... lets see. We are now reaching the red sell zone as shown.
Also note the divergence on rsi for the weekly chart (not shown), it may be setting up a short term top.
We should watch the upward slope black trendline for a break.
This Could be a great short sell. In fact, the Long term puts for June and Sept 2020 are pretty cheap right now. We would expect to hit the lower 50% targets in the 1st quarter 2020 and sell for a profit then... just wanna buy plenty of time to be safe.
If we can pick off this top, and it proves to be a 5-0 pattern, that would indicate a nice 50% pullback is due soon. This would allow us to take our profits and buy more shares in the green zone shown and compound our T investment for the next move up again!
It is very nice to know that we have the 35 year long term support under us (green buy line) and the recent strong move up this year should be the beginning lift off for many years to come. It looks like AT&T has finally broken out of the boring 20 year long sideways (looser) move since 1998 highs.
Remember the harmonic pattern shown is just the correction we expect in a bigger long term bullish pattern.
Although the pattern shows a 50% pullback due soon, it is a Bullish 5-0 pattern for the long term.
Please note that the chart shown uses log and dividend adjusted settings.... the best way to measure performance of high dividend paying stocks.


AT&T SHORT IDEAI f the 50 movingavarage cant sopt the loss, Ithink it will be continue to go down. The weekly candle maybe sing the turn

$T Activist Investors Boost AT&T stock.Possible trade entry on a break from current consolidation phase, $39 is a definitive break level.
Indicators are bullish and have plenty of upside potential
Elliot Management's $3.2 billion stake in T has created somewhat of a frenzy and in particular the very bullish outlook and restructuring plans which they have identified.
Investors seemingly are glad to jump on board with the plans, which they see could boost the share price by 65%.
P/E ratio 16.16 very reasonable, and holds further value.


AT&T bearish Gartley short tradeThere is a bearish Gartley forming on AT&T. If taking the trade, you might want to look for bearish divergence forming on the RSI/MACD for additional confirmation. The risk/reward ratio is 3.24.

T divergence in MFI and priceShows that there is divergence in between MFI and pricing where there seems to be an outflow of cash while price in a weak fashion tries to go higher. Looking for a option short within 1 month period for expected retracement at the least.

AT&T Beginning to see NYSE:T is attempting to break out of a longer term downtrend. I have a bullish bias above 32

Elliott Wave Theory and Fibonacci This chart correponds to the example commented in our educational article "Elliott Wave Theory and Fibonacci ."

$T - breaking out after long downtrend: AT&TInverse head and shoulders. I think this is the break out. I have been patiently waiting for entry and now i'm long.

