TGS (TGS Ltd.) – Breakout Play with Strong Upside Potential🚀 Trade Idea: TGS (TGS Ltd.) – Breakout Play with Strong Upside Potential
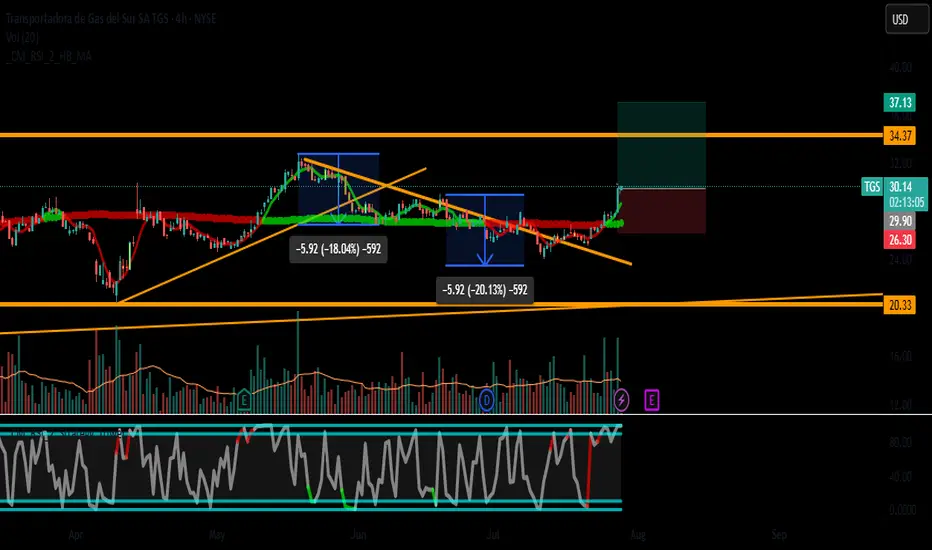
📈 Entry: $29.90 (Breakout above resistance)
🛑 Stop Loss: $26.30 (Below key support & SMA-50)
🎯 Take Profit: $37.13 (~24% upside, near next resistance zone)
📊 Risk-Reward Ratio: 1:3 (Favorable setup)
🔍 Analysis Breakdown
📊 Technical Setup
Trend: Daily trend is consolidating, but 4H/1H show bullish momentum.
Key Levels:
Support: $26.30 (SMA-50 & recent swing low).
Resistance: $30 (psychological level, previous highs).
Indicators:
MACD (4H): Bullish crossover, supporting upside.
RSI (Daily): ~65 (neutral, no overbought signal yet).
Volume: Increasing on upward moves (confirms interest).
💰 Fundamental Backing
Strong Revenue & Earnings Growth (See previous analysis).
Undervalued Metrics (P/B, P/S) suggest room for expansion.
Low Debt (Score: 10/10) reduces downside risk.
🎯 Why This Trade?
✅ Breakout Play: A close above $30 confirms bullish continuation.
✅ Strong Fundamentals: Earnings growth supports higher valuation.
✅ Low-Risk Entry: Tight stop below support.
⚠️ Key Risks:
Failure to hold $30 could lead to retest of $26.30.
Market-wide pullback could delay momentum.
📉 Trade Management
Add-on: Consider scaling in above $31.50 (confirmation of trend).
Trailing Stop: Move SL to $28.50 after hitting $33.
📌 Final Thought: TGS has strong upside potential if it breaks $30. The 1:3 R/R makes this a high-conviction trade.
👨💻 Let me know your thoughts in the comments!
#TGS #Breakout #Stocks #Trading #Investing
Disclaimer: Not financial advice. Do your own research before trading.
TGSDB trade ideas
Good setup!Poor earnings but good technical setup. So this is less favorable
Reasoning
Drop down to 2 hour timeframe and you will see that Elliott wave is done
This stock has bad earnings so that is a minus
4D RSI is testing moving average support
Great relative strength
My Would Be Trade Plan
- Risk about 1.5ATR and aim to ride up to 4.5ATR (1:3)
- Raise stop once Trade moves 2ATR in your direction
- Add on new highs after a pullback. (Then raise stop to keep original risk and also do not modify the target price)
Main Sources of My Knowledge
Mark Minervini
Constance Brown
William O'neil
Speakers on Trader Lion Youtube
Adam Khoo
My Indicators
14 Period RSI.
9SMA and 45EMA Moving Averages added
Composite by Constance Brown
This is for catching failures in the RSI.
The RSI is a bounded indicator so sometimes fails to catch divergences. This indicator helps show that
Composite Settings
Author : Constance Brown (Connie Brown)
RSI Length : 14
RSI Momentum Length : 9
SMA Length : 3
Fast Simple Moving Average : 13
Slow Exponential Moving Average : 33

**On Watch** undervalued w/ ER this week while setting up for a technical breakout. watch for confirmation over 6.65 before going long.

TGSTGS al igual que todas las demás, hizo piso en los 3.75usd y podría ir a buscarlos de nuevo, MACD y RSI con divergencias alcistas. Koncorde dando compra aun que muy volátil. La señal de entrada al papel seria el quiebre de la WMA21 para arriba.

TGS Semanal$TGS Semanal, esta en un soporte que fue techo o piso en varias oportunidades de la historia del papel, debería ser solido, peeeeeero ....

BreakoutOn Gap-up this morning. Lots of bullish activity on multiple time frames for this chart. MACD crossing waterline on daily, signal cross on weekly, SP crossing 50 DMA on daily. PT
Also, undervalued by 25% and 3* on M*.


TGS - Cruce de CanalesImportante cruce de canales de corto y largo plazo, papel para trading en diferentes zonas y canales muy redituables, en canal de corto plazo bajista.

Touched the 0.618 and quickly bouncedI think this stock is among the most interesting in Argentina.
In spite of the economic crisis now, it's one of the few that keeps its fundamentals almost the same.
MACD still not there.
All MA over our heads, so we have a nice path until strong resistances.
However, it's definetely a nice area to buy.
Looked how it held there not so long ago.


TGS Short due to MERVAL idx correction- RSI falling below 70 after descending peaks
-MACD crossing
-MERVAL correcting due to large overbuy
-take signal at crossing with EMA20
-targets using fibo after EMA20 break


pennies to thousands oil and gas playabove daily and weekly cloud
get our book on cloud importance on amazon same name
macd crossing
relative strength good
money flow growing
cci and percent r at top

TGSThis stock is already a pleasure. breakout of ascending wedge will be bullish.
Target 2.40, 2nd target 2.80

