Toyota about to bounce off trending supportToyota has been trading in a channel, potentially rising wedge. It sits in a strong industry with Tesla currently bringing up technicals for a lot of autos. It is currently at $125 and will hit resistance around $136 if it stays in the channel. On the downside, $120 looks like an area of support and an indication that our trade is not functioning the way we planned. With an upside of ~8% and a downside around ~4%, this could be a decent trade to the long side.
TMD trade ideas

Let's Check in on the Toyota FlagToyota, much like many stocks and indices around the world, has an all too familiar flag formation off the March lows. Toyota's is very clean in structure, with two distinct "humps" inside of it. I very much expect this to break down.
In the first crash, it broke a long-term trend line (red) that dates back about eight years. That will be easily broken again soon.
Beneath that (below) it has an even longer-term trend line support (blue) going back to the 1980s. If the markets totally fall apart, I expect we can eventually find support at those levels.


My Analyses On Toyota MotorFriends, please support my Free works by Following and Clicking LIKE Button .
Feel free to post your thoughts and charts here in comments, I'd love to see it.

Continual Weakness at ToyotaAll attempts at breaking out of crash pattern have failed; in all likelihood the bottom will be retested as support.

TM Toyota MotorBased on Technical analysis, it seems that for a short term investment there is possibility to go long (Option A).
Wait if the dotted amber line will work as resistance or not to decide if keep going long or short (Option B).
Theoretically, due to the Virus the market should be very slow or perhaps it will move sideways for the next months.

RANGE BROKEN - BEARISH - TOYOTA MOTOR CORP - 30MN - MY IDEASAfter a long period ranging between the two blue lines (support/resistance), we are observing a break out in the downside.
The history of the market tells us that it has several times tried to revert with very strong volumes. ALL FAILED!
Until we had the confirmation of the downside trend.
What to look up next:
Check the volumes and see if it helps the market to revert the trend otherwise there is a high probability for the market to keep decreasing even if the slope have flatten a bit.

Toyota - starting to trace primary wave 3 downToyota seems to have finished primary corrective weave 2 up and is now tracing primary wave 3 down. If this is the case, prices should decrease below 108.00. If prices crosses up 130, this analysis should be reviewed. FOLLOW SKYLINEPRO TO GET UPDATES.


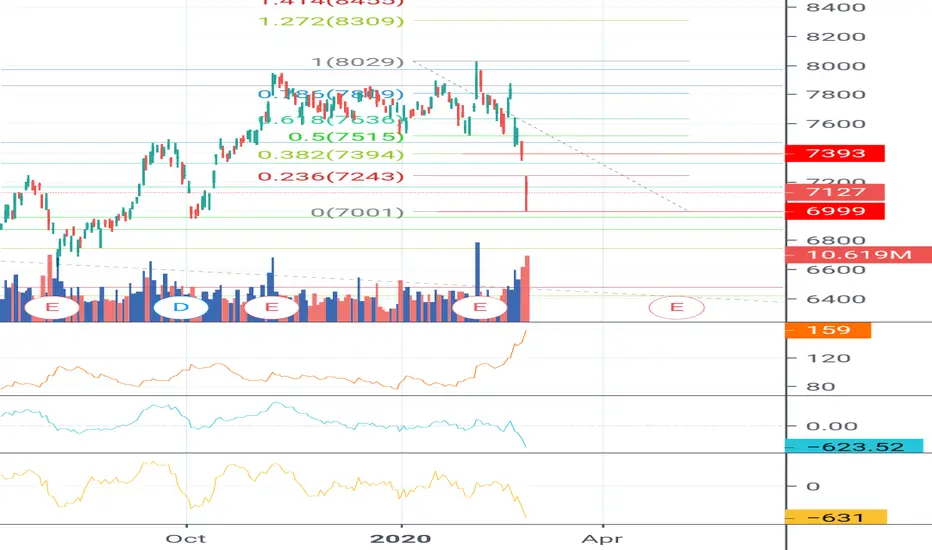
TYT still bullishToyota never broke its long term bullish trend line, we might see 7750 before a consolidation and an eventual bullish break out


TOYOTA MOTOR CORPTOYOTA is on BULLISH TREND, BUY opportunity
Holding a long term Trend line as a STRONG SUPPORT

TOYOTA MOTOR CORP MAY KEEP GROWING!
two false breakouts of a major trendline with a higher low formation on Toyota!
it is a good bullish sign to consider and based on that I expect the stock to keep growing to higher levels.
the first key level is 7200
the second key level is 7800
have a great weekend!


Toyota buy setup1. Toyota Motor Corp.’s credit rating was upgraded to AAA by Japan’s Rating and Investment Information Inc., making it the only company in the country to have the highest rating, as well as the sole domestic issuer ranked above the sovereign.
2.This stock is currently in a strong rally towards the upside, its easy to see even with the naked eye. We have a powerful bullish motive wave making a 5 wave swing with an extended 3rd wave. Looking to buy the dips is a good chess move.
Thanks A Million Times
&
Trade With Care

Elliott wave count suggest that the stock currently is in a flatBased on my daily chart analysis earlier on, it concurs to me that the weekly support the bullish run beyond 8000 yen, but not for long. Based on the wave analysis, the flat corrective wave is still currently forming the B wave of the Primary phase. Based on further analysis, the wave on the smaller scale within the regular flat is forming an expanded flat, therefore price above 8000 may signal a bearish 5 wave down reversal.

Toyota is strong as their supraToyota had a strong up move out of the falling wedge yesterday and we expect the stock to move beyond 8000yen within this few periods.
A detailed wave analysis will be published on a separate note.


