TMUS watch $227.03-227.69: Key support zone to end downtrend? TMUS has dropped a lot from its ATH a few months ago.
Currently testing a key support zone at $227.03-227.69
Look for a clean bounce to signal end of the downtrend.
0.28 USD
10.07 B USD
72.30 B USD
About T-Mobile US, Inc.
Sector
Industry
CEO
G. Michael Sievert
Website
Headquarters
Bellevue
Founded
1994
ISIN
AR0964115726
FIGI
BBG01MDJTK71
T-Mobile US, Inc. engages in the provision of wireless communications services under the T-Mobile and MetroPCS brands. It offers postpaid and prepaid wireless voice, messaging and data services, and wholesale wireless services. The company was founded in 1994 and is headquartered in Bellevue, WA.
Related stocks

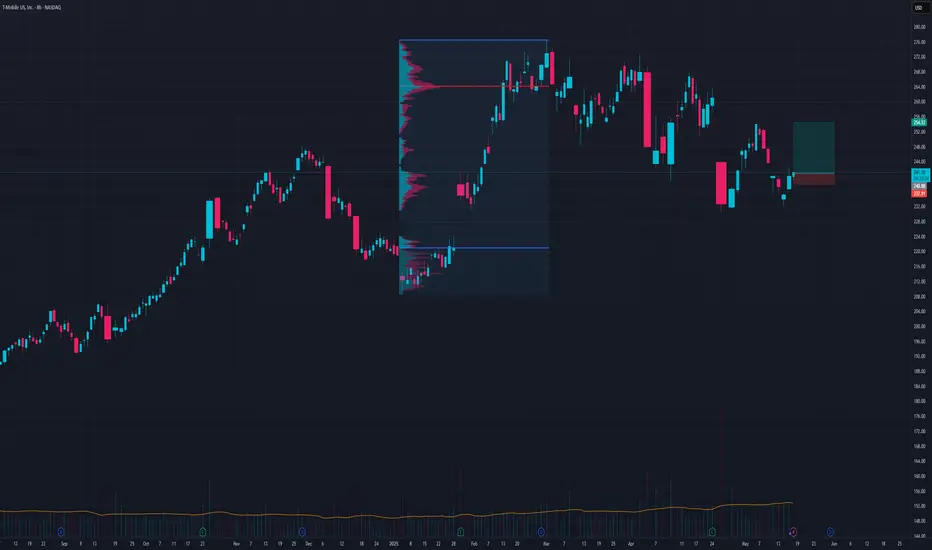
TMUS shortT mobile run seems to been exhausted and setting up. Weekly and Daily setup so anticipate a lot of head spin but on my radar. For now short seems to be my bias. 242.25 shows to be POC before 220 target of max pain. 218-209 is the area of interest for base bullish harmonic.
My View On Longing the $NASDAQ:TMUS NASDAQ:TMUS
always increase the 20% share equity at the best time, when it is cheap.

TMUS Long HereContinuation here into POC
Great risk to reward with this stop loss
SL 238
TP1 254
TP2 262
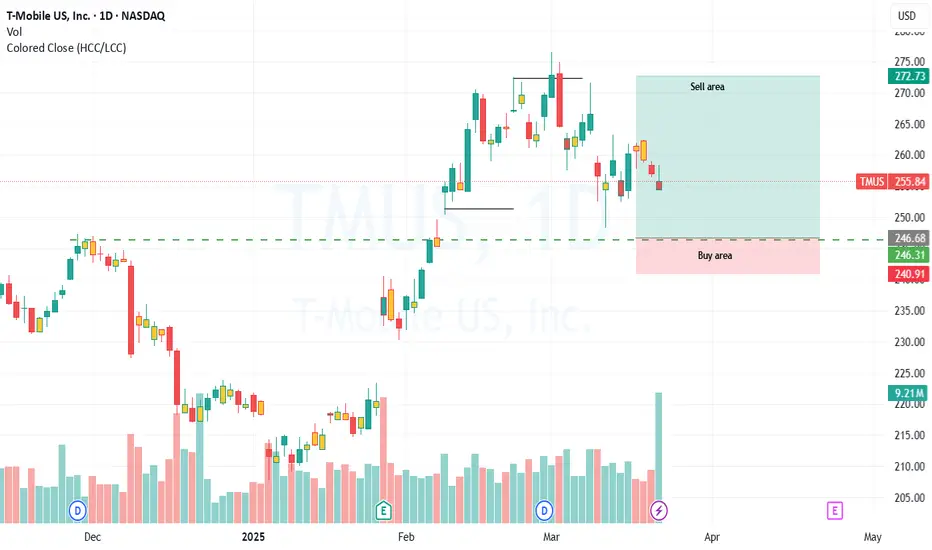
TMUS eyes on $248: Key Support for next leg of Recovery Wave TMTMUS has got trashed on last Earnings Report.
Recovery wave is dancing on a support zone.
Good spot for longs with Stop loss just below.
$ 247.73-248.13 is the exact zone of interest.
$ 243.99 below will be first support if dips.
$ 265.63-266.41 will be major target above.
========================

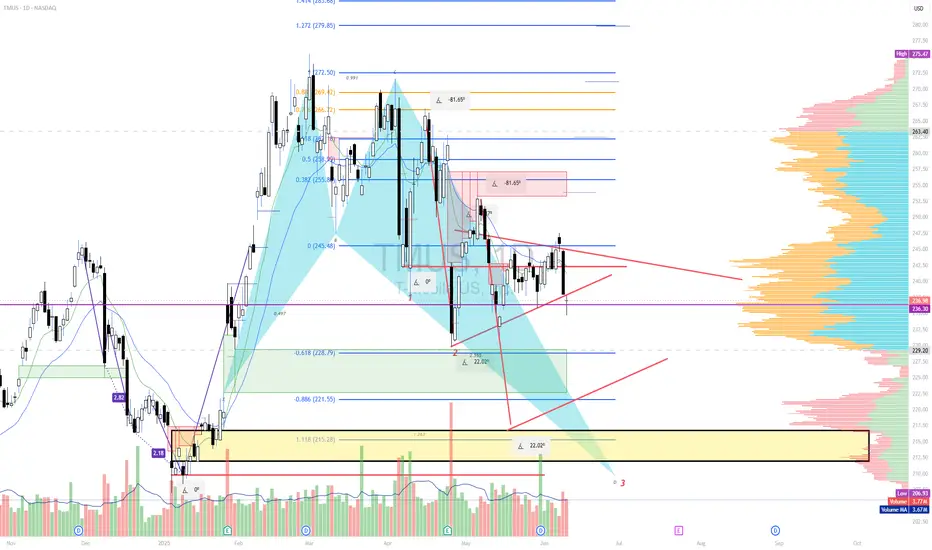
T-MOBILE stock Chart Fibonacci Analysis 043025Trading Idea
1) Find a FIBO slingshot
2) Check FIBO 61.80% level
3) Entry Point > 240/61.80%
Chart time frame: C
A) 15 min(1W-3M)
B) 1 hr(3M-6M)
C) 4 hr(6M-1year)
D) 1 day(1-3years)
Stock progress: A
A) Keep rising over 61.80% resistance
B) 61.80% resistance
C) 61.80% support
D) Hit the bottom

Same pattern, same swing, bearish to 240sWith every indicator screaming for a retrace and the pullback having started, the question is whether the area is in the 240s, which is highly likely; however, continue to watch for any jumps in between.

TMUS - Increased Probability of AppreciationThe alignment and compression of FiboNuvens providing support to the candles indicate an increased probability of appreciation, at least toward the first target. Upon reaching this target, with the stop-loss moved to the entry position, we can attempt to reach the final target. This strategy should

still looking for buy opportunity in week 2 at 240sAlerted to the buy zone last week, waiting for this area before going long based on various indicators and chart patterns combined.
T-Mobile due for correctionThere's so much speculation around Ai and Tech that a lot of people have gotten on board T-Mobile as a stop buying option. With that said it's been so fomo powered I can see a pullback coinciding with the Ides of March. Let's see.

See all ideas
Summarizing what the indicators are suggesting.
Oscillators
Neutral
SellBuy
Strong sellStrong buy
Strong sellSellNeutralBuyStrong buy
Oscillators
Neutral
SellBuy
Strong sellStrong buy
Strong sellSellNeutralBuyStrong buy
Summary
Neutral
SellBuy
Strong sellStrong buy
Strong sellSellNeutralBuyStrong buy
Summary
Neutral
SellBuy
Strong sellStrong buy
Strong sellSellNeutralBuyStrong buy
Summary
Neutral
SellBuy
Strong sellStrong buy
Strong sellSellNeutralBuyStrong buy
Moving Averages
Neutral
SellBuy
Strong sellStrong buy
Strong sellSellNeutralBuyStrong buy
Moving Averages
Neutral
SellBuy
Strong sellStrong buy
Strong sellSellNeutralBuyStrong buy
TMUS5049937
T-Mobile USA, Inc. 3.3% 15-FEB-2051Yield to maturity
7.00%
Maturity date
Feb 15, 2051
TMUS5435679
T-Mobile USA, Inc. 3.4% 15-OCT-2052Yield to maturity
6.97%
Maturity date
Oct 15, 2052
TMUS5194656
T-Mobile USA, Inc. 3.6% 15-NOV-2060Yield to maturity
6.95%
Maturity date
Nov 15, 2060
US85207UAK1
T-MOBILE US 18/26Yield to maturity
6.57%
Maturity date
Mar 1, 2026
TMUS5049934
T-Mobile USA, Inc. 3.0% 15-FEB-2041Yield to maturity
6.52%
Maturity date
Feb 15, 2041
TMUS4973557
T-Mobile USA, Inc. 4.5% 15-APR-2050Yield to maturity
6.40%
Maturity date
Apr 15, 2050
TMUS5900487
T-Mobile USA, Inc. 5.25% 15-JUN-2055Yield to maturity
6.19%
Maturity date
Jun 15, 2055
TMUS5731959
T-Mobile USA, Inc. 5.5% 15-JAN-2055Yield to maturity
6.07%
Maturity date
Jan 15, 2055
TMUS5475071
T-Mobile USA, Inc. 5.8% 15-SEP-2062Yield to maturity
6.03%
Maturity date
Sep 15, 2062
TMUS5475070
T-Mobile USA, Inc. 5.65% 15-JAN-2053Yield to maturity
6.03%
Maturity date
Jan 15, 2053
TMUS5584909
T-Mobile USA, Inc. 5.75% 15-JAN-2054Yield to maturity
5.99%
Maturity date
Jan 15, 2054
See all TMUSD bonds
Curated watchlists where TMUSD is featured.

