TSLAB trade ideas
Tesla (TSLA) – VolanX Forecast: The Calm Before the Storm?📊 Tesla (TSLA) – VolanX Forecast: The Calm Before the Storm?
Wave structure analysis + liquidity map + roadmap to $513
🧩 The Story So Far – Compressed Potential
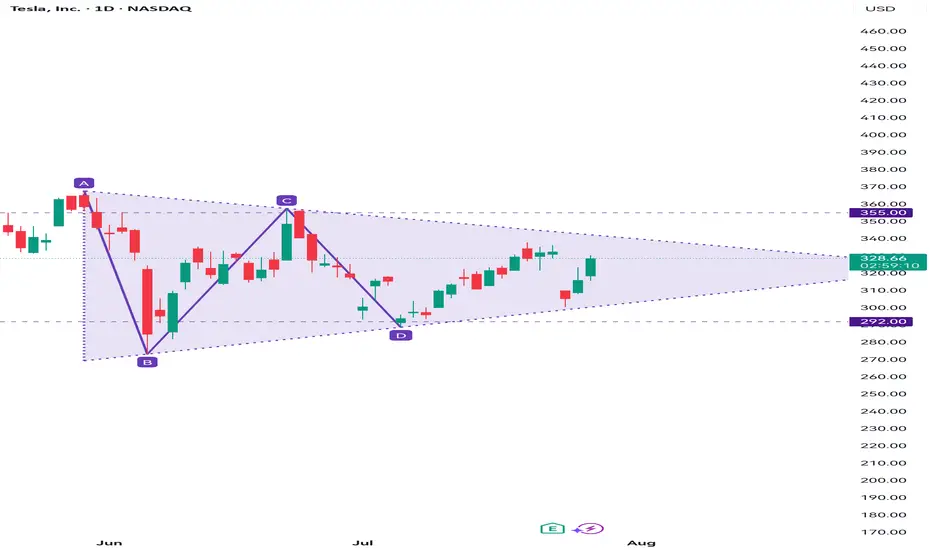
Tesla has spent the past three months inside a contracting triangle (ABCDE) — a classic Elliott Wave corrective pattern that signals energy compression before expansion. From the May high (Wave (1)), price has been coiling within tightening range boundaries, forming lower highs and higher lows. The triangle culminates with leg (E), now hovering near support.
🟠 VolanX flags this as a terminal wedge—an area where institutions test both sides of the book, hunting liquidity.
🌀 Wave Forecast – Impulse Awakening
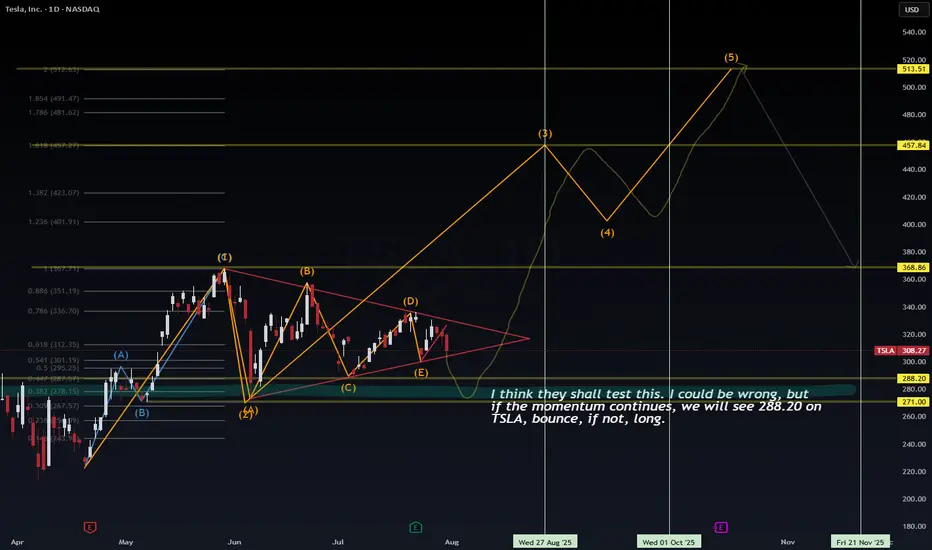
If the triangle completes as expected, we enter Wave (3)—typically the most explosive wave in Elliott sequences.
Here's how the projected roadmap unfolds:
Wave (2) ends around $288.20–$271.00 (key demand/liquidity zone)
Wave (3) initiates from this springboard, aiming toward:
📈 1.0 Fib Extension at $367.71
📈 1.618 Extension at $457.84
Consolidation expected at that level forms Wave (4)
Final thrust into Wave (5) targets $513.51, aligning with extended Fib projection and historical order block
This sequence respects classical Elliott impulse structure: 5-wave motive into macro target zone.
🧪 Timing & Liquidity – Watch the Clock, Watch the Flow
🗓 Key Windows from chart verticals:
Aug 27–Sep 1, 2025: Liquidity test at $288.20 zone
Oct 1–15, 2025: Expansion toward Wave (3)
By mid-November 2025: Completion of Wave (5) → exhaustion at $513 zone before probable macro retracement
🔍 Liquidity Zones:
$288.20 – Institutional reaccumulation level (VolanX confirms large resting bids)
$271.00 – Final sweep zone. Break below would invalidate bullish count
Above, $336.70–$351.19 is the first liquidity magnet
Major stops above $457.84, then final cluster $513.51
🧠 VolanX Opinion – AI View on Risk & Opportunity
VolanX signals high-probability breakout setup, with confluence across:
Liquidity clusters
Fibonacci symmetry
Elliott sequencing
Gamma positioning (institutional hedging tilts long below $290)
📈 Current predictive bias: 68% probability of breakout from triangle resolving bullishly, conditional on $288 support holding.
If tested and respected, AI favors aggressive repositioning in long gamma, echoing historical TSLA breakout behavior.
📌 Strategy Summary:
“I think they shall test this… I could be wrong. But if momentum holds, $288.20 bounce is likely. If not, wait for structure to rebuild before long.”
🧭 Trade Setup (Not Financial Advice):
Watch zone: $288–271
Confirmation: Strong rejection wick + volume delta flip
Stop: Below $267.57
Targets: $367.71 → $457.84 → $513.51
🔻 Risk comes from invalidation below $271.
⚡ Reward stems from recognizing compression before expansion.
#TSLA #VolanX #ElliottWave #LiquiditySweep #WaveAnalysis #FibonacciLevels #SmartMoney #OptionsFlow #TeslaForecast #AITrading #WaverVanir
Tesla - A story of an underdogSeveral of the Mag 7 are getting over heated, so I like to look at the ones that haven't caught up.
Since I don't have a crystal ball, I must consider the bearish and bullish scenarios.
As an investor I must pivot accordingly as one of these scenarios gets invalidated.
So on my charts you'll always see both scenarios. Today I'm leaning towards the bull.
Tesla just needs a narrative shift (ie -new invention etc), & price action changes in a heart beat.
Yet, price action really has less to do with the news making Elon a hero, then a villain and then back and forth...but moreso to do with price action patterns that just keep repeating.
So if we don't get a dead cat bounce, I believe Tesla could eventually head towards it's ATH, if this bull market continues.
TSLA Rejection at Supply! Breakdown & Options Outlook. Jul 30🔍 Technical Analysis (1H Chart)
TSLA failed to hold above the mid-supply zone around 330–335, rejecting cleanly after forming what looks like a double top on the 1-hour chart — a bearish reversal pattern. Price has since made a CHoCH (Change of Character), confirming shift in market structure from bullish to short-term bearish.
We now see price hovering just above 320, which aligns with GEX and SMC support zones. Volume on the rejection candle was higher than average, confirming strong selling pressure.
A bearish BOS (Break of Structure) also aligns with the double top, adding conviction that bulls are weakening.
🧠 GEX & Options Sentiment (Options GEX Chart)
* Highest Gamma Wall (Call Resistance): 338.48
* Current Price: 325.78
* Gamma Weak Zone: 325–335
* PUT Wall (Support): 300
* IVX avg: 51.5 (neutral/low vol), IVR: 6.2
* Call/Put Sentiment: Balanced — Calls: 49.5%
GEX sentiment shows TSLA is pinned in a gamma transition zone, stuck between heavy resistance above and decent put support near 300–310. That’s your battlefield.
🎯 Trading Scenarios (1H View – Swing)
Bearish Setup
* Entry: Below 319 confirmation
* Target 1: 310
* Target 2: 300 (GEX put support)
* Stop: 326 (above CHoCH zone)
* Bias: 🔻 Until demand zone or reclaim of 330
Bullish Reclaim Scenario
* Entry: Above 330 with volume
* Target: 338 then 345
* Stop: 324
⚡ 15 Min Intraday Scalping Outlook
* Bias: Bearish unless reclaim 326+ with strong volume
* Expect short-term bounces off 315 or 310 for scalp CALLs
* VWAP resistance will be key intraday
* Keep an eye on MACD crossover + OB (Order Block) entries on micro pullbacks
🎯 Suggested Options Play
For Bearish Move (if 319 breaks):
* 🛑 Buy TSLA Aug 2 PUT 320 or 315
* 🎯 Target IV expansion near 305
* Tight stop — re-evaluate above 326
For Bounce from 310–315 Zone:
* 🎯 Buy TSLA Aug 2 CALL 320 if strong reversal + OB entry
* Scale out near 325–328
* Risk defined: below 310
🔚 Summary
TSLA shows weakness after forming a double top and CHoCH at the 330–335 level. Gamma levels suggest pressure toward 310–300 unless bulls defend fast. Watch the reaction at 319–320 for short entry, or at 310–315 for scalping bounce setups.
Disclaimer: This analysis is for educational purposes only. Always do your own research and manage risk accordingly.
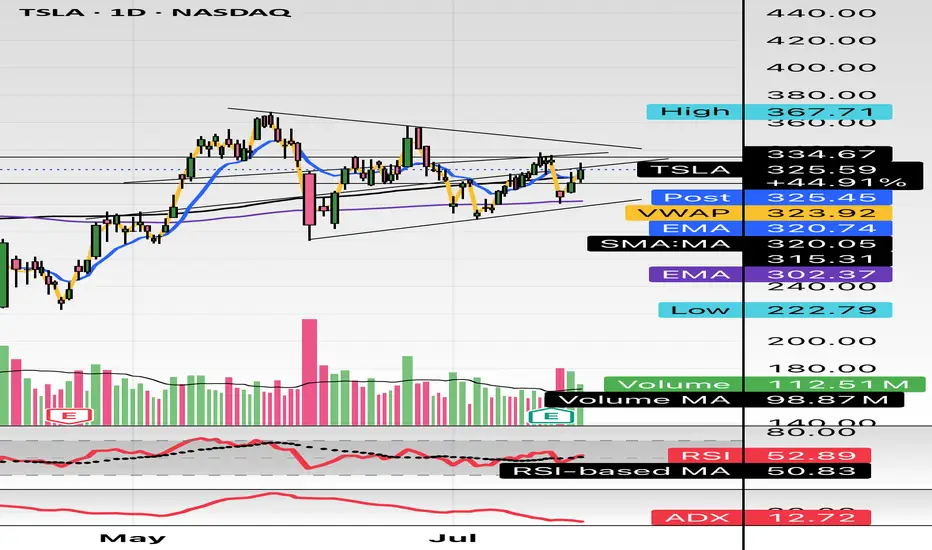
Tesla (TSLA) | Short-Term Compression, Long-Term ExTesla’s daily chart is coiled, with price currently trading at $316, sitting along the 200-day moving average. This looks like a consolidation phase with significant moves building up.
Price Action Snapshot
TSLA sold off last week, rejecting the $335 resistance level before finding footing around $300. The previous range of $280 and $365 is now tightening.
Immediate resistance sits at $335 with a clean breakout above that zone likely triggering momentum back toward the upper range of $365.
The recent drop does not seem like a capitulation move; it's likely institutional redistribution. Smart money is repositioning, not exiting.
Market Is Focused on the Wrong Data
Tesla’s Q2 earnings were objectively weak. Revenue fell 12%, deliveries dropped, and operating margins got clipped.
But this correction isn't all about fundamentals. It is about the market adjusting to a company evolving beyond traditional valuation models.
While most investors are trying to value Tesla like a car company, it’s spending this entire phase retooling itself into an AI and autonomy-first enterprise. That transition doesn't show up in EPS yet (but it will).
The Bigger Picture is Being Missed
The robotaxi rollout in Austin is live. Expansion into California, Phoenix, and Florida is on the roadmap.
Tesla is building a vertically integrated, owner-driven ride-hailing model that could eventually bypass both Uber and legacy OEMs entirely.
Optimus is no longer a lab prototype—it’s moving toward scalable production by 2026.
If Tesla even partially succeeds in general-purpose robotics, it will unlock a Technology Acceptance Model (TAM) that dwarfs the current EV narrative .
Daily Technical Outlook
We’re currently in a bullish compression, with higher lows forming against the resistance area of $365. If $280 holds and the price continues to grind within this wedge, it sets up a volatility breakout scenario.
The breakout level to watch is $335. A daily close above that reopens $365. And beyond that, the resistance level is at $426.
My View
Tesla is compressing, both in price and narrative.
The long game is quietly coming into focus, where the risk/reward skews asymmetrically in favor of the upside.
This daily compression won’t last forever, and when it resolves, the move will likely be outsized.
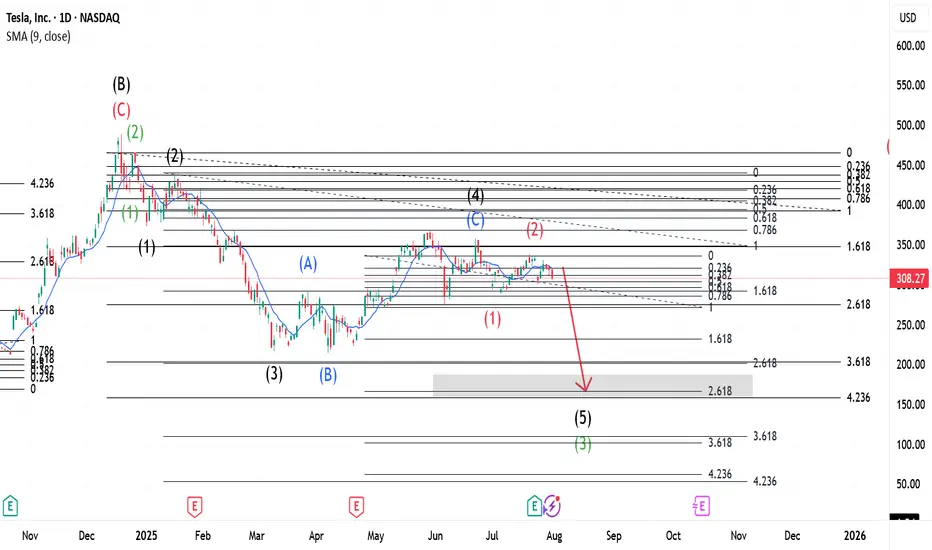
$TSLA ~ Elliott Wave Updates.This whole wave is Wave C(Black) that started when Wave B(Black) was completed. This Wave C(Black) expresses itself in 5 main waves shown in Green. Wave 2(Green) was a Zigzag and a Flat should be expected for 4(Green). Meanwhile, Wave 3(Green) expresses itself in a 5 wave move shown in Black- with Wave 2(Black) being a Zigzag, our 4 was a Flat. This Flat is shown as Blue ABC. When Wave 4(Black) completed, our Wave 5 began which upon completion, would be Wave 3(Green) of the main wave. Wave 2(Red) is a Flat and a Zigzag should be expected after 3(Red).
Go to for more information of the same.
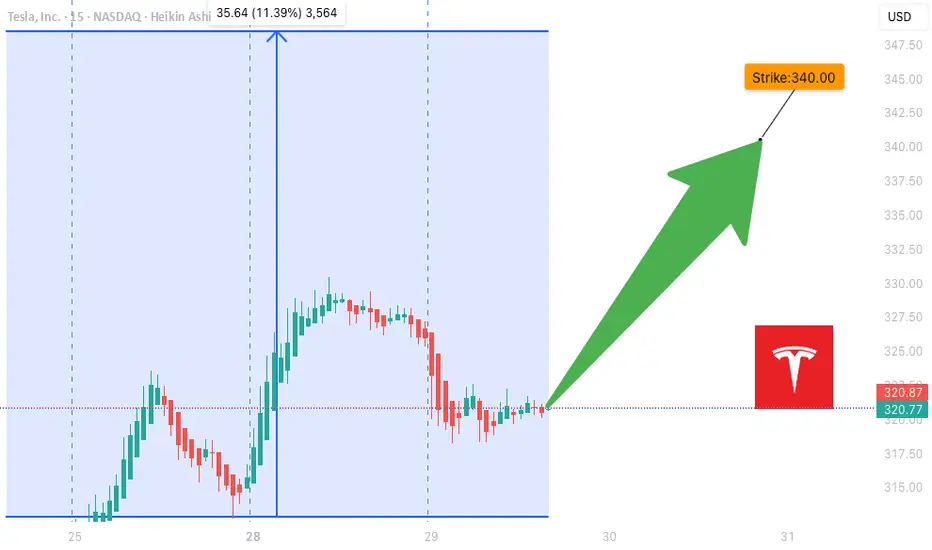
SLA Moderate Bullish Setup – Weekly Play for 08/01 Expiry
## ⚡ TSLA Moderate Bullish Setup – Weekly Play for 08/01 Expiry
🎯 *"Volume confirms it. RSI supports it. Time to strike—or stand by."*
---
### 🔍 Market Intelligence Snapshot:
📊 **Consensus**: Moderately Bullish
📈 **Weekly RSI**: Rising
📉 **Daily RSI**: Still Neutral (momentum building)
📉 **VIX**: Low → Great environment for call buying
📦 **Volume**: Strong institutional activity across models
---
### ✅ Recommended Trade Setup:
**TSLA \$340 CALL (Exp: Aug 1)**
💰 *Entry*: \~\$0.88
📈 *Target*: \$1.38
🛑 *Stop*: \$0.35
📆 *DTE*: 3 Days
🎯 *Entry*: Market Open
⚖️ *Confidence*: 65%
---
### 🔧 Model Blended Strategy Notes:
* Meta & Anthropic: Suggest ATM/ITM (\$327.50–\$330) → safer, higher cost
* Google & xAI: Prefer \$340–\$342.50 for a better risk/reward
* DeepSeek: Targets \$320 but with heavier premium
🧠 *Takeaway*: \$340 offers a balanced shot — affordable, but still responsive to upside flow.
---
### ⚠️ Risk Notes:
* ⏳ Time Decay → Quick exits = better outcomes
* 📰 External news or earnings reactions = watch for sudden volatility
* 🎯 Position size = keep light due to only 3 DTE
---
### 📊 TRADE SNAPSHOT (JSON):
```json
{
"instrument": "TSLA",
"direction": "call",
"strike": 340.0,
"expiry": "2025-08-01",
"confidence": 0.65,
"profit_target": 1.38,
"stop_loss": 0.35,
"size": 1,
"entry_price": 0.88,
"entry_timing": "open",
"signal_publish_time": "2025-07-29 10:16:14 UTC-04:00"
}
```
---
### 🧠 Quick Captions for Social:
* “TSLA bulls waking up? \$340C looks lit for the week 📈🔥”
* “Call volume surging. RSI rising. Low VIX. This \ NASDAQ:TSLA 340C might run 💥”
* “Risk-managed breakout shot — in and out fast 🎯”
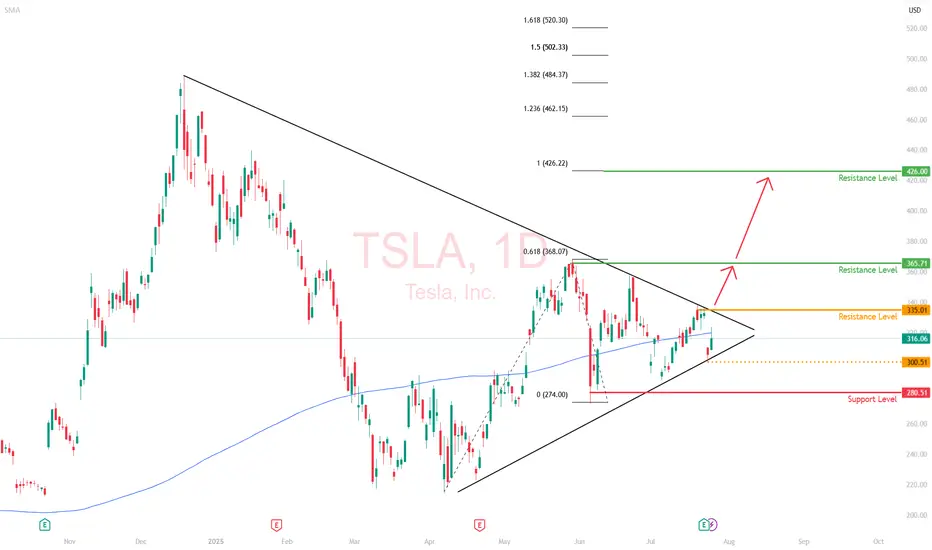
Unpack the Range, How to buy TeslaHello, I’m The Cafe Trader.
As part of our MAG 7 series, I’m going to show you how to find good pricing on TSLA for your long-term portfolio.
There’s a lot of hype surrounding Tesla right now — and for good reason. From a long-term investment standpoint, the future looks promising. But we still want to enter at the right price.
In my previous article, I gave TSLA a strong buy at $210–$220, and there were multiple opportunities in that range. But that was a few months ago. Let’s take a look at what the charts are telling us today.
⸻
🔲 In the Middle of a Big Range
With a range from $212 to $488, Tesla offers plenty of opportunity for traders — but for investors, it can stir up anxiety.
If you’re holding shares around $330+ and considering selling just to break even, here are three reasons you may want to reconsider:
⸻
1. 🚀 Future Prospects
Tesla is packed with upcoming catalysts:
• Grok AI release
• The highly anticipated Model Q
• Megapack energy storage scaling on an industrial level
These innovations, along with strong brand momentum, could drive the stock 2x, 3x, even 5x over the next few years.
⸻
2. 📈 Trending Up
While some may argue we’re forming a double top, a deeper look at the weekly or monthly chart shows no real signs of weakness. If you’re investing — not just trading — you need that longer-term perspective.
Tesla remains in an uptrend with healthy structure and plenty of strength in the larger timeframes.
⸻
3. 🛡️ Learn to Hedge Your Position
Even if we see 20–30% downside from supply zones, there are ways to protect yourself.
Hedging with options — such as buying puts — can reduce downside risk without selling your shares. If done correctly, you can turn a large drawdown into a smaller loss or even a profit on the hedge.
⚠️ Only do this if you understand how options pricing and time decay work.
⸻
🧠 Passive vs. Aggressive Sellers
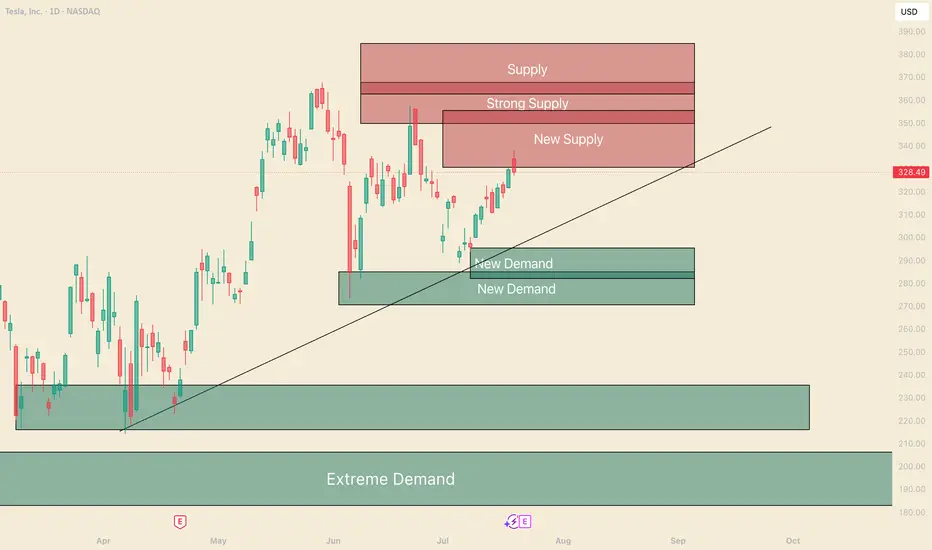
Today (July 21st), TSLA tapped into a supply zone and rejected quickly — a sign that sellers are still active around $330, while buyers lack confidence to push through.
🔹 Passive Selling
These are quiet, standing orders — often from large sellers who don’t want to move the market. They sell gradually to avoid spooking buyers.
🔹 Aggressive Selling
This is intentional unloading — where sellers push to exit their position quickly, even at the cost of driving the stock down.
What we saw today looked like passive selling — I’ll cover this in more detail in my short-term TSLA article.
⸻
📊 My Buy Zones for TSLA
Fair Price: $296–$310
• $296 is the top of recent buying liquidity
• $310 is the bottom of the current uptrend
• This is where aggressive buyers may show up if sellers ease off
Good Price: $270–$284
• $284 is a strong support level where reinforced buyers have stepped in
• This has been a hot zone and a likely area for long entries to return
Steal Price: $220–$235
• Not marked on the chart, but this zone is high-demand territory
• Even with bad press or short-term issues, this would be a great long-term value buy
⸻
That's All for TSLA Long Term. Follow and stay tuned for a short term analysis.
@thecafetrader
CUP AND HANDLE $TSLA TO $515 MINIMUMThe cup and handle is a bullish chart pattern commonly used by traders to spot potential buying opportunities. It features a rounded "cup" formation followed by a slight downward drift forming the "handle." This pattern typically signals a continuation of an upward trend once the handle completes its consolidation phase.
ROBOTAXI BOOM
BUY NOW NASDAQ:TSLL NASDAQ:TSLA

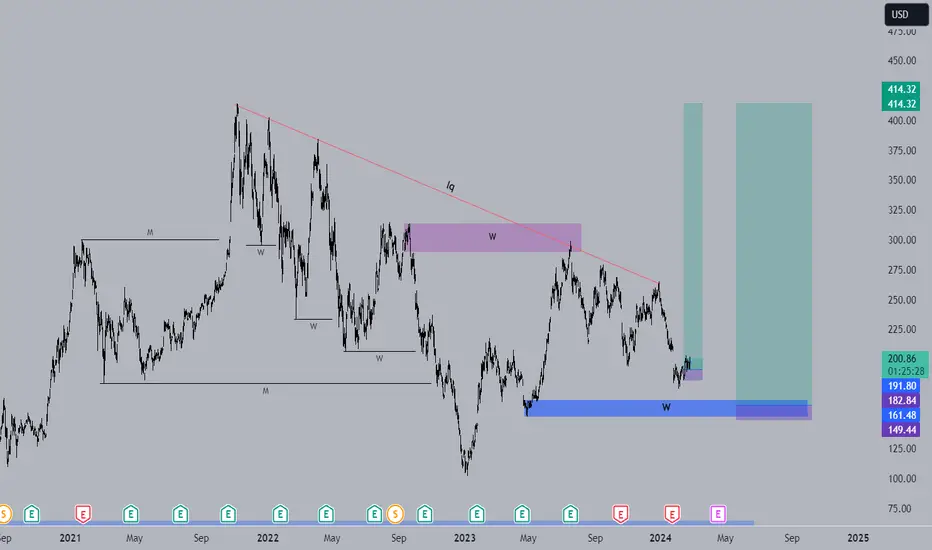
Cup & HANDLE + Mini Double Bottom: $TSLA to $610 ScenarioI maintain a bullish stance on Tesla ( NASDAQ:TSLA ), supported by a compelling combination of technical patterns and strong fundamental drivers. The current chart setup reveals a Cup and Handle formation complemented by a Mini Double Bottom, both of which are classic bullish continuation patterns. These suggest a potential breakout scenario that could drive NASDAQ:TSLA to $610 by year-end.
Technical Roadmap:
Gap Fill to $408: Anticipated earnings momentum, particularly from the Robotaxi segment, is likely to propel the stock to fill the previous gap at $408.
Consolidation at $450: Following the gap fill, I expect a consolidation phase forming a “box” around the $450 level.
Breakout to $610: A decisive breakout above $450 could trigger a strong rally toward the $610 target.
***Current Key Catalysts Supporting the Bullish Thesis:
Robotaxi Expansion: Tesla’s autonomous driving initiative is gaining traction, with Robotaxi developments expected to significantly boost revenue and margins.
India Market Entry: Tesla’s upcoming launch in India opens access to one of the world’s largest and fastest-growing EV markets.
In-House Chip Development & Dojo 2 Expansion: Continued investment in AI infrastructure and custom silicon enhances Tesla’s competitive edge in autonomy and robotics.
Tesla Diner Launch: The near-completion of Tesla’s themed diner adds to brand visibility and customer engagement.
Global EV Adoption: Tesla continues to benefit from rising EV demand across multiple international markets.
Optimus Robot Hype: Growing interest in Tesla’s humanoid robot project could unlock new revenue streams and investor enthusiasm.
Favorable Macro Trends: A declining interest rate environment supports higher valuations for growth stocks like Tesla.
Institutional Accumulation: Recent trading activity suggests that institutional investors are accumulating shares within the current range.
Grok AI Integration: The integration of Grok AI into Tesla vehicles could enhance user experience and differentiate Tesla’s infotainment ecosystem.
Investment Strategy:
I recommend initiating or increasing exposure to NASDAQ:TSLL (leveraged Tesla ETF) ahead of the upcoming earnings report. This could offer amplified returns if the bullish scenario plays out. Consider accumulating further on any dips, particularly during the consolidation phase around $450.
BUY NOW NASDAQ:TSLA NASDAQ:TSLL

TSLA: short as short can...below 200 certainly worth considering a reentry, but currently not sure if it will stop at 200 of 150.

Tesla High Risk of $255Tesla is Stuck under $430 ATH resistance and at high risk of falling back to $255 support.
Tesla is no longer growing and Musk is polarizing and alienating their mostly progressive leaning customer base. This stock simply makes zero sense for a 200 pe ratio.

$TSLA either one big flag or massive short setting upHello,
Just some browsing, NASDAQ:TSLA hasn’t had any major moves prior to early May - June IMO. This is on my watch for a short swing setup. This is bull flagging but I see a short here. I’m conflicted. I do see the higher low but we are in a pitchfork and this has been consolidating in this $290-$340 area for about a month and half. There’s also a lower high. Just posting for some free dialogue and open ideas. Talk to me. Let me know what you see and think. We aren’t too far from 200EMA and 200SMA. It’s just curling above the 50 as well. Maybe we consolidate for another week or two? A massive move is brewing here I think. I’m talking $100 in a week up or down soon.
WSL
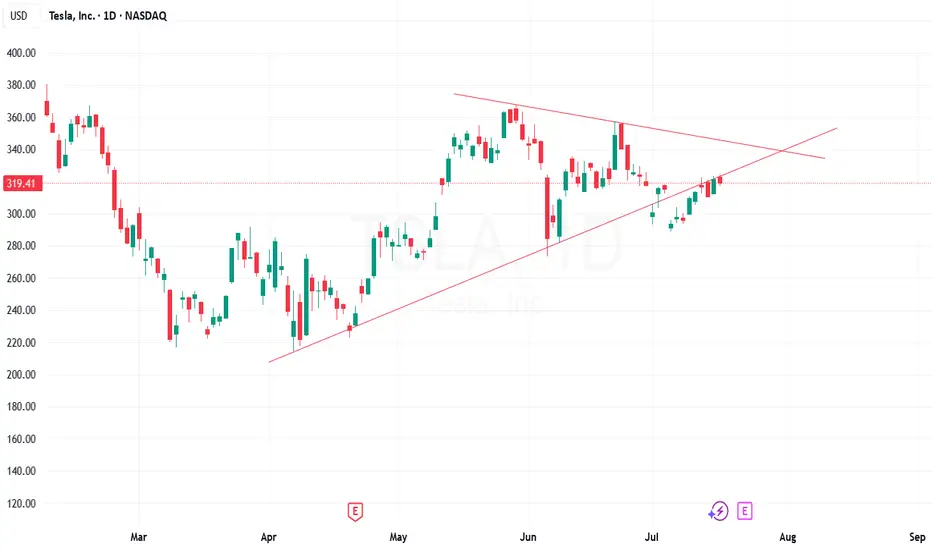
TSLA BUY+++ WEDGE FORMING $339 first targetTSLA, like AAPL, is forming a bullish wedge which likely will break to the upside. First target is $339 at wedge resistance then will reevaluate
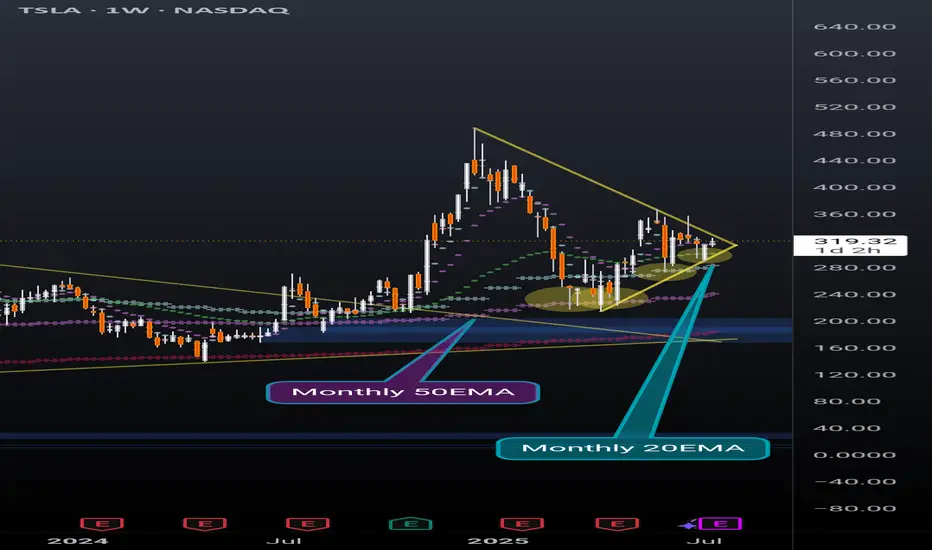
TSLA weekly coiling into something powerfulNever doubt the power of TSLA. Recently broke out of a huge pennant, and now nearing the end of another pennant while simultaneously holding support above the daily 20EMA(overlayed on this weekly chart).
Also recently found support off of the monthly 20EMA (overlayed on this weekly chart) and took 2 direct hits on the monthly 50EMA (overlayed on this weekly chart) before that and rallied up. It will take a lot to crush this setup but anything can happen. Possibly a longer pennant formation.
I'm just a cat not a financial advisor.
TESLA PRICE ACTION 22 JULY 2025This is the price action for Tesla. i have discussed indicators as well. Do not blindly trade without understanding the logics. I am long here with stocks & calls.
NOTE: DO NOT BLINDLY BUY

TESLA and the Elliott Wave Theory.This Chart shows a large Flat correction with Wave A and B(Black) completed. Wave B(Black) expressed itself in 3 waves namely A,B,C and are shown in Red. After B(Black) completed, a Wave C(Black) began so as to round off the Flat correction. A Wave 1(Green) formed, followed by a Zigzag correction and this meant a Flat for Wave 4(Green) was expected. After the Zigzag at Wave 2(Green), our Wave 3(Green) expressed itself in 5 Waves and are shown in Black. Wave 2(Black) was a Zigzag correction and Wave 4(Black) as expected, was a Flat. Wave 4(Black) completed recently meaning we are headed for a Wave 5(Black) which is also our Wave 3(Green). A confirmation at its current price location would trigger a sell.
Please note that Wave 5's(Black) location on the chart is purely for demonstration and price could move beyond or around this point.
@fantasyste

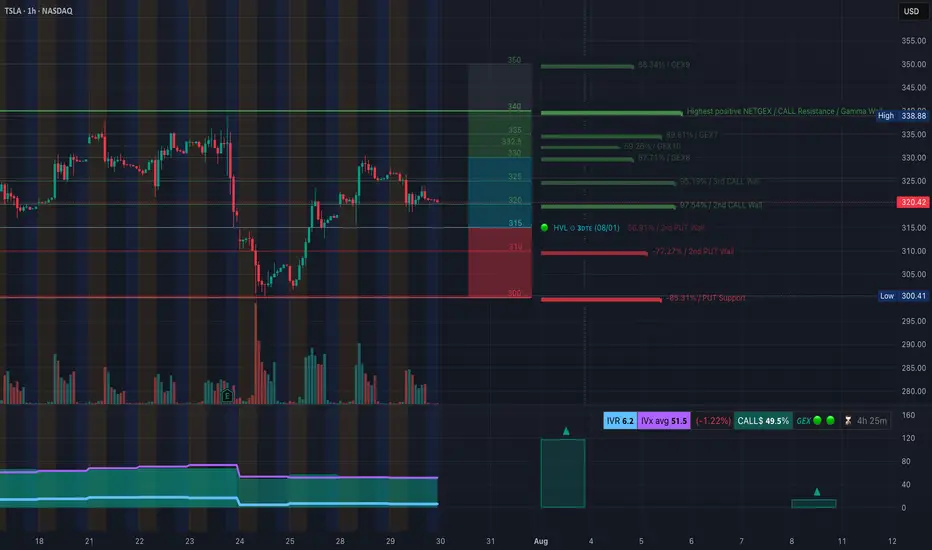
TSLA Downtrend Deepens — Key Gamma Floor at $300.41. August 1TSLA Downtrend Deepens — Key Gamma Floor at $300.41 Now in Sight
🔍 GEX & Options Flow Insight (1st Image Analysis)
TSLA continues to grind lower, breaking multiple gamma supports and staying pinned near the $306–$307 zone. The GEX profile shows a clear negative gamma environment, which means dealer hedging flows can intensify moves in either direction — but right now, momentum remains firmly bearish.
* Call Walls & Resistance:
* 📍 $321.36 → 2nd Call Wall (64.81% GEX2)
* 📍 $325.00 → Call wall resistance
* 📍 $330–$332 → Higher gamma resistance, unlikely in current structure without a strong reversal
* Put Walls & Support Zones:
* 🛡️ $306.99 → Current price zone, already tested multiple times
* 🚨 $300.41 → Highest negative NET GEX / hard gamma floor
* 📉 Below $300 → Opens quick downside to $295–$292
* Volatility Insight:
* IVR 7.5, IVx Avg 52.9 → Low relative IV in the context of a trending move down
* Call flow 39.3% → Bearish tilt despite modest call activity
* GEX sentiment: 🔴🔴🔴 = Strong negative gamma → price more sensitive to continued downside flows
✅ Option Trading Suggestion:
Bias: Bearish until a firm reclaim of $311–$315
Strategy: Bear put spread
* Entry Idea: Buy 305P / Sell 295P (Aug 2 or Aug 9 expiry)
* Invalidation: Strong hourly close above $315
* Target: $300 → $295
Why this works: Negative gamma positioning increases the likelihood of a push to $300. If $300 breaks, option dealer hedging can exacerbate selling.
🧠 Technical Analysis (1H Chart) (2nd Image Analysis)
Market Structure & SMC:
* 🟥 Multiple CHoCH events confirming breakdown structure
* ❌ Lost prior BOS levels near $321, then $315, and now hovering above $306
* Trading firmly inside a downward-sloping channel
Trendline Dynamics:
* Well-defined descending channel from recent highs
* Lower bound points toward $300–$295 in coming sessions
SMC Zones:
* 🟩 Demand Zone: $300–$295 → Last defense before deeper drop
* 🟥 Supply Zone (Purple Box): $319–$325 → Major resistance cluster
🔄 Price Action & Key Levels
* Support:
* ✅ $306.99 → Current defense
* 🚨 $300.41 → Critical gamma floor
* 📉 $295 → Lower channel target
* Resistance:
* 🚩 $311.64 → First reclaim needed for relief
* 🚩 $319–$321.36 → Key supply & call wall zone
🧭 Scalping / Intraday Trade Setup
🟥 Bearish Setup (Preferred):
* Entry: Breakdown below $306
* Target 1: $300.41
* Target 2: $295
* Stop: Above $311
🟩 Bullish Reversal Setup:
* Entry: Reclaim of $315 with volume
* Target 1: $321
* Target 2: $325
* Stop: Below $311
🔁 Summary Thoughts
* TSLA remains in a clear downtrend with a negative gamma backdrop.
* $300.41 is the key gamma floor — holding it may see a short-term bounce, breaking it risks a fast flush to $295.
* Until bulls reclaim $315, all rallies remain suspect.
🚨 Disclaimer:
This analysis is for educational purposes only and does not constitute financial advice. Always do your own research and manage your risk accordingly.

A Strategic Long Opportunity Amid VolatilityCurrent Price: $316.06
Direction: LONG
Targets:
- T1 = $324.00
- T2 = $328.50
Stop Levels:
- S1 = $312.50
- S2 = $308.00
**Wisdom of Professional Traders:**
This analysis synthesizes insights from thousands of professional traders and market experts, leveraging collective intelligence to identify high-probability trade setups. The wisdom of crowds principle suggests that aggregated market perspectives from experienced professionals often outperform individual forecasts, reducing cognitive biases and highlighting consensus opportunities in Tesla.
**Key Insights:**
Tesla’s stock presents both short-term risks and long-term upside opportunities. Despite recent earnings misses and margin compression, its pivot into AI and robotics offers significant growth opportunities. Upside resistance zones near $325-$330 create favorable price targets, while support levels at $307-$310 suggest strong buying interest. This environment could favor a long trading strategy, provided disciplined risk management is maintained.
**Recent Performance:**
Tesla recently experienced notable sell-offs following disappointing earnings, attributed to compressed margins and weaker EV demand. However, the stock rebounded 3.5% from last week’s lows, signaling resilience amid uncertainty. Year-to-date, Tesla remains one of the top-performing stocks with a 54% price increase, reflecting strong underlying investor confidence in its long-term story.
**Expert Analysis:**
Market experts are divided on Tesla’s trajectory. Near-term fundamentals appear challenging with declining revenue (-12% YoY) and price cuts impacting profitability. However, bullish projections from analysts such as Kathy Wood highlight Tesla’s potential for disruptive innovation in AI and robotics. Its ambitious initiatives like robo-taxi deployment add speculative appeal but also introduce scaling and regulatory risks.
**News Impact:**
Tesla’s upcoming robo-taxi launch in San Francisco is poised to impact market sentiment significantly. While safety drivers will be required during the initial rollout, scalability and regulatory challenges could limit the project’s immediate impact. Meanwhile, recent disappointing earnings results may weigh on sentiment in the short term while providing an opportunity for potential retrishments off support levels.
**Trading Recommendation:**
Given the current setup, Tesla appears poised for long-term growth, with upside resistance levels suggesting a viable rally opportunity. Investors should consider taking a bullish position while maintaining stops near key support zones to mitigate downside risks. This balanced approach aligns well with Tesla’s speculative appeal and broader investor sentiment.

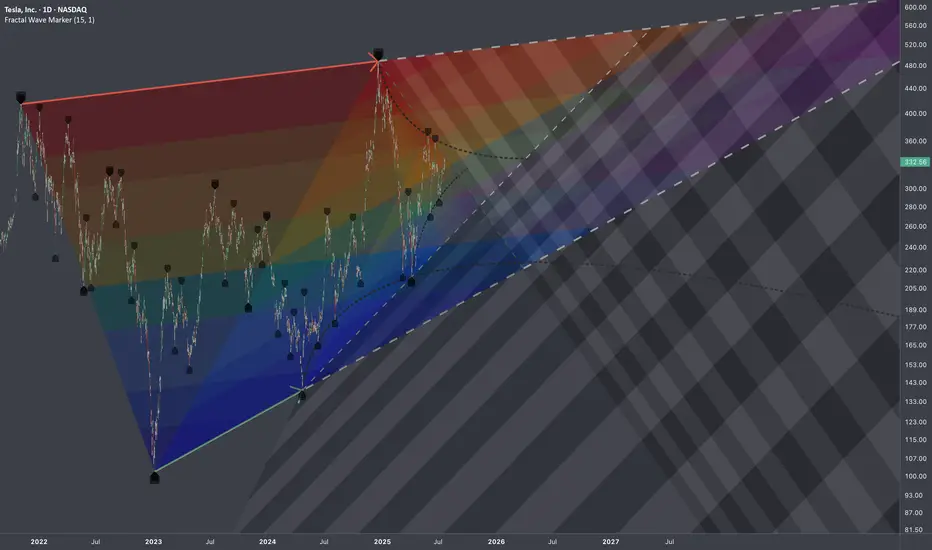
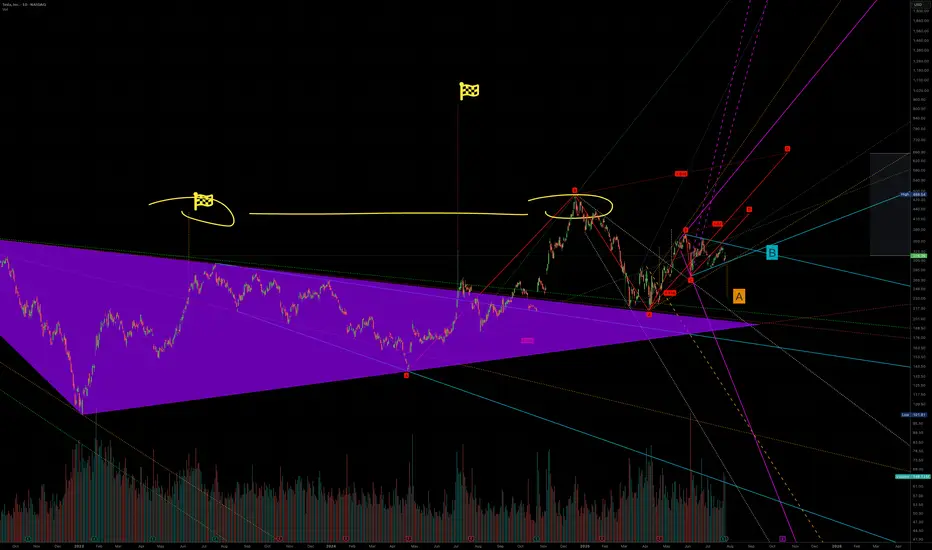
A to 236 or B killing A to 420Tesla is one of those stocks that is heavily manipulated algorithmically. When we were in an uptrend and needed a little push, a large fractal was created that could break a previously formed structure which should have taken us to $236(A). Interestingly, a very strong symmetrical triangle has emerged, influencing this upward movement, and the final price—due to some mystical reason—seems to be $420(B). It’s also worth noting that this whole move is being influenced by another similar structure whose target is above $600. So, if we analyze everything that’s happening, a 12% drop in sales means nothing compared to what Tesla will gain from robots, restaurants, and robotaxis, which I call RRR
Expected to go in Bearish Mode - Keep watchDaily candle clearly says, retracement from the triangle breakout line completed. It showing as reversal.
$TSLA: Multi-Scale DensityResearch Notes
Identified structural compressions happening within two periods:
This set has provided a perfect opportunity to study exponential fibs with growth rate starting from phi^1/4 applied to area of expression of squeeze.
Geometrically, gives a better sense of a continuity than regular fibs.