TSLA TA – Call Side Dominance Nearing Resistance-July 14TSLA GEX Analysis – “Call Side Dominance Nearing Critical Resistance 💥”
GEX Snapshot:
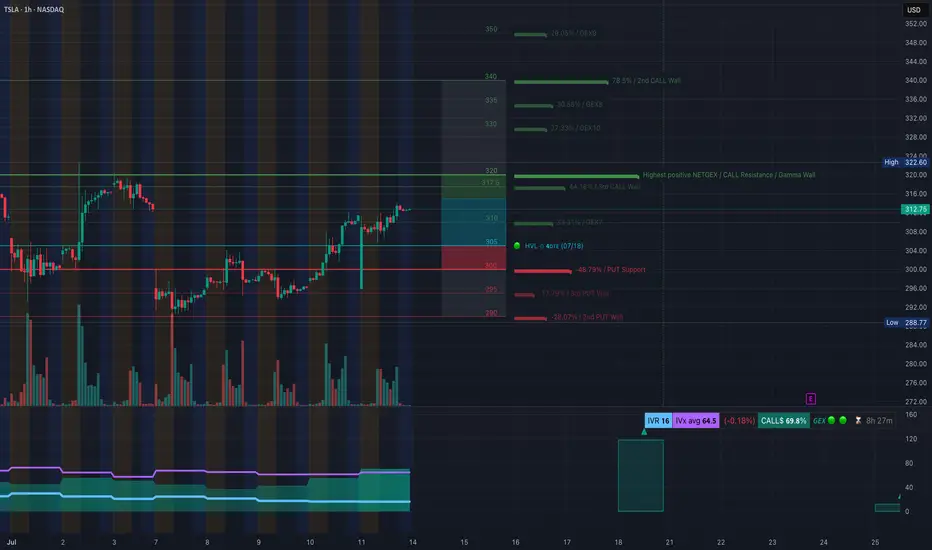
* Highest Positive GEX / Resistance: $320 – This is where call positioning is heaviest and likely where dealer hedging could resist further upside.
* Call Walls:
* $317.5 (44.18%)
* $320 (High NetGEX)
* $335–$340 (Intermediate resistance, weaker positioning beyond)
* Put Walls:
* $300 (48.79% support)
* $295 / $290 (3rd/2nd tier walls)
Options Oscillator:
* IV Rank (IVR): 16 (Low)
* IVx avg: 64.5
* Call Positioning: 69.8% (very bullish skew)
* GEX: 🔰 Bullish
🎯 Options Trade Setup:
Direction: Cautiously Bullish – but close to key resistance!
⚡ Aggressive Bullish Setup:
* Entry: Near $312.75 (current price)
* Strike: Buy $317.5C or $320C expiring this week
* Target: $320+
* Stop: Close below $308
* Note: Watch dealer hedging around $320. If TSLA breaks $320 with strength, gamma squeeze toward $335 is possible.
🛡️ Bearish Reversal Setup (if rejected at $320):
* Strike: Buy $310P or $305P (next week expiry)
* Trigger: Rejection at $320 + breakdown below $311
* Target: $304–$300
* Stop: Above $321
📉 TSLA 1-Hour Chart Analysis – “Breakout Zone or Fakeout Trap? Watch These Levels 🎯”
Structure:
* TSLA broke above the CHoCH and BOS zones between $308–$310. Price is consolidating under the $317.5–$320 resistance (also seen on GEX).
* There’s a clean ascending wedge/channel forming – upper boundary is near $320, and the lower trendline is near $304.
Key Zones:
* Supply Zone (Purple): $317.5–$320 (watch for rejection or breakout)
* Support: $309.8 (BOS zone), then $304 (trendline + demand overlap)
* Demand Zone: $293.5–$296 (origin of last rally)
🛠️ Trade Scenarios:
🔼 Bullish Continuation:
* Entry: Break and hold above $320
* TP1: $325
* TP2: $335
* SL: Below $311
🔽 Bearish Pullback:
* Entry: Rejection at $317.5–$320 zone and break below $309
* TP1: $304
* TP2: $296
* SL: Above $320
✅ Summary:
* GEX favors calls but $320 is a critical gamma wall – if broken, it opens room toward $335+.
* On the chart, watch the rising channel and upper resistance at $320.
* Bullish momentum is still intact unless $309 fails.
* Stay nimble: scalp calls on breakout, or prepare for a reversal put if there's rejection and structure break.
Disclaimer: This analysis is for educational purposes only and not financial advice. Trade at your own risk with proper risk management.
TSLAB trade ideas
TSLA racing to break thru resistancearea 1: 340
area 2: 360
will be tuned into earnings to see if the jig is jiggin July 23rd.
Elon is busy. so let's see what's the dealio.
****280 is a key level
**300 needs to hold for these attempts

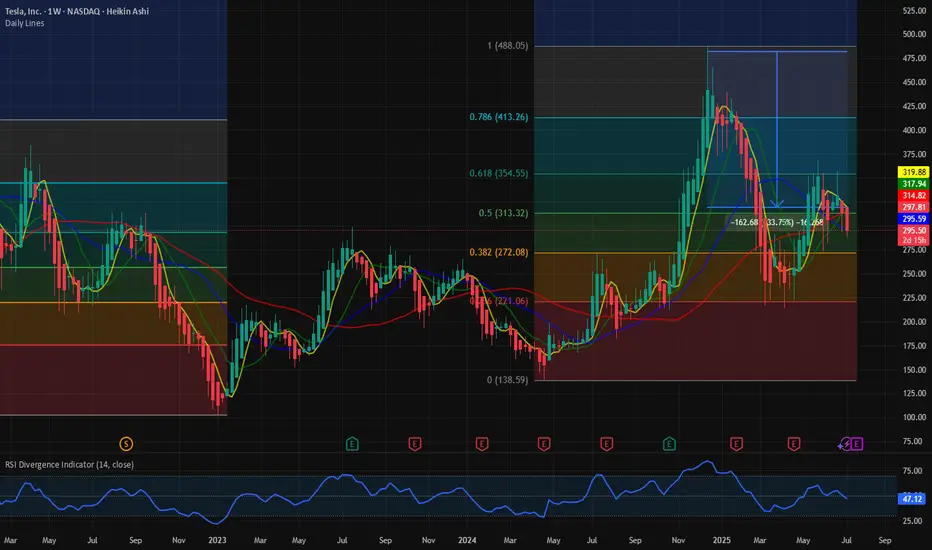
$TSLA: Battleground stock. There’re better way to make money. In this bull market where almost all the stocks are working, NASDAQ:TSLA seems to be still in the penalty box. When NASDAQ:NVDA , NASDAQ:MSFT are at ATH and most of the Mag7 are near to the ATH. NASDAQ:TSLA is still 33% below its ATH of 484 $. And the price action is not particularly bullish. This week NASDAQ:AVGO crossed NASDAQ:TSLA with a larger Market Cap cos. May be NASDAQ:AVGO should replace NASDAQ:TSLA in MAG7. A food for thought.
With such poor price action and the price stuck within the 0.618 and 0.382 Fib retracement levels the stock has not looked bullish recently. IN this recent market reversal all the speculative sectors like Quantum, Space stocks and Drone stocks are working, NASDAQ:TSLA is still searching for direction. In my opinion NASDAQ:TSLA has a great future with a visionary leader, but it might end up being a good company but not a good stock. With controversy surrounding the leadership it has become a battle ground stock. There are many large cap liquid stocks where the positive momentum is working. Until the stock breaks out of this consolidating pattern it’s better to make money somewhere else.
Verdict: Stay on sidelines for NASDAQ:TSLA stock. Accumulate if you need to. Buy it above 400 $ once momentum is back.
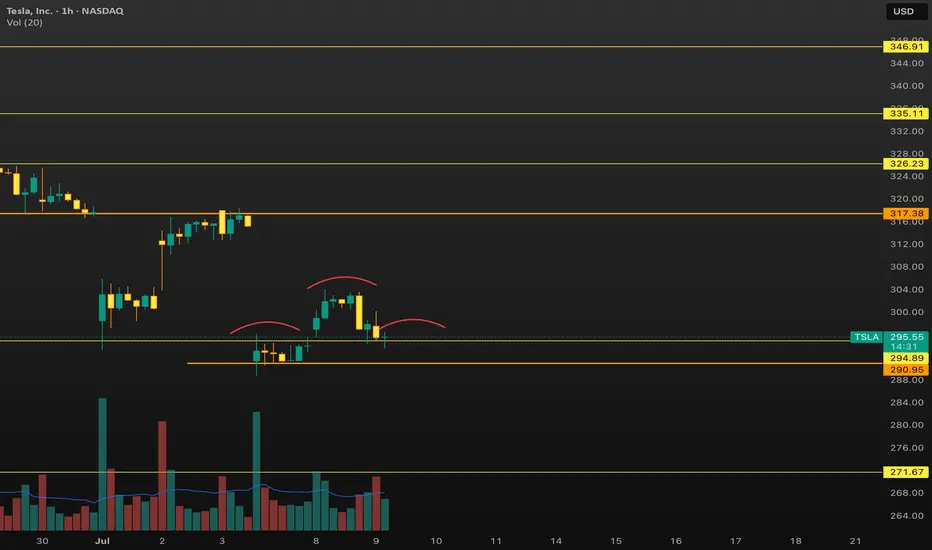
Tsla below 288 ?I see an H&S pattern forming if we break below 288 we could see it drop to 280 ish imo. Can play out this week. Lets see
How We’ll Trade Earnings This Season Earnings season is almost here — and if you're with QS, you’re already holding the most powerful edge in the market.
Let me walk you through how QS trades earnings, why we built 💸earning-signal, and how you can use it most effectively this quarter.
---
📜 A Little History: The Birth of 💸earning-signal
When QS launched in early April, we started with just two short-term signals:
⏰0dte
📅weekly-options
Both focused on short-term options trades.
Then came TSLA earnings in late April. That’s when we launched our very first 💸earning-signal — and nailed the prediction.
Since then?
We’ve had one of the best earnings win streaks on the internet. Period.
📌 Don’t take my word for it — check:
#✅signal-recap for the track record
#🤑profits and #🤩member-testimonials for real wins from members
---
🤖 Why We Built a Separate Earnings Signal
Earnings are not regular trading days. The dynamics are completely different.
On normal days, a stock might move <1%
On earnings? 10–20% swings are common
This is what we call a “pivot event” — and it requires a different engine to predict.
That’s why we separated:
📅 #weekly-options → normal day-to-day setups
💸 #earning-signal → high-volatility earnings plays
---
🧠 How a Human Would Trade Earnings...
If you wanted to manually trade an earnings report, you’d need to analyze:
Past earnings reactions
Analyst expectations
Earnings call language
Financial statement surprises
Options IV & skew
Post-earnings stock behavior
This would take hours (or days) — and most retail traders don’t have time.
---
⚙️ How QS AI Does It Instead
We built 💸earning-signal to do all that work for you — and more.
✅ It pulls in all the data above
✅ Runs it through 5 top LLM models (each acts as an independent analyst)
✅ Aggregates their insights + calculates probability-weighted direction & strategy
✅ Uses fine-tuning to learn from its past prediction success/failures
This means: faster decisions, deeper insights, and better accuracy — every week.
We don’t just run predictions. We let the AI learn from past mistakes and self-improve each quarter.
---
💥 Results Speak for Themselves
Last season, we nailed:
TSLA
MSFT (10x–20x winners!)
NVDA
AAPL
And many more...
All based on this unique AI-driven earnings analysis stack.
This season?
We’re going harder, faster, and even smarter. 📈
🎯 The goal is clear:
Make 💸earning-signal the #1 earnings prediction system in the world.
---
🧩 Final Notes
Earnings are 10x harder to trade than regular days
But with QS, you’re equipped with 500x the speed and insight of an average trader
Upgrade if you haven’t yet: #💰upgrade-instructions
Earnings season kicks off next week
Let’s get it.
Let’s win big.
Let’s make season 2 of 💸earning-signal our most legendary yet. 🚀💸

TSLA - Explosive Bounce TSLA Before the Drop? | EW Analysis My primary view is that we’re in the final stages of an ending diagonal, which could lift the price to new all-time highs, potentially between $460 and $650. Wave 4 of this structure appears to have completed after precisely tagging key Fibonacci support, and since then, we've already seen a strong bounce from that low. I’m now watching for the development of the final wave in this pattern, which could deliver gains of over 100% from current levels.
However, I’m not fully convinced by the internal shape of the diagonal so far. That’s why I’m also have an alternative scenario: in this case, the recent low may have marked the end of Wave 2 within a much larger diagonal. If true, this opens the door to a much more extended rally potentially reaching $1,000 before we see a major correction.
That said, this second scenario is not my preferred one, and a decisive break below the recent lows would invalidate both counts.

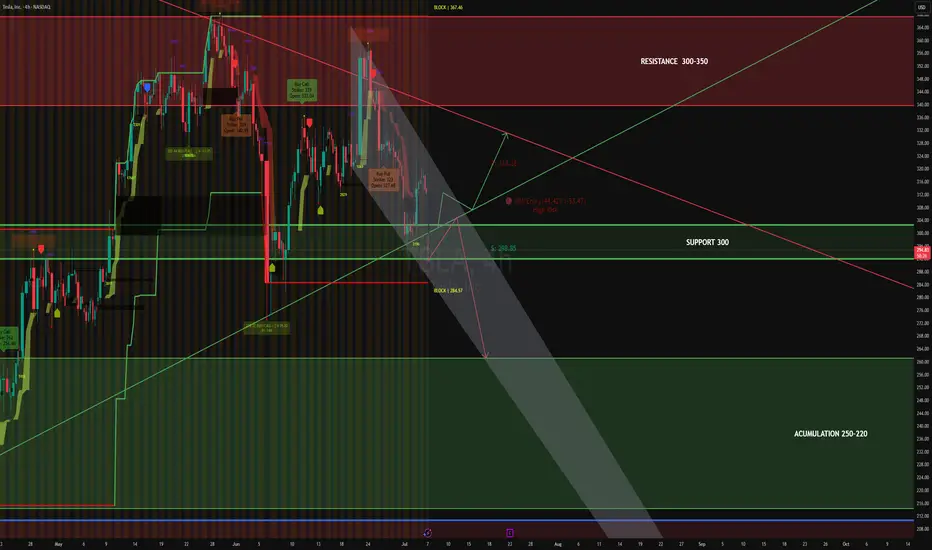
TESLA 4HS Tesla broke below the triangle formation, signaling a bearish continuation.
Trend: Bearish breakdown from consolidation triangle.
Key Support (SUP): $300 (now resistance on retest).
Next Demand Zone: Strong block between $284–285.
Accumulation Zone: $250–220, identified for potential long-term institutional accumulation.
Resistance (RES): $300–350 remains a significant supply zone.
Projection Channel: Downward channel in play; price action respects descending pressure.
Tesla: Ticking Higher on Consolidation Breakout Potential
Current Price: $315.35
Direction: LONG
Targets:
- T1 = $322
- T2 = $330
Stop Levels:
- S1 = $310
- S2 = $305
**Wisdom of Professional Traders:**
This analysis synthesizes insights from thousands of professional traders and market experts, leveraging collective intelligence to identify high-probability trade setups. The wisdom of crowds principle suggests that aggregated market perspectives from experienced professionals often outperform individual forecasts, reducing cognitive biases and highlighting consensus opportunities in Tesla.
**Key Insights:**
Tesla’s stock has been consolidating within a narrow range of $305–$320, reflecting investors' cautious optimism ahead of potential catalysts. Technical resistance at $322 is acting as a key breakout point that could open the path to higher price levels. The bullish sentiment is fueled by improving production efficiencies, ongoing expansion in international markets, and Elon Musk’s ambition to transform Tesla into a broader technology conglomerate. However, concerns surrounding increasing competition in the EV market and potential headwinds from regulatory changes remain significant risks.
**Recent Performance:**
Tesla’s recent price action has showcased volatility while maintaining key support levels around $301.11. The stock has demonstrated resilience, holding firm during tech sector corrections. Over the past month, Tesla has seen short-term rallies driven by positive speculation about its EV lineup, alongside broader optimistic movement in the S&P 500. Investors have stayed engaged, with trading volumes suggesting sustained interest despite external pressures.
**Expert Analysis:**
Market experts underscore $322 as a critical resistance level that serves as the decision point for renewed momentum. The stock's recent consolidation pattern signals a possible breakout, assuming macroeconomic conditions remain favorable. Analysts have also cautioned about rising competition from other EV manufacturers like BYD, which intensifies pressure on Tesla's pricing strategy and market share. Nevertheless, Tesla’s ambitious pipeline, including autonomous driving technologies, remains a significant source of long-term investor confidence.
**News Impact:**
Tesla’s near-term outlook is influenced by competing factors. On one hand, reports of a lower-cost EV could dramatically increase its addressable market, while ongoing advances in AI and battery technologies enhance the company’s competitive edge. On the other hand, upcoming expiration of federal EV tax credits and increasing geopolitical scrutiny over Musk’s public statements may weigh on investor sentiment. Despite this, news of expanded production capabilities in Gigafactory Nevada has bolstered optimism regarding Tesla’s capacity to scale effectively.
**Trading Recommendation:**
Taking a long position in Tesla appears favorable as price action signals bullish momentum within its established range. The short-term trade targets $322 followed by $330, with stop-loss levels placed at $310 and $305 to manage downside risk. Traders are advised to monitor any developments in macroeconomic conditions and competitive activity, which remain key influences on price trajectory.
TSLA : A lot of whipsawingThis has been a very volatile stock to hold. However for those who are bullish on this name long term, I can see this expand and impulse out into a larger 3rd wave. A smaller retracement still fits in this narrative to complete the wave 2 bottom. Let's see how earnings play out.

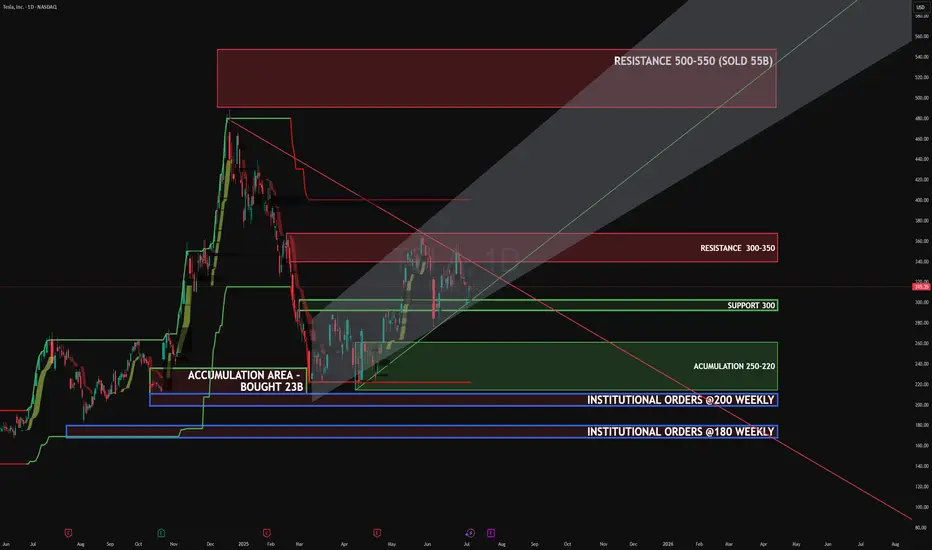
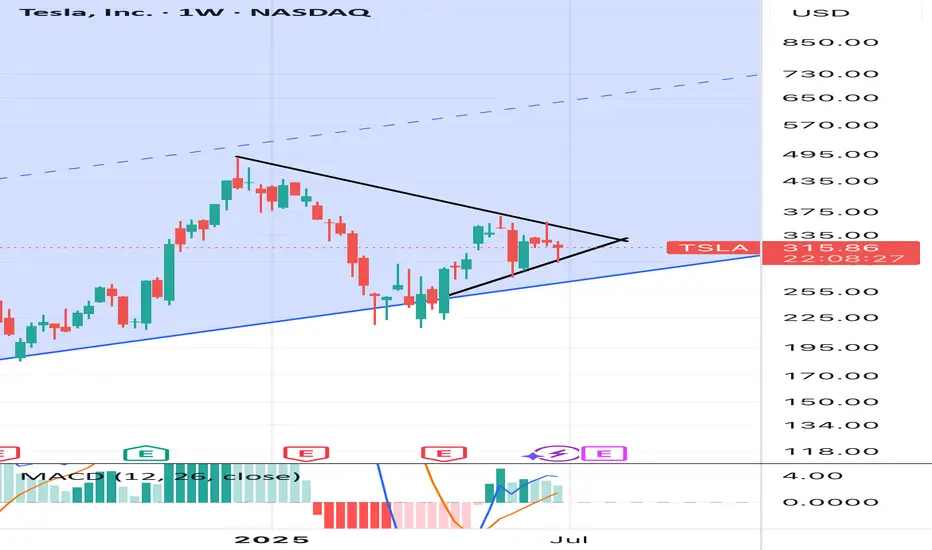
TeslaTSLA
Compression forming inside rising channel
Symmetrical triangle = explosive breakout setup
SUP: 300 / 250–220 (institutions bought $23B)
RES: 350 / 500
Target: 500
#TSLA #Tesla #Breakout #Stocks #Trading #OptionsFlow #PriceAction
Diamond Reversal Forming On Tesla ($TSLA)This pattern on TSLA fits the outline for a diamond reversal that is referenced on Investopedia.
It has all the "classical" facets of a diamond reversal which is a high (A), a low (C) a higher-high.
Furthermore, this is happening alongside a very similar pattern on NFLX and some bearish patterns on many other stocks.
Similar forms also occurred on SPX in 2021-2222 and Bitcoin in 2021.
The move up from the 2023 lows has the form of an ABC up... which suggests another 5 wave downmove on-par with or even exceeding the previous downmove is on the way.
The move off the highs was a whole 75% so even presuming a moderate 1:1 ratio, the next wave down could be very aggressive which means that an excellent short could be lining up.
Trade safe and be careful out there.

Tesla: Back on Track?Tesla has resumed downward momentum, aligning with our primary scenario and moving away from resistance at $373.04. As part of the ongoing turquoise wave 5, we expect continued selling pressure: it should break below the $215.01 support. This would complete magenta wave (3) of the current bearish impulse. A reversal back above $373.04 – and especially a breach of $405.54 – would force us to adopt the 38% likely alternative scenario. Under this count, the correction low of blue wave alt.(II) would be already in, and Tesla would now be rallying in wave alt.(III) .
📈 Over 190 precise analyses, clear entry points, and defined Target Zones - that's what we do.

TSLA: Agentic and real world AIThe "this is a just a car company" crowd, as usual, continues to point at the valuation as a reason to short. Not realizing that the valuation has always been high. It's been apart of Tesla's DNA for many years. Like a trend line, you must consider it in your thesis along with everything else.
We will remain on trend. Money printer is running again. Don't get left behind. Don't be a hater because the stock will move the way it wants regardless of how you feel about it.
I'm not a trader.

Big fat cup & handle on the weekly My instinct tells me today was the last dip buying opportunity before parabolic move. The daily chart is showing wedge consolidation and big institutions are buying. Elon just needs to focus
TSLA (daytrading) break out and retest1. Still watching here (down trend is too strong)
We can see break out patterm
2. And came back to restest. But i worry about that tsla usually doesnt restest like that.
3. Hit sma 200 h1

$TSLA Bullish Pennant Forming on Daily – Breakout Loading?Tesla ( NASDAQ:TSLA ) is currently trading within a bullish pennant formation on the daily timeframe — and this one is textbook.
It entered the pennant from lower prices, forming a clear flagpole. Since then, price has been compressing between:
📉 Two descending resistance levels → Lower highs
📈 Two ascending support levels → Higher lows
This symmetrical tightening creates a classic bullish continuation setup — if the breakout confirms. Also found support at horizontal level of support/resistance $229.
What I’m watching:
⇒ Break above pennant resistance with volume
⇒ Reaction to any macro or Tesla-specific news during this compression (earnings July 23)
TSLA has a habit of explosive moves after consolidation. Keep this one on high alert.
#TSLA #Tesla #technicalanalysis #bullishpennant #tradingview #DisciplineTrading

TESLA: Bulls Will Push
The price of TESLA will most likely increase soon enough, due to the demand beginning to exceed supply which we can see by looking at the chart of the pair.
Disclosure: I am part of Trade Nation's Influencer program and receive a monthly fee for using their TradingView charts in my analysis.
❤️ Please, support our work with like & comment! ❤️

$TSLA Time to Fade or..?NASDAQ:TSLA (like NASDAQ:GOOG ) is standing out to me as bullish, yet, corrective Elliot Waves a higher degree series of ABCs appear to be underway.
A final wave C appears to be underway which would take price too all time highs in an expanded flat correction pattern. My count could be wrong and the interference could be from the increase it sentiment volatility connected to the US headlines lately and Trump posting on socials. Things may get back to normal after the summer and a clearer pattern may emerge.
Price is struggling to get past the weekly pivot point bullishly or the weekly 200EMS bearishly and is trapped within that range.
For now long term target is the R2 daily pivot at $693 as the higher probability is continued upside
Safe trading

Could TSLA rebound after a weaker decrease than expected deliverTesla Q2 2025 Delivery fell, but could it rebound in 2H?
Key Figures
Q2 2025 Deliveries: 384,122 vehicles
Year-over-Year Change: Down approximately 13–14% from Q2 2024
Wall Street Expectations: Around 385,000–387,000 vehicles
Production vs. Deliveries: 410,244 vehicles produced, indicating a build-up in inventory
Fundamental analyst
Sales Decline: This marks the second consecutive quarter of declining deliveries for Tesla, reflecting intensifying competition, especially from Chinese EV makers like BYD and legacy automakers such as General Motors, who have gained significant market share.
Aging Product Line: Tesla’s current lineup is considered to be aging, with no major new models launched recently, while competitors continue to introduce fresh, competitively priced vehicles.
Brand and Leadership Impact: Tesla’s brand image and CEO Elon Musk’s public controversies and political activity have contributed to softer demand in some markets.
Inventory Build-Up: Production exceeded deliveries by about 26,000 vehicles, suggesting demand-side challenges rather than supply constraints.
Stock Market Reaction: Despite the delivery decline, Tesla’s stock price rose by about 4–5% after the report, as actual results were better than the most pessimistic forecasts (340,000–360,000 deliveries). The markets are expecting the decreasing trend to be slower.
Techincal Analyst
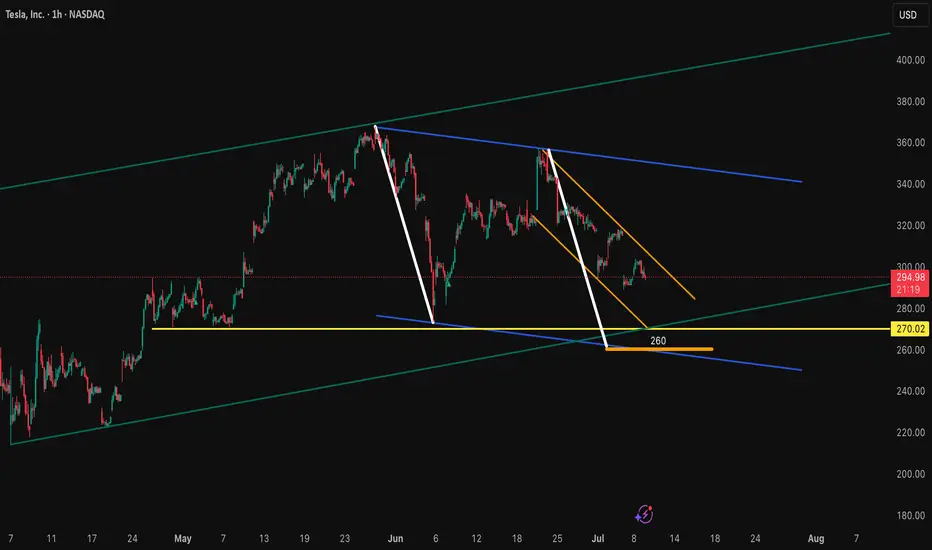
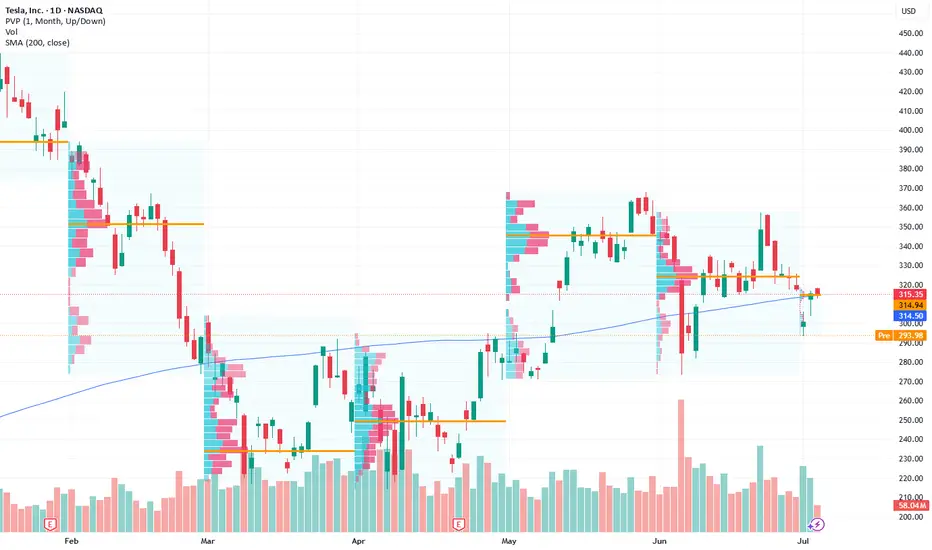
TSLA has rebounded strongly from its 2023 lows, forming a clear upward channel since late 2024. The stock is currently trading near the lower end of this ascending channel, indicating a key support area.
If TSLA sustains above the $300–$310 zone, the uptrend could resume, targeting $350 and potentially $400.
A breakdown below $300 could trigger further declines toward $275 or lower, especially if accompanied by high volume.
TSLA is at a technically important level. Holding above $300–$310 keeps the bullish channel alive, while a break below could signal a deeper correction. For the next directional move, watch for volume spikes and price action near these key levels.
By Van Ha Trinh - Financial Market Analyst from Exness

Adam & Eve on the Chart:Will They Bless Us with a $1,500 MiracleI don’t have much to say — it’s pretty straightforward.
We’ve got two potential structures on the chart:
✅ First, the symmetrical triangle that already broke out, aiming for a target around $958 to $1,000.
✅ Then we’ve got the “Adam & Eve” structure (gotta flex sometimes 😎), see it as a cup & handle pattern, aiming for a crazy $1,500 target. This one hasn’t broken out yet — but if the first triangle breakout plays out fully, it basically sets the stage for this one to break out too.
Some quick facts:
The bounce zone around ~$245 is a huge multi-timeframe confluence level.
Volume profile support is literally chilling right at $245.
Multiple moving averages are backing this move, even on lower timeframes than the "1M"
Triangle retest? Check.
0.786 fib support? Check.
(And to name a few)
Overall, the chart looks Fine to me.
Negative news might affect the short term, but the trend should stay intact.
Unless the macro changes.
That's it, that's the idea" - Good night !

Pull-back Post Austin LaunchNot quite a dark cover cloud candlestick today but given how strong the Nasdaq was today and NASDAQ:TSLA slumped is a fairly pathetic price action on day 2 post Austin launch.
IMO a lot of shorts were on the sidelines until robotaxi commenced. They waited for the pop and now feel more confident in entering short since they were able to assess launch. Buy the rumor sell the news if you will...
Correcting below the pre-launch price back to the lower wedge trend line around low 300s is my target.

The price will drop to at least $230The price will drop to at least $230. after that can goes to $200. but i have to re-check at $230
If you are thinking of investing, this is not a good place to buy at all.
I recommend entering in the $200 range after getting the necessary confirmations.
If you would like to follow me to see the rest of my analysis.
