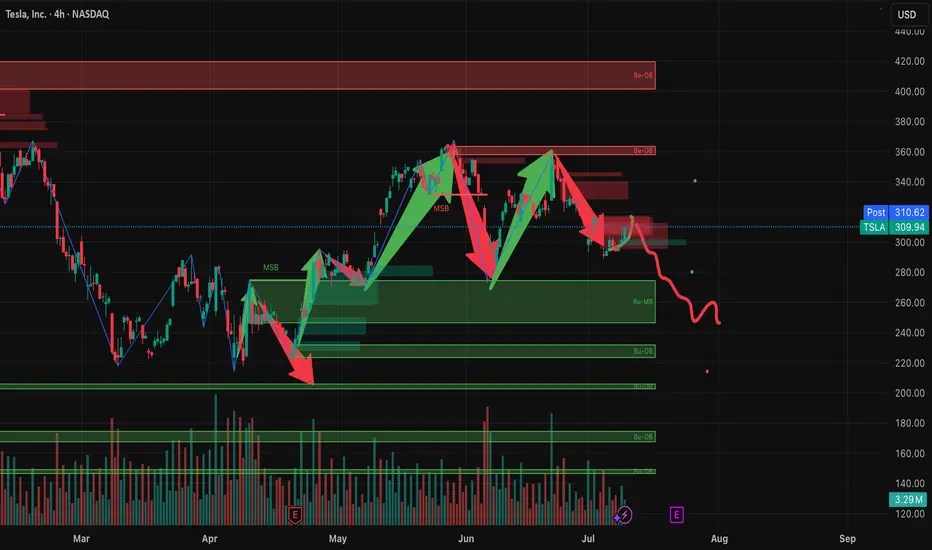
Tesla (TSLA) 1-hour chartTesla (TSLA) 1-hour chart im provided, here are the key bullish target points indicated by the chart analysis:
📈 Bullish Target Points (Upside Levels):
First Target Point:
🔹 Around $338.00 – $340.00
This level is marked as the initial breakout target, likely based on recent price structure and resistance zone.
Second Target Point (Extended Target):
🔹 Around $362.00 – $364.00
This is the higher target zone, representing a potential move if bullish momentum continues strongly. Likely aligning with a measured move or previous highs.
🧠 Context:
Price has broken out of a descending triangle/wedge pattern, a bullish signal.
It's also moving above the Ichimoku cloud, showing short-term bullish trend continuation.
Holding above the breakout level (around $305–$308) is critical to maintain upward momentum.
TSLAC trade ideas

TSLA: short as short can...below 200 certainly worth considering a reentry, but currently not sure if it will stop at 200 of 150.

Tesla - Major Breakout BrewingTesla has been going through the wringer, between Robotaxi news, tariffs and the ongoing feud between the most powerful man in the world (Trump) and the richest man in the world (Elon). No doubt the news has had its fair share of impact on the stock. But Technicals will always hold more weight than news. I'll breakdown a few reasons why I believe this stock is due for a major run to ATHs
As you can see on this 4H chart, a nice falling wedge is forming and PA is respecting it, even with the wild gaps. On top of this being a bullish pattern, TSLA is also in a crucial area of support within the $290s . If you look back to Jun 9th 2025, you can see Tesla bounced from the 281 level to the 330s which is another indicator of strong support. Not to mention, a the 50 MA crossed the 200 MA on the daily on July 1st which is another bullish indication. The wedge looks to bottom out at the 280 level but I don't see this stock going that low. $290, 291 is an optimal entry to go long.
The long term trend line from April 21st 2025 has not been completely invalidated as of yet. If it retests at 310 and falls back within the wedge, I am still bullish. If price falls under $280, I am bearish. But until then, load up because the next stop is $350 after breakout, then $400, then ATHs. I'm expecting the breakout to happen by earnings or potentially before if this unnecessary feud between Trump and Elon ends.
P.S. I didn't get a good entry on this trade but I have a long position due to expire on the 25th.
Good luck trading.
-AceBoogieWitMe

TESLA PRICE ACTION 7 JULY 2025I have clearly explained the price action for Tesla. I have tried my best to explain why you should not be aggressive here.
I have also discussed the stops
NOTE:DO NOT BUY CALLS

Why TSLA will Crash based On Copper TarrifsHere’s why that bearish outlook is gaining traction:
Copper costs are surging: Tesla uses over 180 pounds of copper per vehicle. With prices spiking 13% in a single day and a 50% tariff looming, production costs are rising fast.
Analysts are cutting price targets: UBS, JPMorgan, and Bank of America have all lowered their forecasts for Tesla, citing margin pressure and weakening demand3.
Brand sentiment is shaky: Tesla’s recent delivery miss and political controversies around Elon Musk have added to investor unease.
Tariff ripple effects: The broader trade war is expected to disrupt supply chains and inflate costs across the EV sector5.
That said, some analysts still see long-term upside if Tesla can pivot quickly—especially with its AI and autonomous driving ambitions. But for now, the market is reacting to the immediate risks.
Overall Enter Short for Gains of 3-5 percent.
Long TESLATrading Fam,
Today my indicator has signaled a BUY on $TSLA. The technicals align. M pattern looks to have completed at strong support (RED TL) and is bouncing upwards inside of a solid liquidity block. Buyers are stepping in. I'm in at $315 and will shoot for $430 (probably taking some profit along the way). My SL is currently $241 but will trail as we enter profit.
Best,
Stew

TESLA I Its not only EV Cars. Elon Musk predicting 1000% growthThis is not a short-term trade as you know from me on FX, Crypto and Indices. This is buy and hold investment. I got already good bag of share and Im still adding without trying to time if perfectly, but now I think its time to buy bigger positions.
Tesla is my 3rd biggest position after the Bitcoin and Strategy (MicroStrategy). Many people see it only as an EV cars company, but it's not all what they do, just read bellow to see why I see a huge potential in this company.
📍 Why Tesla is Considered a Top Investment
Tesla stands out as a leading player in the EV market, with a strong brand and a history of delivering innovative products. In 2024, it produced about 459,000 vehicles and delivered over 495,000 in the fourth quarter alone, showcasing its ability to meet growing demand Tesla Fourth Quarter 2024 Production, Deliveries & Deployments.
💾Financially, Tesla reported $97,690 million in total revenue for 2024, with the automotive segment contributing $87,604 million and energy solutions adding $10,086 million Tesla, Inc. Annual Report on Form 10-K for 2024. This diversification into energy, alongside investments in autonomous driving, positions Tesla for long-term growth, making it attractive for investors seeking exposure to future trends in sustainability and technology.
📍 What Tesla Does Beyond EV Cars
Beyond EVs, Tesla is deeply involved in energy solutions:
📍 Solar Products: Offers solar panels and solar roofs for clean energy generation.
📍 Energy Storage: Provides Powerwall for homes and Megapack for large-scale projects, helping stabilize grids and manage energy costs.
📍 Charging Infrastructure : Operates a network of Supercharger stations, increasingly open to other EVs.
Services: Includes vehicle maintenance through service centers and body shops.
📍 Robotaxi: Plans to launch a fully autonomous ride-hailing service in June 2025 in Austin, Texas, potentially opening new revenue streams Tesla's robotaxis by June? Musk turns to Texas for hands-off regulation.
📍 Tesla Optimus: Developing a general-purpose robotic humanoid for tasks like household chores or industrial work, which could lead to new markets.
This expansion into energy and services, along with unexpected ventures like Robotaxi and Tesla Optimus, enhances Tesla's role in the transition to sustainable energy and technology, offering benefits like grid stability and potential robotics applications.
The growth in the energy segment, with a 67% increase from 2023 to 2024, highlights Tesla's expanding role in sustainability, potentially attracting investors focused on long-term trends. Additionally, Tesla's commitment to innovation, particularly in autonomous driving technology, is noteworthy. The company is developing features like Full Self-Driving (FSD), which could open new revenue streams, such as robotaxi services, enhancing its investment appeal.
🤔I think Optimus and Robotaxi will exceed rapidly exceed their EV cars revenue. Elon musk is predicing over 1000% growth in 5 years. Which would be way above $2900 without stocks splits.
I m a bit conservative and I think we can go somewhere between 3 - 4 standard deviations.
Wishing you continued success on your trading journey. May this educational post inspire you to become an even better trader!
“Adapt what is useful, reject what is useless, and add what is specifically your own.”
David Perk ⚔

Big Bounce or Breakdown? Tesla at the edgeTesla is at crossroads right now, where the next move will define its near-term trajectory.
After an extended correction phase, TSLA is reaching a key zone around the $300 level, one that held price well during recent pullbacks.
Although recent tax news caused a decline in the price, belief in Tesla’s longer-term trajectory remains strong among many investors.
At the same time, many investors are carefully monitoring the support near $215 to $230, another important zone. This level has acted as a reliable level during past pullbacks, as it suggests the stock has a solid base, despite short-term ups and downs. For these investors, maintaining their positions through consolidation is a test of patience and belief in Tesla’s longer-term trajectory. If Tesla breaks below the $230 support zone, some investors may view this as an opportunity to take advantage once again.
Given the current setup, it’s best to be cautious and wait for confirmation before looking to get involved.

TSLA Long Idea — Buying the Support After News-Driven DipNASDAQ:TSLA price has stabilized near the key $290–291 support zone, a level that has previously triggered rebounds. This presents a solid entry opportunity with limited downside risk.
Context: The recent drop was triggered by headlines involving the U.S. President and Elon Musk. If this was mainly speculative noise, now could be the best time to buy, as the market absorbs the news and finds technical support.
Technical Setup:
• Strong support at $290–291 holding firm.
• Stochastic is in the oversold zone and starting to turn upward.
• Bollinger Bands tightening — breakout likely.
• Target: $307.45 (+4.57%)
• Stop-loss: $289.09 (−1.68%)
• Risk/Reward Ratio: 2.72
Expected move by July 9, 2025. With strong technical signals and fading news impact, this setup offers a favorable risk/reward for bulls looking to ride a rebound.

TSLA: Triangle PatternResearching the market through structural lens, particularly the topology of trapped liquidity buildup and compression of volatility, that leads to a proportionally heavier move once a breakout occurs.
Raw compression area derived from waves of higher degrees (2nd, 3rd)
The longer price consolidates within boundaries of a triangular formation, the more significant the breakout tends to be.

Tesla -> The all time high breakout!🚗Tesla ( NASDAQ:TSLA ) prepares a major breakout:
🔎Analysis summary:
Not long ago Tesla perfectly retested the major support trendline of the ascending triangle pattern. So far we witnessed a nice rejection of about +50%, following the overall uptrend. There is actually a quite high chance that Tesla will eventually create a new all time high breakout.
📝Levels to watch:
$400
🙏🏻#LONGTERMVISION
Philip - Swing Trader

I am bullish on TSLAI have not changed my buy bias for this baby.
II will continue adding TSLA to my portfolio with $360 and $400 as my medium-term take profits.
Share your thought.
If you found this helpful, like, follow and share

TESLA: Bearish Forecast & Bearish Scenario
Our strategy, polished by years of trial and error has helped us identify what seems to be a great trading opportunity and we are here to share it with you as the time is ripe for us to sell TESLA.
Disclosure: I am part of Trade Nation's Influencer program and receive a monthly fee for using their TradingView charts in my analysis.
❤️ Please, support our work with like & comment! ❤️

Tesla (TSLA) Market UpdateTesla NASDAQ:TSLA shares dropped nearly 7% after Elon Musk dismissed analyst Dan Ives' suggestion to scale back his political activities. Musk also proposed a new pay package, raising concerns among investors about potential distractions from Tesla’s core business.
📊 Upcoming Catalyst:
Tesla is set to report its Q2 earnings on July 23, with investors eagerly awaiting updates on the company’s financial performance and the newly launched robo-taxi service in Austin, Texas.
⚠️ Sentiment:
Recent bearish headlines include:
Concerns over potential Robotaxi issues
The ongoing Trump/Elon Musk political drama
📈 Trading Opportunity (Long Setup):
Despite the negative sentiment, this dip could offer a solid long entry opportunity:
Entry Zone: $275–$270
Take Profit Targets:
TP1: $315
TP2: $335
Stop Loss: Close below $265

MUSK on TRUMP's Bill | "outrageous, disgusting abomination"Elon Musk’s sided against the latest Trump-backed tax-and-spending package, in a plot twist between the recent partners turned enemies.
Musk called the legislation a “massive, outrageous, pork-filled Congressional spending bill” and a “disgusting abomination,” publicly shaming senators and representatives who backed it.
With such a strong opinion against it one may wonder, is this going to negatively affect Tesla?
Together with this strong reaction, the price has already been trading lower for the past few days.
The administration has defended it as the “One Big Beautiful Bill,” insisting it will stimulate growth, even though Elon Musk warned the bill would swell the U.S. budget deficit by roughly $2.3–2.5 trillion over the next decade, calling the added debt “crushingly unsustainable”.
When I first read this, it made me think of Tesla's long generated “green credits”, which in 2024 alone, brought in roughly $2.76 billion. “green credits” (officially, zero-emission or regulatory credits) work by building more clean vehicles than required and selling the excess allowances to other automakers that need them to comply with emissions mandates.
Now I'm no expert on US policy, and so I roped in GPT to help me explain how this new bill implicates TESLA's profit:
Under the Senate’s “big, beautiful” tax-and-spending bill, Tesla’s regulatory-credit business faces two assaults:
❗ Repeal of CAFE- and ZEV-mandates
The bill would eliminate penalties for automakers missing Corporate Average Fuel Economy targets and roll back zero-emission vehicle mandates that currently force legacy manufacturers to buy credits if they fall short. Remove those penalties and mandates, and there’s no structural need for credits—undercutting the very market that funds Tesla’s $2–3 billion-a-year credit-sales business
❗ End of consumer EV tax incentives
By phasing out the $7,500 new-EV credit (and the $4,000 used-EV credit) within months of enactment, the bill dampens U.S. EV demand overall. A smaller EV market means fewer opportunities for Tesla to leverage fleet-wide ZEV regulations against higher-emitting rivals—further squeezing credit prices and volume
Bottom line: Without CAFE/ZEV obligations and with EV purchase subsidies gone, Tesla’s “green-credit” line—a major profit driver in recent quarters—would likely collapse, removing a key buffer against manufacturing and pricing pressures.
This could be the beginning of a bear market for Tesla lasting throughout the rest of the Trump administration.
________________________
NASDAQ:TSLA

7/7/25 - $tsla - 20% position.7/7/25 :: VROCKSTAR :: NASDAQ:TSLA
20% position.
- that's the message... refer to prior msg "buying all dips"
- u do u
V

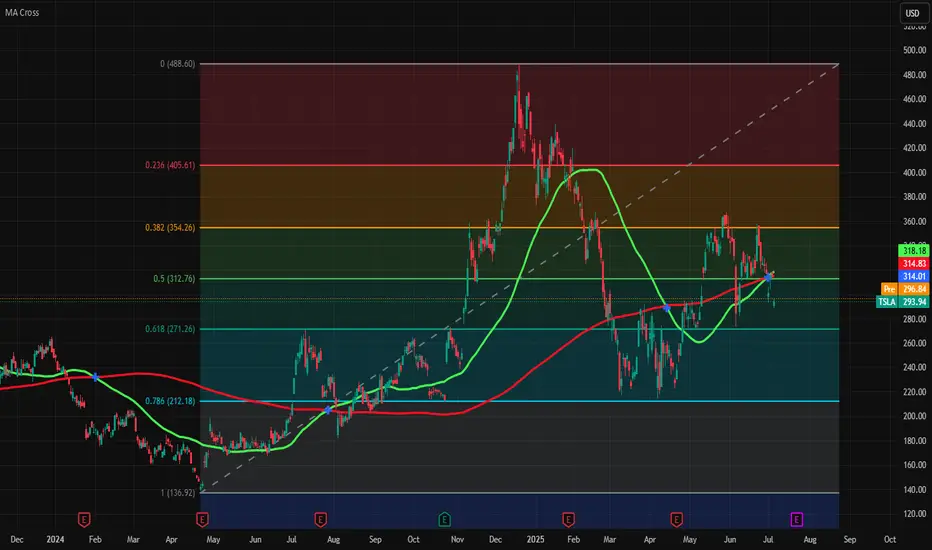
Tesla is on edge of Golden crossTesla is on edge of golden cross (50 and 200 days moving average crossover) and fresh entry is possible above green line of 50 days MA (318.18) and SL is 271 and TP is 354.
If it fall then wait for 271 level or again cross above green line.
Tesla, Below 200 Next - The Crash Can Reach 140, 150 & 160Tesla has been bearish since December 2024 and producing lower highs since. A strong lower high happened late May with a shooting start candlestick pattern. A month later another lower high and bullish rejection with an inverted hammer.
This looks like an ABC correction with the low in March/April being the A wave. The lower high in May the B wave and the next low the final C wave. This would complete the corrective pattern.
Conditions for bullish
An invalidation of the bearish bias and potential would happen with a rise and close, weekly, above 355. Any trading below this number and the bearish bias remains intact.
Indicators: RSI & MACD
» RSI:
The RSI looks pretty bad as it already curved down; trending down and moving lower since December 2024.
» MACD:
The weekly MACD is weak, starting to curve but still on the bullish zone. The daily MACD already turned bearish and moving lower.
Summary
Overall, market conditions are weak for this stock and everything points lower. The chart structure points to a lower low based on a broader bearish trend.
Thank you for reading.
Namaste.

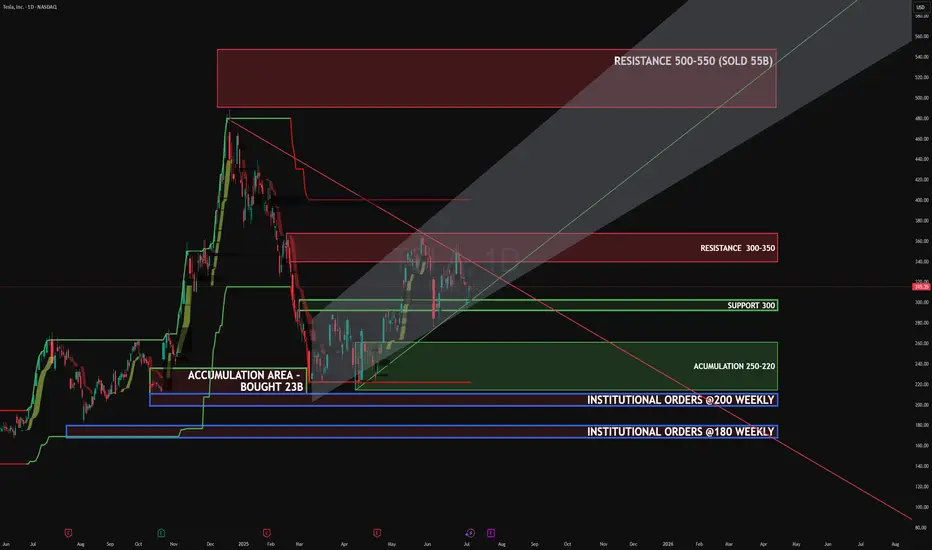
TeslaTSLA
Compression forming inside rising channel
Symmetrical triangle = explosive breakout setup
SUP: 300 / 250–220 (institutions bought $23B)
RES: 350 / 500
Target: 500
#TSLA #Tesla #Breakout #Stocks #Trading #OptionsFlow #PriceAction
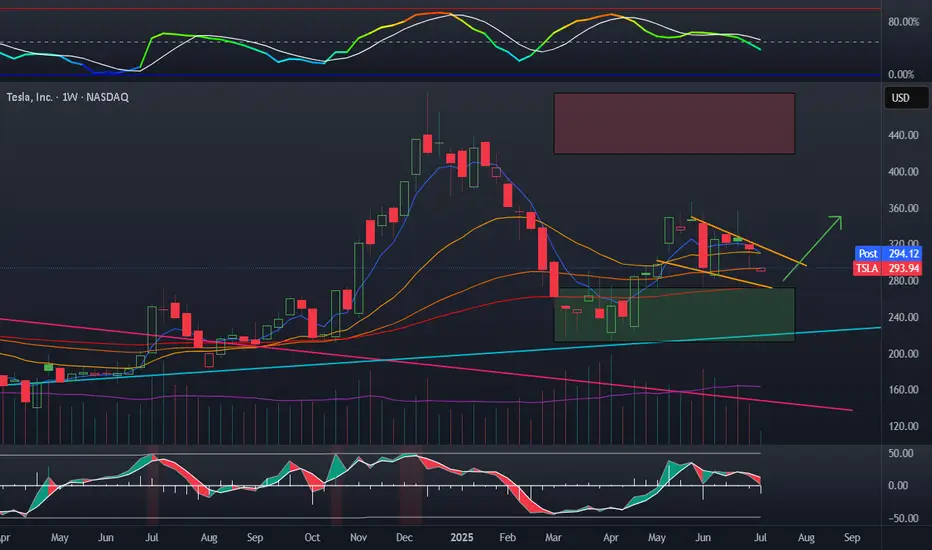
TSLA : A lot of whipsawingThis has been a very volatile stock to hold. However for those who are bullish on this name long term, I can see this expand and impulse out into a larger 3rd wave. A smaller retracement still fits in this narrative to complete the wave 2 bottom. Let's see how earnings play out.

TSLA consolidation before expansionTesla despite being effected once again by fud is ready to pop. Average volume is up, a bear flag has played out, and oscillators reset. This 55 EMA on the weekly is a nice DCA zone. A bounce here or around 270 is likely. I think we see another try at 350 in coming weeks.
My plan:
Averaging down on TSLL, in CSP, already captured a few rounds of covered calls
Tesla on the Edge – Key Support or Deeper Drop?📉 Tesla on the Edge – Key Support or Deeper Drop? 🔥🔍
Tesla is in freefall, dropping nearly 9% today. The stock has plummeted from its highs near $500, now testing the critical $220-$200 support zone.
📊 Key Levels to Watch:
📌 Holding $220 could trigger a relief bounce towards $275+.
📌 A breakdown below $200 could open doors to $160-$180, or worse.
🔎 What’s Happening?
Tesla, along with X and SpaceX, is under intense scrutiny amid political pressure, regulatory battles, and even cyberattacks. This aligns with the broader market uncertainty, as Bitcoin struggles to reclaim $79,478.
👀 Elon Musk is in the spotlight, facing global resistance, from social media wars to business challenges. Could this spell opportunity or more downside for Tesla?
⚡️ Will TSLA rebound, or is it heading even lower? Let me know your thoughts below!
One Love,
The FXPROFESSOR 💙
#Tesla #TSLA #ElonMusk #StockMarket #Trading #TechStocks

Tesla Bullish Breakout Setup: Entry at $295.54 Targeting $488.87Entry Point (Buy Zone): Around $295.54
Stop Loss: Between $272.94 – $295.54 (lower purple support zone)
Target (TP): $488.87
Current Price: $315.33 (as of the latest candle)
📈 Strategy Summary:
Setup Type: Long (Buy)
Risk-Reward Setup:
Reward: ~$193.33 per share (from $295.54 to $488.87)
Risk: ~$22.60 per share (from $295.54 to $272.94)
Reward:Risk Ratio ≈ 8.6:1 — a high potential payoff if the trade works out.
📊 Technical Context:
Support Zone: Price recently bounced off the support region (marked in purple).
Moving Averages:
Red Line (Short-Term MA): Price just crossed back above.
Blue Line (Long-Term MA): Price reclaimed this level — bullish signal.
Price Action: After a corrective phase, a possible reversal is forming at support, confirming bullish interest.
✅ Bullish Signals:
Bounce from support zone with a strong bullish candle.
Price closing above the 200-day MA (bullish trend resumption).
High reward-to-risk trade setup with clear stop loss.
⚠️ Considerations:
Confirmation with volume or a second bullish candle would add confidence.
Watch for earnings or macro events that could disrupt the trend.
Tight stop is essential to avoid drawdowns if the setup fails.
🔚 Conclusion
This is a well-structured long setup with a high potential reward. If price maintains above the entry zone and breaks recent highs, a push toward the $488.87 target is plausible.
