Weekly Technical Analysis for TSLA (June 24–28)TSLA is entering a critical squeeze zone between major gamma walls and key price structure levels. Let’s break this down with both the Daily GEX Map and the 1-Hour Price Action to strategize your trades this week.
📊 GEX Map (Daily Timeframe Insights)
From the first chart:
* Current Price: $322.16
* High Gamma Resistance Zone:
* 🧱 $330 = GEX Cluster
* 🧱 $336–$342 = Highest NTE/Call Wall
* 🧱 $348–$367 = 2nd and 3rd CALL Walls
* Support Levels:
* 🛡️ $315 (2nd PUT Wall)
* 🛡️ $310 (3rd PUT Wall)
* 🔻 Below $310 = Gamma unwind and vacuum toward $296
GEX Sentiment:
* GEX: ✅ Bullish (green dot)
* IV Rank (IVR): 26.6 (low) → cheap options
* CALL$ flow: 59.3% bias bullish
* IVx < IVR → low IV crush risk on CALLs
Interpretation:
TSLA is pinned between two strong gamma zones: $315–$330. A breakout could magnet price quickly to $342+, but a breakdown below $312.50 puts $296 in play fast.
🕐 1-Hour Chart (Smart Money Concepts)
* CHoCH confirmed around $330 zone → bearish pressure
* BOS and reaccumulation near $312–$316 zone → short-term buyer defense
* Trendline support holding, price coiling in a wedge
* Volume shows weak conviction in breakdowns; potential trap under $315
🎯 Trade Scenarios for This Week
🔼 Bullish Setup (Breakout Above $330):
* Entry: Above $333 (confirm breakout + GEX flip)
* Target 1: $342 (GEX target, CALL wall)
* Target 2: $348–$357
* Stop: Below $322
* Trigger: Volume surge + clean CHoCH over pink zone
🔽 Bearish Setup (Breakdown Below $312):
* Entry: Below $311 (gap-filler move)
* Target 1: $296 (FVG + structure zone)
* Target 2: $284 (OB demand)
* Stop: Above $318
* Trigger: CHoCH failure + BOS retest fails under OB
🧠 Smart Tips
* If you’re scalping: watch the $322–$325 chop zone. Only commit on break of wedge.
* Gamma compression + low IV makes TSLA explosive this week—perfect for vertical debit spreads or lottos on direction breakout.
* Best confirmation = volume + higher timeframe CHoCH + breakout candle from consolidation.
🔚 Final Thoughts
TSLA is coiled tight. Watch for the breakout of $330 or a flush under $312. Both offer strong risk-to-reward opportunities. Stay patient, and let price confirm before sizing in.
Disclaimer: This analysis is for educational purposes only and does not constitute financial advice. Always do your own research and manage your risk properly.
TSLAD trade ideas

TESLA PRICE ACTION 20JUNE 2025This is the price action of Tesla . I have discussed everything deeply and if you have any doubts then feel free to message or leave a comment.
I am bullish on Tesla.
NOTE:DO NOT SHORT TESLA

TSLA shortPart of a larger analysis, at the moment Tsla rejected 332 B pivot and imo retesting possible b.o. area. missed gap up open, retest of highs sent 305p strike. looking to close at 310-305 tgt zone. n.f.a. g.l.h.f
Technical Analysis – TSLAChart Summary:
Current Price: ~$349.21
Local Top: ~$357.53 (100% Fib extension)
Bearish Rejection: Notable wick + retrace from 0.886–1.0 zone
Probable Pullback Zone: 343.00–338.50 (Fibonacci 0.618–0.5 retracement)
Major Support Levels:
$334.50 – Prior key horizontal + Fib confluence
$311.62 – Historical demand zone
Projection:
Intraday double-leg correction toward $338–$343
Possible bounce and continuation toward the golden target zone:
$366.47 (1.236 Fib)
$374.16–$380.95 (1.618 zone)
🌍 Macro Alignment
Bullish backdrop:
Tech sector leading broader rally
Tesla’s robotaxi and AI narrative lifting sentiment
Oil down → margin relief for EV production
Catalysts this week: Powell testimony, PCE inflation
📈 Trading Plan
Type Direction Entry Target(s) Stop Loss Confidence
Intraday Bearish $352–$353 rejection zone $343 → $338.5 Above $357.5 🔶 Medium
Swing (Buy the dip) Bullish $338–$334 zone $366.47 → $374.16 Below $330 🟢 Strong
📌 Suggested Strategy
Scalp short if rejection at $353.2–$357.5 confirms with bearish candle on volume.
Add long exposure if price consolidates or reverses from the $338–$334.5 support area.
Monitor Powell’s remarks – Any dovish tilt could accelerate tech upside.
TSLA sentiment remains strong, but intraday shakeouts are expected.
✍️ Summary Signal
“TSLA remains bullish on a swing basis, but intraday looks set for a Fibonacci pullback to $338–$334. Buy dips if structure holds. Macro backdrop (robotaxi + Fed pause) supports continuation to $366–$374.”

$TSLA The Magnificent PennyWelcome to a comprehensive analysis of the little Penny Stock that could..
NASDAQ:TSLA is at it again, ripping shorts and trapping longs. Business as usual.
NASDAQ:TSLA operates primarily from one chart being the Hourly. All signals giveth and all Signal taketh away from this chart.
At present we are seeing a distinctive weakness creeping into the hourly chart which is presently in a distribution pattern making lower lows on it's consolidation. The trend is just starting to turn bearish and as you can see from our dynamic support and resistance levels, our first stop after already retesting resistance is a fill of the box at 316.14
Once this box is broken we can expect to fill the lower gap at 291.85 being a weekly support target.
Finally if a run back to the 265.13 Monthly target would complete the Market Maker discount to grab stock and push it higher from here.
All things being equal, NASDAQ:TSLA is a great short in the mid-term with both CCI and MA angle breaking to the downside.

Tesla: Robotaxi Hype and Breakout WatchNASDAQ:TSLA surged nearly +10% today, driven by growing anticipation around the upcoming robotaxi unveiling on August 8.
Investors are positioning early, speculating this innovation could open new revenue streams for Tesla and redefine mobility.
📊 Technical Setup:
• Price broke out of local resistance near $330
• Approaching major resistance at $370–371 (Bollinger Band + prior support)
• If $370 is broken and held, the stock could enter a new trading range: $370–$440
• RSI and Stochastic are heating up, but no signs of reversal yet
⚙️ Robotaxi Catalyst:
• Elon Musk confirmed the Robotaxi event set for August 8
• Analysts speculate this could boost valuation through AI and self-driving revenue potential
• Option volume and retail interest are rising fast
📌 Levels to watch:
• Breakout level: $370
• Target: $440
• Support zone: $330
• Invalidation: Close below $310
👀 Watch for pre-event momentum. A break above $370 could trigger a squeeze.

TSLA (daytrading) break out and retest1. Still watching here (down trend is too strong)
We can see break out patterm
2. And came back to restest. But i worry about that tsla usually doesnt restest like that.
3. Hit sma 200 h1

TSLA: Anyone knows this powerful pattern?TSLA:
Anyone knows this powerful pattern?
The crowd gets lost in colorful indicators, forgetting that the market speaks clearly through just price and volume.
.
US STOCKS- WALL STREET DREAM- LET'S THE MARKET SPEAK!

Tesla, Inc. (TSLA) Boosted by Energy StorageTesla, Inc. (TSLA) is a global leader in electric vehicles, clean energy solutions, and battery technology. The company designs and manufactures EVs, solar products, and energy storage systems that help drive the transition to sustainable energy. Tesla’s growth is fueled by rising EV adoption, battery innovations, and expansion into new markets with its cutting-edge technologies.
On the chart, a confirmation bar with increasing volume signals strong buying interest. The price has moved into the momentum zone by breaking above the .236 Fibonacci level. A trailing stop can be set just below this level using the Fibonacci snap tool to protect gains as momentum continues.

TSLA long scenario
TSLA long scenario
1.. important Registance ( $370 )
if break midpoint ( $370 ) next TP $457
2. i expect some correction near $ 330
it will be one more buy chance
-----------------------------------------
based on price action
harmonic theory

TSLA Breaking Out! Is This Just the Beginning or a Trap? Jun 24 🔥Price Action Overview:
TSLA had a powerful move, jumping +8.23% to $348.68. It cleared key resistance and now consolidates near $349–350. Volume surged, but we’re seeing a bull flag structure with some internal weakness forming.
🧠 Smart Money Market Structure (15-min Chart)
* CHoCH occurred before the breakout, showing smart money accumulation.
* Break of Structure (BOS) confirms bullish intent.
* Price is now ranging in a supply zone, rejecting upper levels with signs of compression.
* Consolidation wedge suggests a possible breakout or fakeout setup.
🔮 Gamma Exposure (GEX) Breakdown (1h Chart)
* Current Price: $348.68
* Gamma Resistance (Call Wall):
* $357.53 → 1st resistance
* $365.00 → heavy resistance
* $367.5 → Extreme Call Wall / GEXY8
* Gamma Support:
* $340 → strong support
* $320 → HVL (High Volume Level) and PUT defense
* $315 / 312.5 → 2nd PUT Wall (if breakdown)
Interpretation:
Price is trapped between GEX compression levels. A breakout above $350 could trigger a gamma squeeze toward $357–360+. A breakdown below $340 targets $320 fast.
📈 Indicators Snapshot
* Volume: High on the breakout, but tapering off during consolidation.
* RSI/MACD (not shown): Likely cooling off — favoring a pullback or re-accumulation.
* CHoCH & OB Zones: Indicate smart money watching $340-$345 for support retest.
⚖️ Scalping vs Swing Outlook
✅ Bullish Case
* Break above $350 → Watch $357.50 and $365 targets.
* Above $367 = gamma squeeze zone unlocked.
Entry: Break and hold $350
Target: $357.50, then $365
Stop: Below $345
⚠️ Bearish Case
* Break below $340 → Flush to $320 and possibly $315
* GEX puts will dominate under $320
Entry: Break and hold below $340
Target: $320, $315
Stop: Above $345
🧭 Trade Strategy Summary
* ⚔️ Inflection Zone: $340–$350 = Decision zone
* 🚀 Watch for gamma squeeze if $350+ holds
* 🛑 Breakdown below $340 flips bias bearish
* 🔄 Volume confirmation is key
Disclaimer: This analysis is for educational purposes only and does not constitute financial advice. Always do your own research and manage risk carefully.

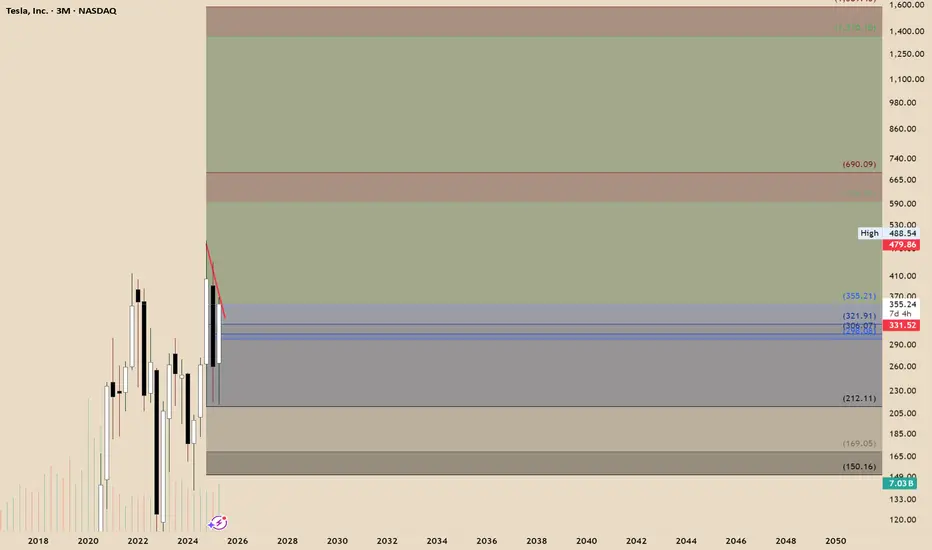
A Bullish Long-Term Outlook Tesla continues to present a compelling case for long-term investors, underpinned by its innovation-led growth trajectory and emerging dominance in autonomous mobility. Technically, recent market structure reveals an imbalance within a quarterly bullish breaker, suggesting further price expansion. If macroeconomic conditions remain favorable, the next algorithmic target zones fall between $594 and $690, signaling potential upside.
On the fundamental front, Tesla’s recent moves—particularly its rollout of the robotaxi network—have ignited fresh investor optimism. Analysts now estimate that autonomous driving could account for a substantial portion of Tesla’s future valuation, with some long-range forecasts placing the stock above $2,000 within the next several years.
While short-term pressures such as softening EV demand and regulatory barriers persist, Tesla’s consistent execution on AI-driven mobility may unlock new valuation territory.
TSLA ready to head higherTSLA at the 200 SMA coming out of a sell off.... After the RoboTaxi debut, may get positive momentum to go higher ...

Bullish Setup Suggests Rally Towards $350 Zone
- T1 = $340.00
- T2 = $350.00
Stop Levels:
- S1 = $315.00
- S2 = $310.00
**Wisdom of Professional Traders:**
This analysis synthesizes insights from thousands of professional traders and market experts, leveraging collective intelligence to identify high-probability trade setups. The wisdom of crowds principle suggests that aggregated market perspectives from experienced professionals often outperform individual forecasts, reducing cognitive biases and highlighting consensus opportunities in Tesla.
**Key Insights:**
Tesla continues to receive robust interest as macroeconomic conditions favor growth-oriented companies, particularly in the electric vehicle sector. The recent earnings showed signs of stabilization in gross margins, thanks to operational efficiency and cost reductions. Similarly, the company's megapack energy storage segment is gaining traction, which provides an ancillary growth avenue outside its core vehicle business. Technical indicators suggest strong momentum, with Tesla's Relative Strength Index (RSI) approaching bullish levels while trading volume supports the ongoing price recovery.
Furthermore, global EV adoption continues to rise, with increased government support for sustainable energy initiatives securing Tesla's place as a leading player. Supply chain constrictions, previously a concern, are relaxing, providing tailwinds for smoother production cycles.
**Recent Performance:**
Tesla's stock has gained over 8% in the past two weeks, recovering from its support levels around $305. The recent breakout above $320 signals renewed buying interest, accompanied by increased institutional participation. Short-term volatility has brought manageable dips, but overall momentum indicates bullish consolidation towards higher highs in its near-term trading range.
**Expert Analysis:**
Market strategists highlight Tesla’s ability to outperform its competitors due to vertical integration, advanced battery technologies, and scaling of operational efficiencies. Technical analysts note Tesla hovering near an ascending triangle formation with breakout potential above $330. Analysts also observe robust support around $310, which acts as a safety net for downside risks. Moving averages, especially the 50-day and 200-day lines, are converging as they indicate sustained bullish sentiment.
**News Impact:**
Recent news regarding expanded production facilities in Europe and positive developments in autonomous driving technology have fueled optimism among investors. Further bolstering sentiment is CEO Elon Musk’s strategic focus on prioritizing volumes over short-term profit metrics—a move widely seen as prudent given the current competitive landscape in EV markets.
**Trading Recommendation:**
Tesla is primed for upside momentum and presents an attractive long opportunity for traders targeting $340 and $350 next price zones. Its technical and fundamental outlook support the bullish case as macroeconomic tailwinds and company-specific factors align for higher valuations. Focus on maintaining risk discipline by exiting trades if stops at $315 or $310 are breached. For patient investors, Tesla is likely to remain a candidate for continued capital appreciation.

Quick View: $TSLA
- Bullish Box on the daily chart supported by the ema50d and strong ema 21d and 9d. No volume on this box.
- Almost the same pattern on the hourly

$TSLA Long-Term View: From $2 to $300+—How Far Can Vision Go?
📈 13-Year Monthly Chart of NASDAQ:TSLA
A $20,000 investment in Tesla back in 2012 wasn’t just a bet on a stock—it was a ticket to the future.
By 2014, those gains could’ve paid for a Model S.
By 2019, the same investment might’ve covered a Model Y and Model 3—one for you, one for your spouse.
Now, with Tesla pushing the limits of AI and robotics, could that investment soon deliver a full FSD suite and even a pair of Optimus robots serving in your home?
This chart tracks NASDAQ:TSLA ’s incredible rise—from just $2.19 in 2012 to $319.50 in June 2025.
Sometimes, holding is innovation.

TSLA JUNE 20 2025 READ NOTESThis is momentum based price targeting & Tesla can easily do $390 but before that 342 is a solid resistance. From there we can get a dip and then price can continue the up move further
ANY NEWS IS TO BE AVOIDED
Now price action which is way superior is clearly suggesting the same up move.
I fact RSI is saying $400++ can come but it would be super dafe to exit around $390
If you nave any doubts then you can leave a comment.

TSLA – Long Trade Analysis (30-min chart)!📈
🟢 Chart Pattern: Symmetrical Triangle Breakout
Price is breaking out of a tight triangle, indicating potential momentum buildup. Volume spike confirmation would strengthen the move.
🛒 Entry: Around $322.05 (breakout zone)
🎯 Target Levels (Upside):
TP1: $327.38 (minor resistance)
TP2: $333.72
TP3: $339.71 (strong resistance zone from early June)
🛑 Stop-Loss:
Below $317.30 (triangle base support and recent consolidation low)
This gives a risk/reward ratio of approx. 1:2.5, which is solid.
🧠 Why This Setup Makes Sense:
TSLA is moving ahead of the June 22 robotaxi event
Strong support trendline from June 6
Breakout is aligning with bullish sentiment and upcoming catalyst
Market is bullish overall, helping large-cap tech
⚠️ What to Watch:
Watch for fake breakouts — wait for candle close or volume confirmation
Be ready for volatility as event news can cause whipsaw action
Option traders: Consider bull call spreads if IV is high

What Is T-Distribution in Trading? What Is T-Distribution in Trading?
In the financial markets, understanding T-distribution in probability is a valuable skill. This statistical concept, crucial for small sample sizes, offers insights into market trends and risks. By grasping T-distribution, traders gain a powerful tool for evaluating strategies, risks, and portfolios. Let's delve into what T-distribution is and how it's effectively used in the realm of trading.
Understanding T-Distribution
The T-distribution in probability distribution plays a crucial role in trading, especially in situations where sample sizes are small. William Sealy Gosset first introduced it under the pseudonym "Student". This distribution resembles the normal distribution with its bell-shaped curve but has thicker tails, meaning it predicts more outcomes in the extreme ends than a normal distribution would.
A key element of T-distribution is the concept of 'degrees of freedom', which essentially refers to the number of values in a calculation that are free to vary. It's usually the sample size minus one.
The degrees of freedom affect the shape of the T-distribution; with fewer degrees of freedom, the distribution has heavier tails. As the degrees of freedom increase, the distribution starts to resemble the normal distribution more closely. This is particularly significant in trading when dealing with small data sets, where the T-distribution provides a more accurate estimation of probability and risk than the normal distribution.
T-Distribution vs Normal Distribution
T-distribution and normal distribution are foundational in statistical analysis, yet they serve different purposes. While both exhibit a bell-shaped curve, the T-distribution has thicker tails, implying a higher probability of extreme values. This makes it more suitable for small sample sizes or when the standard deviation is unknown.
In contrast, the normal distribution, with its thinner tails, is ideal for larger sample sets where the standard deviation is known. Traders often use T-distribution for more accurate analysis in small-scale or uncertain data scenarios, while normal distribution is preferred for larger, more stable datasets, where extreme outcomes are less likely.
Application in Trading
In trading, T-distribution is a valuable tool for analysing financial data. It is primarily used in constructing confidence intervals and conducting hypothesis testing, which are essential for making informed trading decisions.
For instance, a trader might use T-distribution to test the effectiveness of a new trading strategy. Suppose a trader has developed a strategy using the technical analysis tools and wants to understand its potential effectiveness compared to the general market performance. They would collect a sample of returns from this strategy over a period, say, 30 days. Given the small sample size, using T-distribution is appropriate here.
The trader would then calculate the mean return of this sample and use T-distribution to create a confidence interval. This interval would provide a range within which the true mean return of the strategy is likely to lie, with a certain level of confidence. If this confidence interval shows a higher mean return than the market average, the trader might conclude that the strategy is potentially effective. However, it's important to note that this is an estimation and not a guarantee of future performance.
How to Plug Probability and Normal Distribution in Your T-Calculation
To use a T-calculator for integrating probability and normal distribution, follow these steps:
- Input Degrees of Freedom: For T-distribution, calculate the degrees of freedom (sample size minus one).
- Convert Z-Score to T-Value: If using normal distribution data, convert the Z-score (standard deviation units from the mean in a normal distribution) to a T-value using the formula: T = Z * (sqrt(n)), where 'n' is the sample size.
- Enter T-Value: Input this T-value into the calculator.
- Calculate Probability: The calculator will then output the probability, providing a statistical basis for trading decisions based on the T-distribution.
Limitations and Considerations of T-Distribution
While T-distribution is a powerful tool in trading analysis, it's important to recognise its limitations and considerations:
- Sample Size Sensitivity: T-distribution is most effective with small sample sizes. As the sample size increases, it converges to a normal distribution, reducing its distinct utility.
- Assumption of Normality: T-distribution assumes that the underlying data is approximately normally distributed. This may not hold true for all financial data sets, especially those with significant skewness or kurtosis.
- Degrees of Freedom Complications: Misestimating degrees of freedom can lead to inaccurate results. It's crucial to calculate this correctly based on the sample data.
- Outlier Sensitivity: T-distribution can be overly sensitive to outliers in the data, which can skew results.
Advanced Applications of T-Distribution in Trading
T-distribution extends beyond basic trading applications, playing a role in advanced financial analyses:
- Risk Modelling: Utilised in constructing sophisticated risk models, helping traders assess the probability of extreme losses.
- Algorithmic Trading: Integral in developing complex algorithms.
- Portfolio Optimisation: Assists in optimising portfolios by estimating returns and risks of various assets.
- Market Research: Used in advanced market research methodologies to analyse small sample behavioural studies.
The Bottom Line
The T-distribution is a powerful tool, offering nuanced insights in scenarios involving small sample sizes or uncertain standard deviations. Its ability to accommodate real-world data's quirks makes it invaluable for various trading applications, from strategy testing to risk assessment. However, understanding its limitations and proper application is crucial for accurate analysis.
This article represents the opinion of the Companies operating under the FXOpen brand only. It is not to be construed as an offer, solicitation, or recommendation with respect to products and services provided by the Companies operating under the FXOpen brand, nor is it to be considered financial advice.

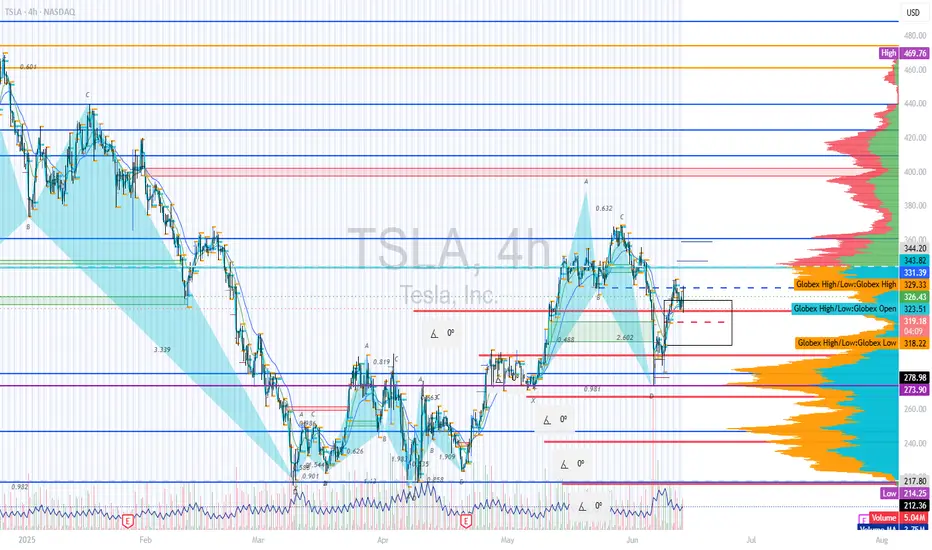
$TSLA Time to Fade or..?NASDAQ:TSLA (like NASDAQ:GOOG ) is standing out to me as bullish, yet, corrective Elliot Waves a higher degree series of ABCs appear to be underway.
A final wave C appears to be underway which would take price too all time highs in an expanded flat correction pattern. My count could be wrong and the interference could be from the increase it sentiment volatility connected to the US headlines lately and Trump posting on socials. Things may get back to normal after the summer and a clearer pattern may emerge.
Price is struggling to get past the weekly pivot point bullishly or the weekly 200EMS bearishly and is trapped within that range.
For now long term target is the R2 daily pivot at $693 as the higher probability is continued upside
Safe trading

Better MACDWhat is the MACD?
The MACD (Moving Average Convergence Divergence) is a momentum and trend-following indicator. It’s based on the difference between two EMAs (Exponential Moving Averages) and helps spot:
Trend direction
Momentum shifts
Reversals
Entry/exit points
✅ Basic MACD Techniques
1. Signal Line Crossovers
Bullish Crossover: MACD line crosses above Signal → buy signal
Bearish Crossover: MACD line crosses below Signal → sell signal
🔸 Works best in trending environments, 200 SMA as a filter.
🔸 Combine with volume or trend filters for best results
2. Zero Line Crossovers
When MACD crosses above 0, the shorter EMA is above the longer EMA → bullish. This is typically the sign of a larger trend than crossovers.
When MACD crosses below 0, shorter EMA is below → bearish
🔸 Zero line = baseline momentum direction
🔸 Cross above = bullish trend confirmation
🔸 Cross below = bearish confirmation
3. Histogram Momentum
The histogram is often the first sign of a shift before a crossover happens.
Read it like this:
Histogram growing: Increasing momentum in that direction
Histogram shrinking: Momentum is fading
Histogram changing color (in many indicators): Potential reversal
🔸 Use histograms to get early signals, even before crossovers. Confirmed with volume surge and Price Action.
🔍 Advanced MACD Tricks
📉 4. Divergence Detection
Divergence occurs when price and MACD move in opposite directions.
🔸 Bullish Divergence:
Price makes lower lows
MACD makes higher lows
→ Hidden buying pressure, trend reversal likely
🔸 Bearish Divergence:
Price makes higher highs
MACD makes lower highs
→ Trend weakening, reversal likely
🔹 Confirm with:
RSI, when the lower timeframe RSI is oversold and the higher timeframe MACD is rising, then it's a good sign, and the opposite is true for bears.
Support/resistance zone: draw trendlines either on the volume or price and watch out for retests on the breakout.
Candlestick reversal patterns: some bearish patterns are bullish on indexes because of dollar cost averaging.

Long-Term Growth Potential in the Face of Short-Term ChallengesCurrent Price: $323.63
Direction: LONG
Targets:
- T1 = $331.50
- T2 = $345.00
Stop Levels:
- S1 = $319.50
- S2 = $310.00
**Wisdom of Professional Traders:**
This analysis synthesizes insights from thousands of professional traders and market experts, leveraging collective intelligence to pinpoint high-probability trade setups. The wisdom of crowds principle suggests that aggregated perspectives from experienced professionals build a more balanced outlook on Tesla, reducing emotional biases and highlighting consensus opportunities in the market.
**Key Insights:**
Tesla is currently navigating through a challenging phase characterized by competitive pressures in both China and Europe. Recent macroeconomic headwinds, including rising interest rates and shrinking global spending on electric vehicles, have fueled concerns about short-term sales performance. However, analysts remain optimistic about Tesla's innovation leadership, particularly in AI-driven robotics, battery technology, and autonomous mobility development. The recent technical charts reflect a narrowing wedge formation, and a breakout above $354.78 could confirm renewed bullish momentum, offering significant upside potential.
**Recent Performance:**
Over the past few weeks, Tesla has experienced tight price consolidation, underlying near-term indecision among market participants. While its stock price remains below short-term moving averages, signaling bearish pressure, longer-term sentiment is bolstered by overall optimism in the technology sector. Additionally, fluctuations in deliveries and revenue from various regions continue to impact day-to-day trading sentiment, with the stock showcasing higher volatility during earnings updates.
**Expert Analysis:**
Market analysts exhibit cautious optimism surrounding Tesla. Short-term concerns linger about declining sales growth in legacy markets such as Europe and the loss of its dominant position in China due to rising competition from local manufacturers like BYD. However, whether Tesla can monetize its cutting-edge developments in AI, robotics, and autonomous driving remains a focal point of its long-term strategy. Analysts agree that while these initiatives may redefine the EV market over the next 5-10 years, revenue realization is expected to be slow and could dampen speculative enthusiasm in the immediate term.
**News Impact:**
Tesla recently announced the launch of its robo-taxi initiative, beginning trials in Austin, Texas, a move that challenges traditional mobility norms. While this innovation enhances Tesla's narrative as a disruptor in the industry, regulatory obstacles and scalability issues pose immediate hurdles that could delay market adoption. On the downside, Tesla saw declining deliveries in Europe and China, casting shadows over its near-term growth prospects in these critical regions. Investors should keep a close eye on upcoming earnings reports for clearer guidance on production schedules and delivery forecasts.
**Trading Recommendation:**
Based on recent technical consolidation and consensus expert views, traders are recommended to take a long position on Tesla with price targets of $331.50 and $345.00. The stock exhibits signs of medium-term upside potential if momentum aligns with broader bullish trends in the S&P 500 and technology sectors. Implement disciplined risk management with stop levels set at $319.50 and $310.00 to protect against unfavorable moves. Investing in Tesla provides exposure to a high-risk innovation-driven narrative; traders should evaluate their appetite for risk carefully before entering this position.

The Importance of Price HistoryAs you can see, even the first year of a stocks price history can influence trends forever
TSLA is now at a key level on a historical trend, riding a longtime trendline while being sandwiched in a strong support/resistance area since 2021. Watching for big moves that signal the S & P 500's direction in the coming month, the next price move will be volatile
If TSLA falls below $100 it's in big danger of falling down that grey imbalance zone on the monthly. The volatility of this stock is it's greatest asset and weakness. Personally, I wouldn't want to be trading this stock without a tight stop loss
